. 2023 May 3;24(9):8190.
doi: 10.3390/ijms24098190.

Characterization of Human Subcutaneous Adipose Tissue and Validation of the Banking Procedure for Autologous Transplantation

Affiliations

Characterization of Human Subcutaneous Adipose Tissue and Validation of the Banking Procedure for Autologous Transplantation

Francesca Favaretto et al. Int J Mol Sci. .

Abstract

Adipose tissue (AT) is composed of a heterogeneous population which comprises both progenitor and differentiated cells. This heterogeneity allows a variety of roles for the AT, including regenerative functions. In fact, autologous AT is commonly used to repair soft tissue defects, and its cryopreservation could be a useful strategy to reduce the patient discomfort caused by multiple harvesting procedures. Our work aimed to characterize the cryopreserved AT and to validate its storage for up to three years for clinical applications. AT components (stromal vascular fraction-SVF and mature adipocytes) were isolated in fresh and cryopreserved samples using enzymatic digestion, and cell viability was assessed by immunofluorescence (IF) staining. Live, apoptotic and necrotic cells were quantified using cytometry by evaluating phosphatidylserine binding to fluorescent-labeled Annexin V. A multiparametric cytometry was also used to measure adipogenic (CD34+CD90+CD31-CD45-) and endothelial (CD34+CD31+CD45-) precursors and endothelial mature cells (CD34-CD31+CD45-). The maintenance of adipogenic abilities was evaluated using in vitro differentiation of SVF cultures and fluorescent lipid staining. We demonstrated that AT that is cryopreserved for up to three years maintains its differentiation potential and cellular composition. Given our results, a clinical study was started, and two patients had successful transplants without any complications using autologous cryopreserved AT.

Keywords: adipocytes; adipose tissue; autologous transplantation; regenerative medicine; stromal vascular fraction; tissue banking.


Conflict of interest statement

The authors declare no conflict of interest.

Figures

Figure 1
Figure 1
Evaluation of cell viability in the SVF (stromal vascular fraction) of fresh (t0) and cryopreserved AT (t1–t5) using microscopy (n = 4). In (a), number of viable cells normalized by sample weight (g) calculated using nuclear fluorescent staining for each time point. (b) Percentage of viable SVF calculated using nuclear fluorescent staining for each time point. The cell count (cells/g) and the viability (%) of each class are displayed as box plot graphs, where 5th and 95th percentiles are highlighted with black circles, the medians with solid lines and the means with dotted lines. The data were analyzed using one-way ANOVA on ranks (n = 4 for each time point). (t0: fresh lipoaspirate, t1: 1-month storage, t2: 2-month storage, t3: 3-month storage, t4: 14-month storage, t5: 36-month storage).
Figure 2
Figure 2
Evaluation of cell viability in the SVF (stromal vascular fraction) of fresh (t0) and cryopreserved adipose tissue (t1–t5) using flow cytometry. (a) Representative dot plot of fresh and cryopreserved samples stained with annexin V-FITC and propidium iodide (red dots, ANV-PI+: necrotic cells; blue dots, ANV+PI+: late apoptotic cells; green dots, ANV+PI-: early apoptotic cells; black dots, ANV-PI-: live cells). (b) Quantification of cell viability (%) estimated using flow cytometry. The y-axes reported the different populations. The percentages of each class are displayed as box plot graphs where 5th and 95th percentiles are highlighted with black circles, the medians with solid lines and the means with dotted lines. The data were analyzed using one-way ANOVA on ranks and when statistically significant Dunn’s post hoc test was applied (n = 4 for each time point, t0: fresh lipoaspirate, t1: 1-month storage, t2: 2-month storage, t3: 3-month storage, t4: 14-month storage, t5: 36-month storage (c) Correlation between the percentage of viable cells estimated using microscopy with fluorescent nuclear staining (y-axis) and flow cytometry (x-axis).
Figure 3
Figure 3
Immunophenotyping of the SVF cells in fresh (t0) and cryopreserved AT (t1−t5) using flow cytometry. (a) Representative flow cytometric dot plots of surface markers (CD45, CD34 and CD31) of fresh and cryopreserved lipoaspirates. CD34 vs. CD31 defines the percentage of adipose stromal/stem cells (ASCs) (CD34+CD31-CD45-), endothelial progenitor cells (CD34+CD31+CD45-) and endothelial mature cells (CD34-CD31+CD45-) within SVF. (b) Quantification of ASCs, endothelial progenitor and endothelial mature cells contained in SVF. The percentages of each class are displayed as box plot graphs where 5th and 95th percentiles are highlighted with black circles, the medians with solid lines and the means with dotted lines. CD90+ (%) denotes the quantification of CD45-CD31-CD34+ expressing the mesenchymal marker (CD45-CD31-CD34+CD90+). The data were analyzed using one-way ANOVA on ranks. T0: fresh lipoaspirate, t1: 1 month storage, t2: 2-month storage, t3: 3-month storage, t4: 14-month storage, t5: 36-month storage.
Figure 4
Figure 4
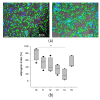
Evaluation of adipogenic differentiation of the SVF (stromal vascular fraction) of fresh (t0) and cryopreserved adipose tissue (t1–t5). Lipid droplets are stained in green using Bodipy 493/503. In (a), representative pictures of an in vitro adipogenesis of SVF obtained from fresh and cryopreserved samples. Adipocyte lipid droplets are stained in green; the blue fluorescence highlights nuclei. Magnification 10×, scale bar 100 µm. In (b), quantification of the adipogenic index of the SVF. The adipogenic index of each class is displayed as box plot where 5th and 95th percentiles are highlighted with black circles, the medians with solid lines and the means with dotted lines. The data were analyzed using one-way ANOVA on ranks and when statistically significant Dunn’s post hoc test was applied (n = 4 for each time point). * p < 0.05. t0: fresh lipoaspirate, t1: 1-month storage, t2: 2-month storage, t3: 3-month storage, t4: 14-month storage, t5: 36-month storage.
Figure 5
Figure 5
Evaluation of cell viability in the adipocyte fraction of fresh (t0) and cryopreserved AT (t1–t5) using microscopy. In (a), representative pictures of a hemocytometer loaded with cell suspension ReadyProbes Cell Viability solution, obtained from fresh and cryopreserved samples. Lipid droplets are stained in green using Bodipy 493/503. Hoechst 33342 (blue) stains all nuclei and propidium iodide stains nuclei of cells with compromised plasma membrane integrity. Magnification 10X, scale bar 100µm. (b) Number of viable adipocytes normalized by sample weight (g), calculated for each time point using nuclear fluorescent staining. Percentage of viable adipocytes for each time point calculated using nuclear fluorescent staining. The number of adipocytes and their viability (%) are displayed as box plot graphs where 5th and 95th percentiles are highlighted using black circles, the medians using solid lines and the means using dotted lines. The data were analyzed using one-way ANOVA on ranks and when statistically significant Dunn’s post hoc test was applied (n = 4 for each time point). * p < 0.05. t0: fresh lipoaspirate, t1: 1-month storage, t2: 2-month storage, t3: 3-month storage, t4: 14-month storage, t5: 36-month storage.
Figure 6
Figure 6
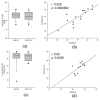
Evaluation of cell viability in cryopreserved AT samples and their paired quality controls (satellite) (n° of samples = 15). In (a), percentage of live cells (stromal vascular fraction, SVF) estimated by immunofluorescence in fat samples and their paired quality controls (satellite). Data (n = 15) are displayed as box plot graphs where 5th and 95th percentiles are highlighted using black circles, the medians using solid lines and the means using dotted lines. In (b), correlation between the percent of viable cells (SVF) quantified in adipose samples (x-axis) and paired quality controls (satellite). In (c), percentage of live cells (adipocytes, AD) estimated by immunofluorescence in fat samples and their paired quality controls (satellite). Data (n = 12) are displayed as box plot graphs where 5th and 95th percentiles are highlighted using black circles, the medians using solid lines and the means using dotted lines. In (d), correlation between the percent of viable cells (AD) quantified in adipose samples (x-axis) and paired quality controls (satellite). Spearman’s correlation coefficient (r) and significance (P) were reported in the plots.
Figure 7
Figure 7
Evaluation of the effects of the delivery temperature on cell number and cell viability of SVF and AD in cryopreserved samples. (a) Number of viable cells normalized by sample weight (g), and in (b), percentage of viable SVF calculated using nuclear fluorescent staining on samples thawed readily after the cryopreservation in vapor phase liquid nitrogen (−160 °C) or following 24 h storage with dry ice (−80 °C) after cryopreservation. In (c), number of viable cells normalized by sample weight (g) and (d) percentage of viable AD calculated using nuclear fluorescent staining on samples thawed readily after the cryopreservation in vapor phase liquid nitrogen (−160 °C) or following 24 h storage with dry ice (−80 °C) after cryopreservation. The cell count (cells/g or cells/mL/g) and the viability (%) of each class are displayed as box plot graphs, where 5th and 95th percentiles are highlighted using black circles, the medians using solid lines and the means using dotted lines. The data were analyzed using one-way ANOVA on ranks (n = 3 for each condition).
Figure 8
Figure 8
Evaluation of the effects of short-term storage at −80 °C on cryopreserved samples. In (a), number of viable SVF cells normalized by sample weight (g) and (b) percentage of viable SVF. (c) Number of viable AD cells normalized by sample weight (g) and (d) percentage of viable AD. AT samples were kept 1 month in vapor phase liquid nitrogen and then thawed (0) or further stored at −80 °C for 1, 2 or 3 months before subsequent analyses. Cell count and viability were estimated using nuclear fluorescent stains; each class of data are displayed as box plot graphs, where 5th and 95th percentiles are highlighted using black circles, the medians using solid lines and the means using dotted lines. The data were analyzed using one-way ANOVA on ranks (n = 3 for each time point).
Figure 9
Figure 9
Representative schematic procedure of the study. In the upper part, lipoaspirates were collected from donors, and samples were stored in vapor phase liquid nitrogen to test the long-term storage (1), establish a quality control for cryopreserved sample (2), evaluate the distribution procedure in dry ice (3) and the temporary storage at −80 °C (4). Below, a brief description of the methodologies used for the analyses. Created with BioRender.com.

Similar articles

Cited by

References

    1. Milan G., Conci S., Sanna M., Favaretto F., Bettini S., Vettor R. ASCs and their role in obesity and metabolic diseases. Trends Endocrinol. Metab. 2021;32:994–1006. doi: 10.1016/j.tem.2021.09.001. - DOI - PubMed
    1. Cawthorn W.P., Scheller E.L., MacDougald O.A. Adipose tissue stem cells meet preadipocyte commitment: Going back to the future. J. Lipid Res. 2012;53:227–246. doi: 10.1194/jlr.R021089. - DOI - PMC - PubMed
    1. McIntosh K., Zvonic S., Garrett S., Mitchell J.B., Floyd Z.E., Hammill L., Kloster A., Di Halvorsen Y., Ting J.P., Storms R.W., et al. The immunogenicity of human adipose-derived cells: Temporal changes in vitro. Stem Cells. 2006;24:1246–1253. doi: 10.1634/stemcells.2005-0235. - DOI - PubMed
    1. Han J., Koh Y.J., Moon H.R., Ryoo H.G., Cho C.H., Kim I., Koh G.Y. Adipose tissue is an extramedullary reservoir for functional hematopoietic stem and progenitor cells. Blood. 2010;115:957–964. doi: 10.1182/blood-2009-05-219923. - DOI - PubMed
    1. Kim K.-S., Seeley R.J., Sandoval D.A. Signalling from the periphery to the brain that regulates energy homeostasis. Nat. Rev. Neurosci. 2018;19:185–196. doi: 10.1038/nrn.2018.8. - DOI - PMC - PubMed

Grants and funding

This research received no external funding.