. 2023 Jun 19;36(6):882-899.
doi: 10.1021/acs.chemrestox.3c00007. Epub 2023 May 10.

Trichloroethylene Metabolite S-(1,2-Dichlorovinyl)-l-cysteine Stimulates Changes in Energy Metabolites and Amino Acids in the BeWo Human Placental Trophoblast Model during Syncytialization

Affiliations

Trichloroethylene Metabolite S-(1,2-Dichlorovinyl)-l-cysteine Stimulates Changes in Energy Metabolites and Amino Acids in the BeWo Human Placental Trophoblast Model during Syncytialization

Anthony L Su et al. Chem Res Toxicol. .

Abstract

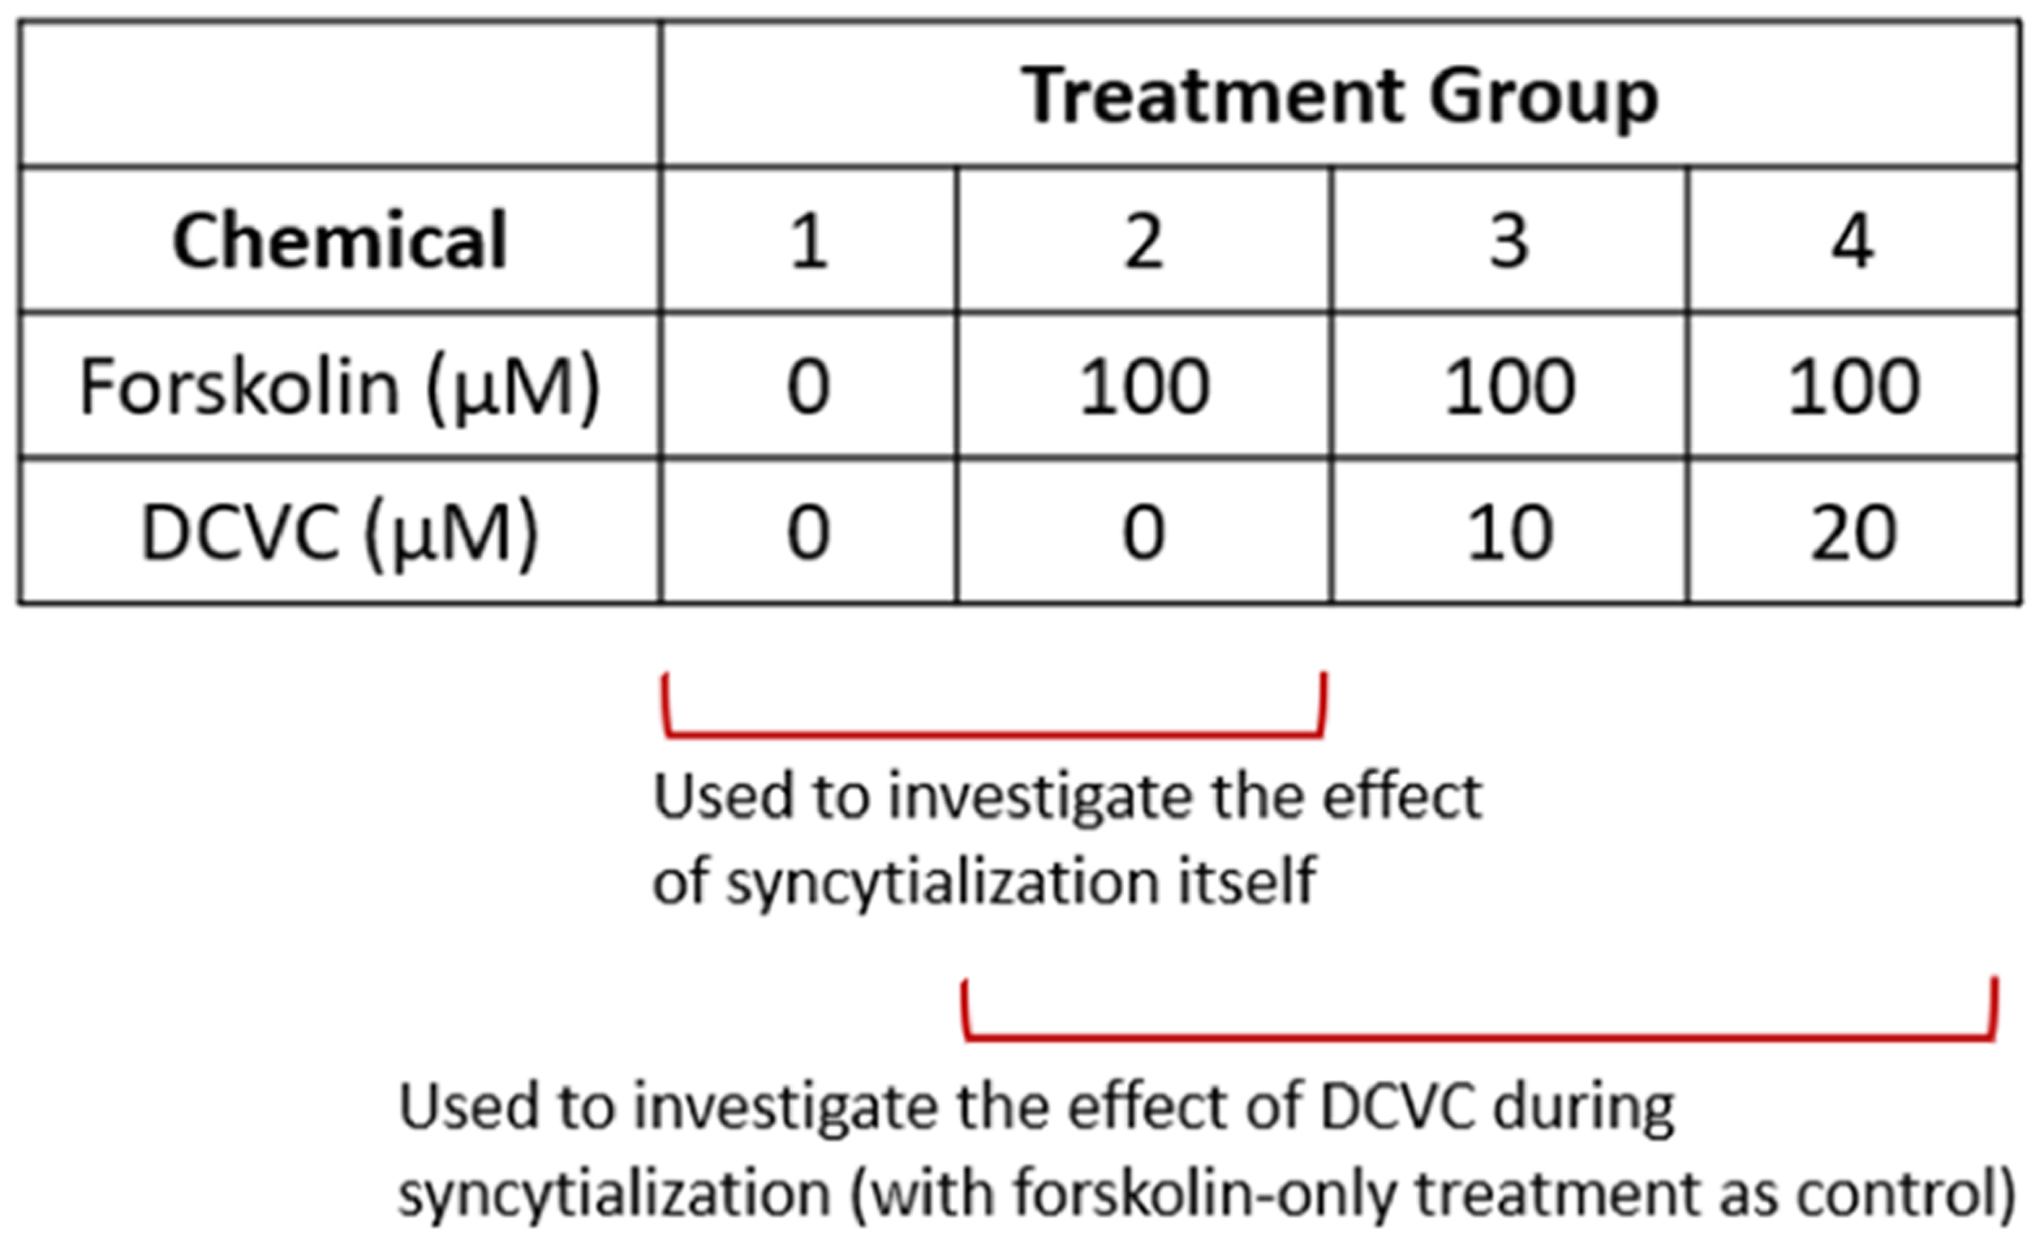
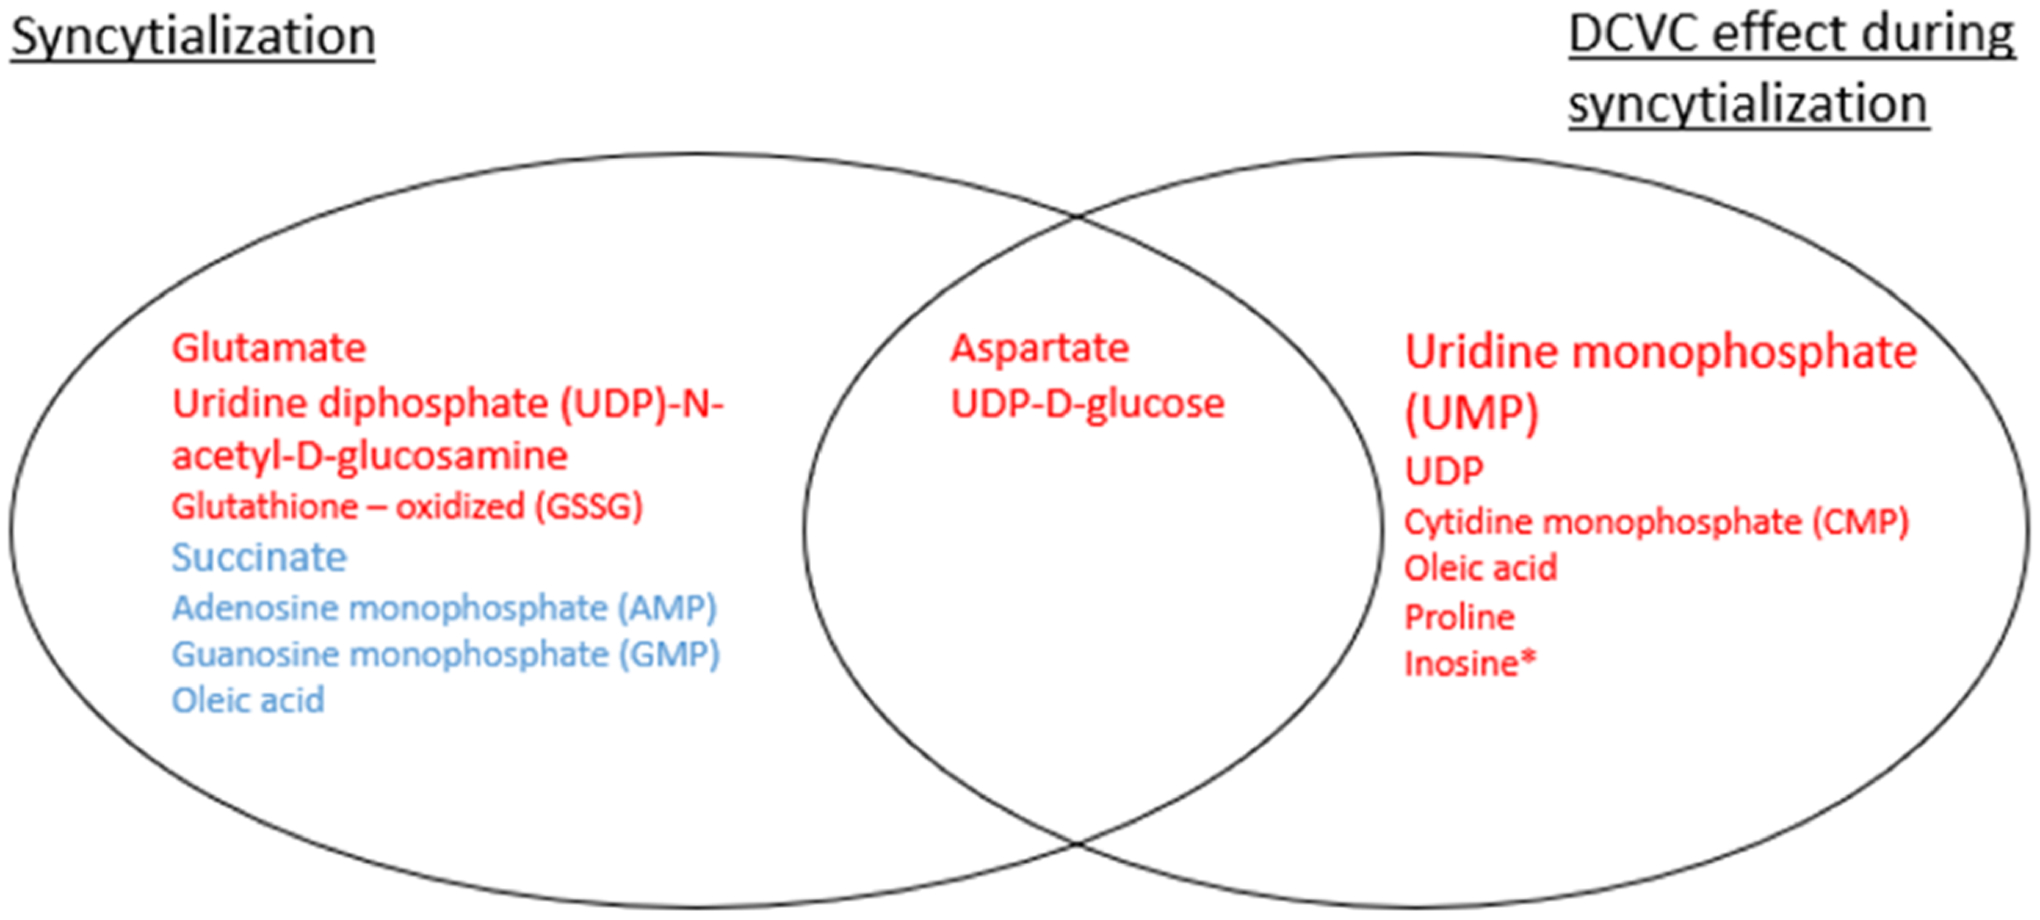
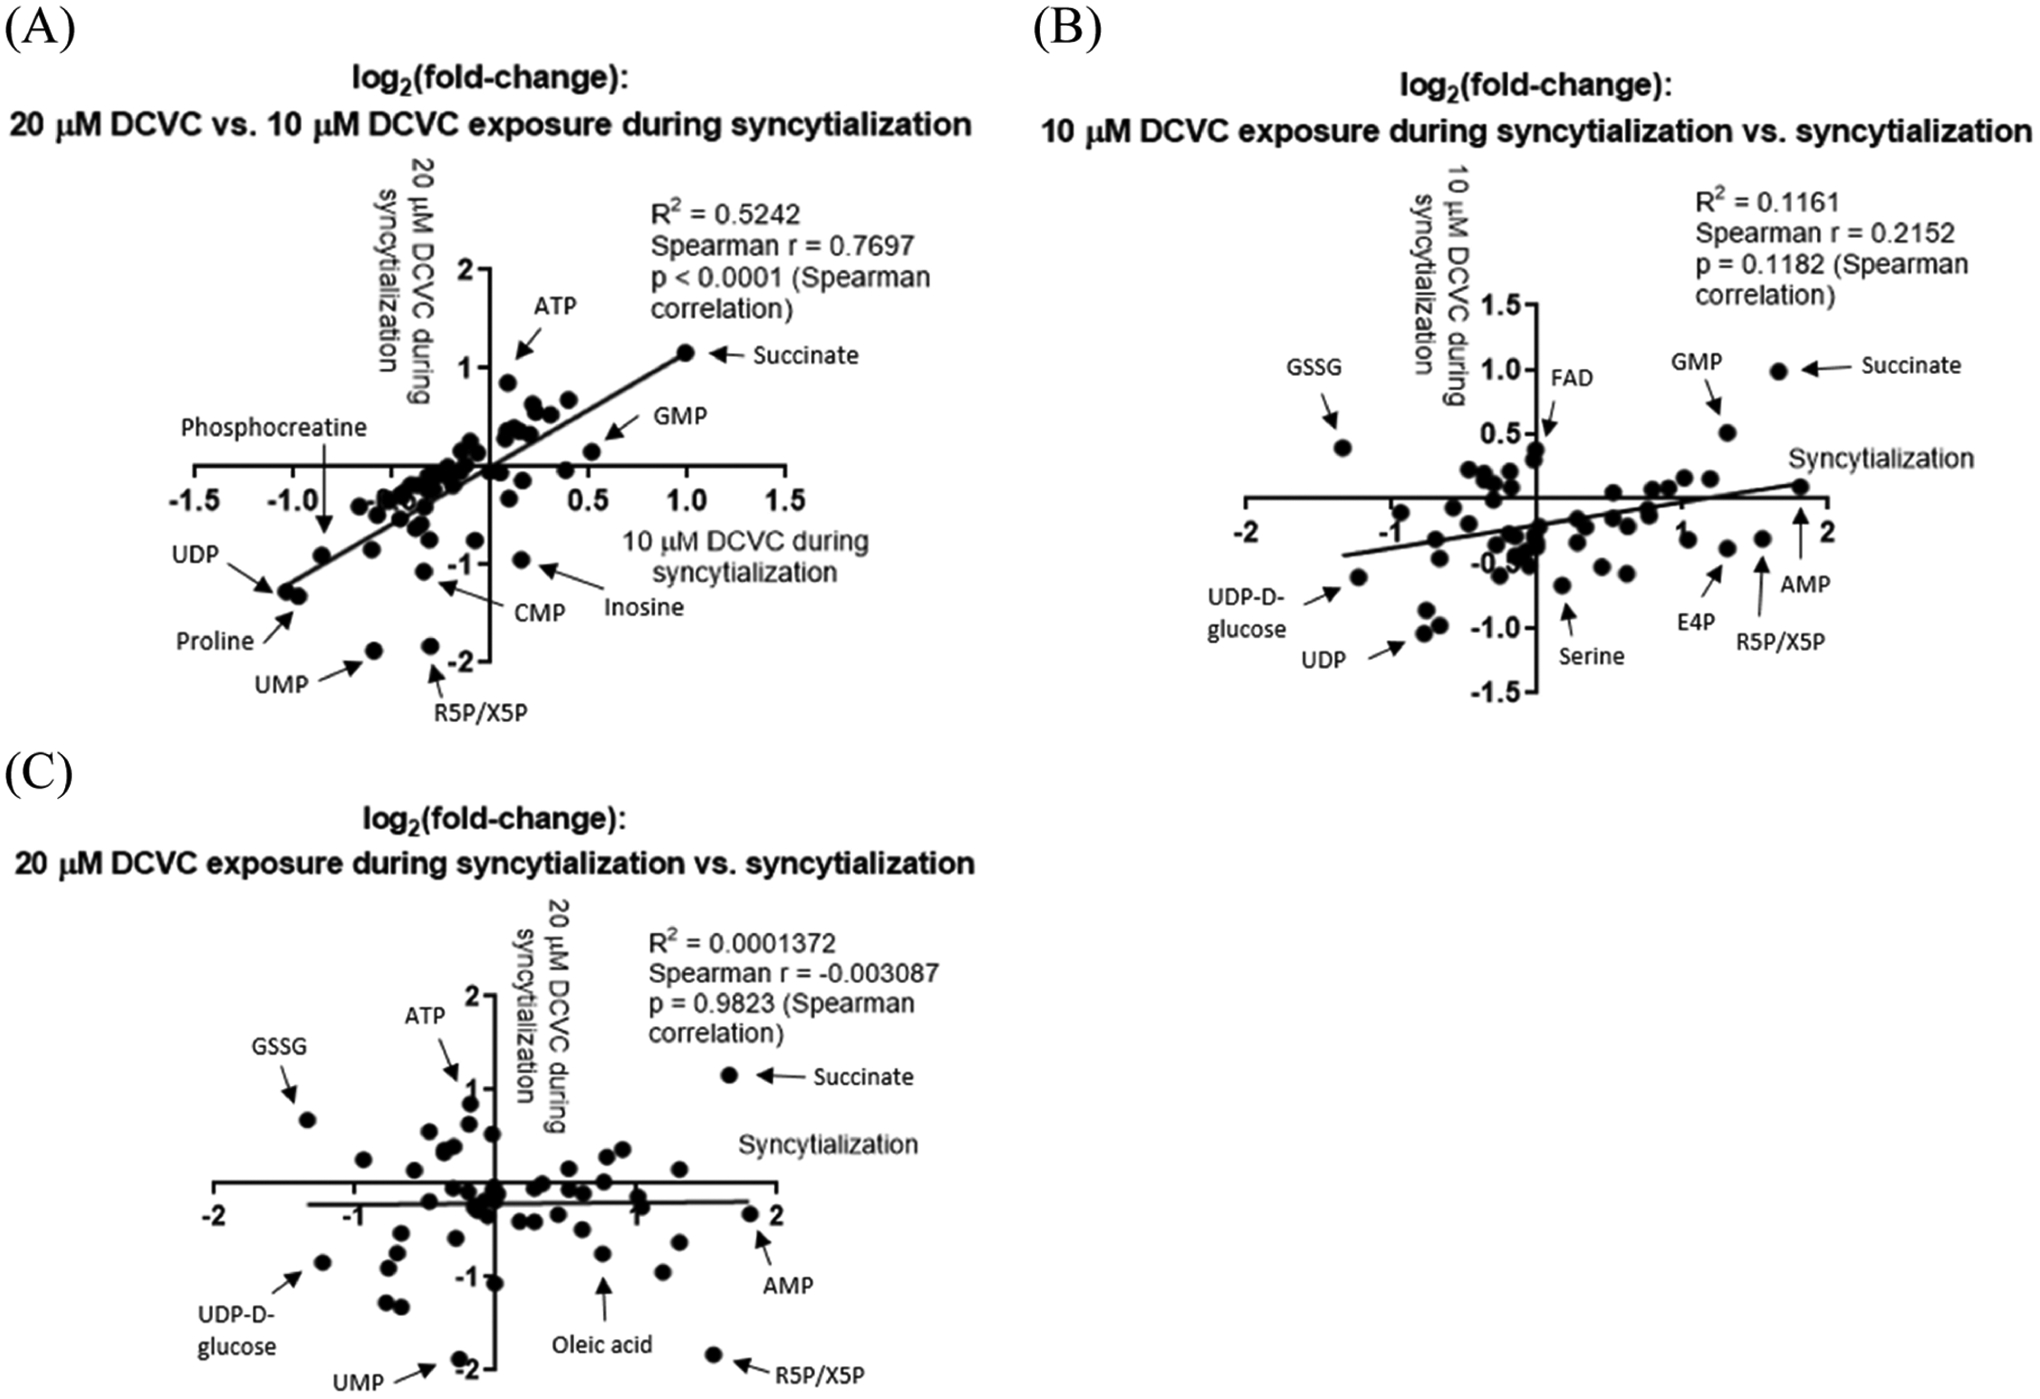
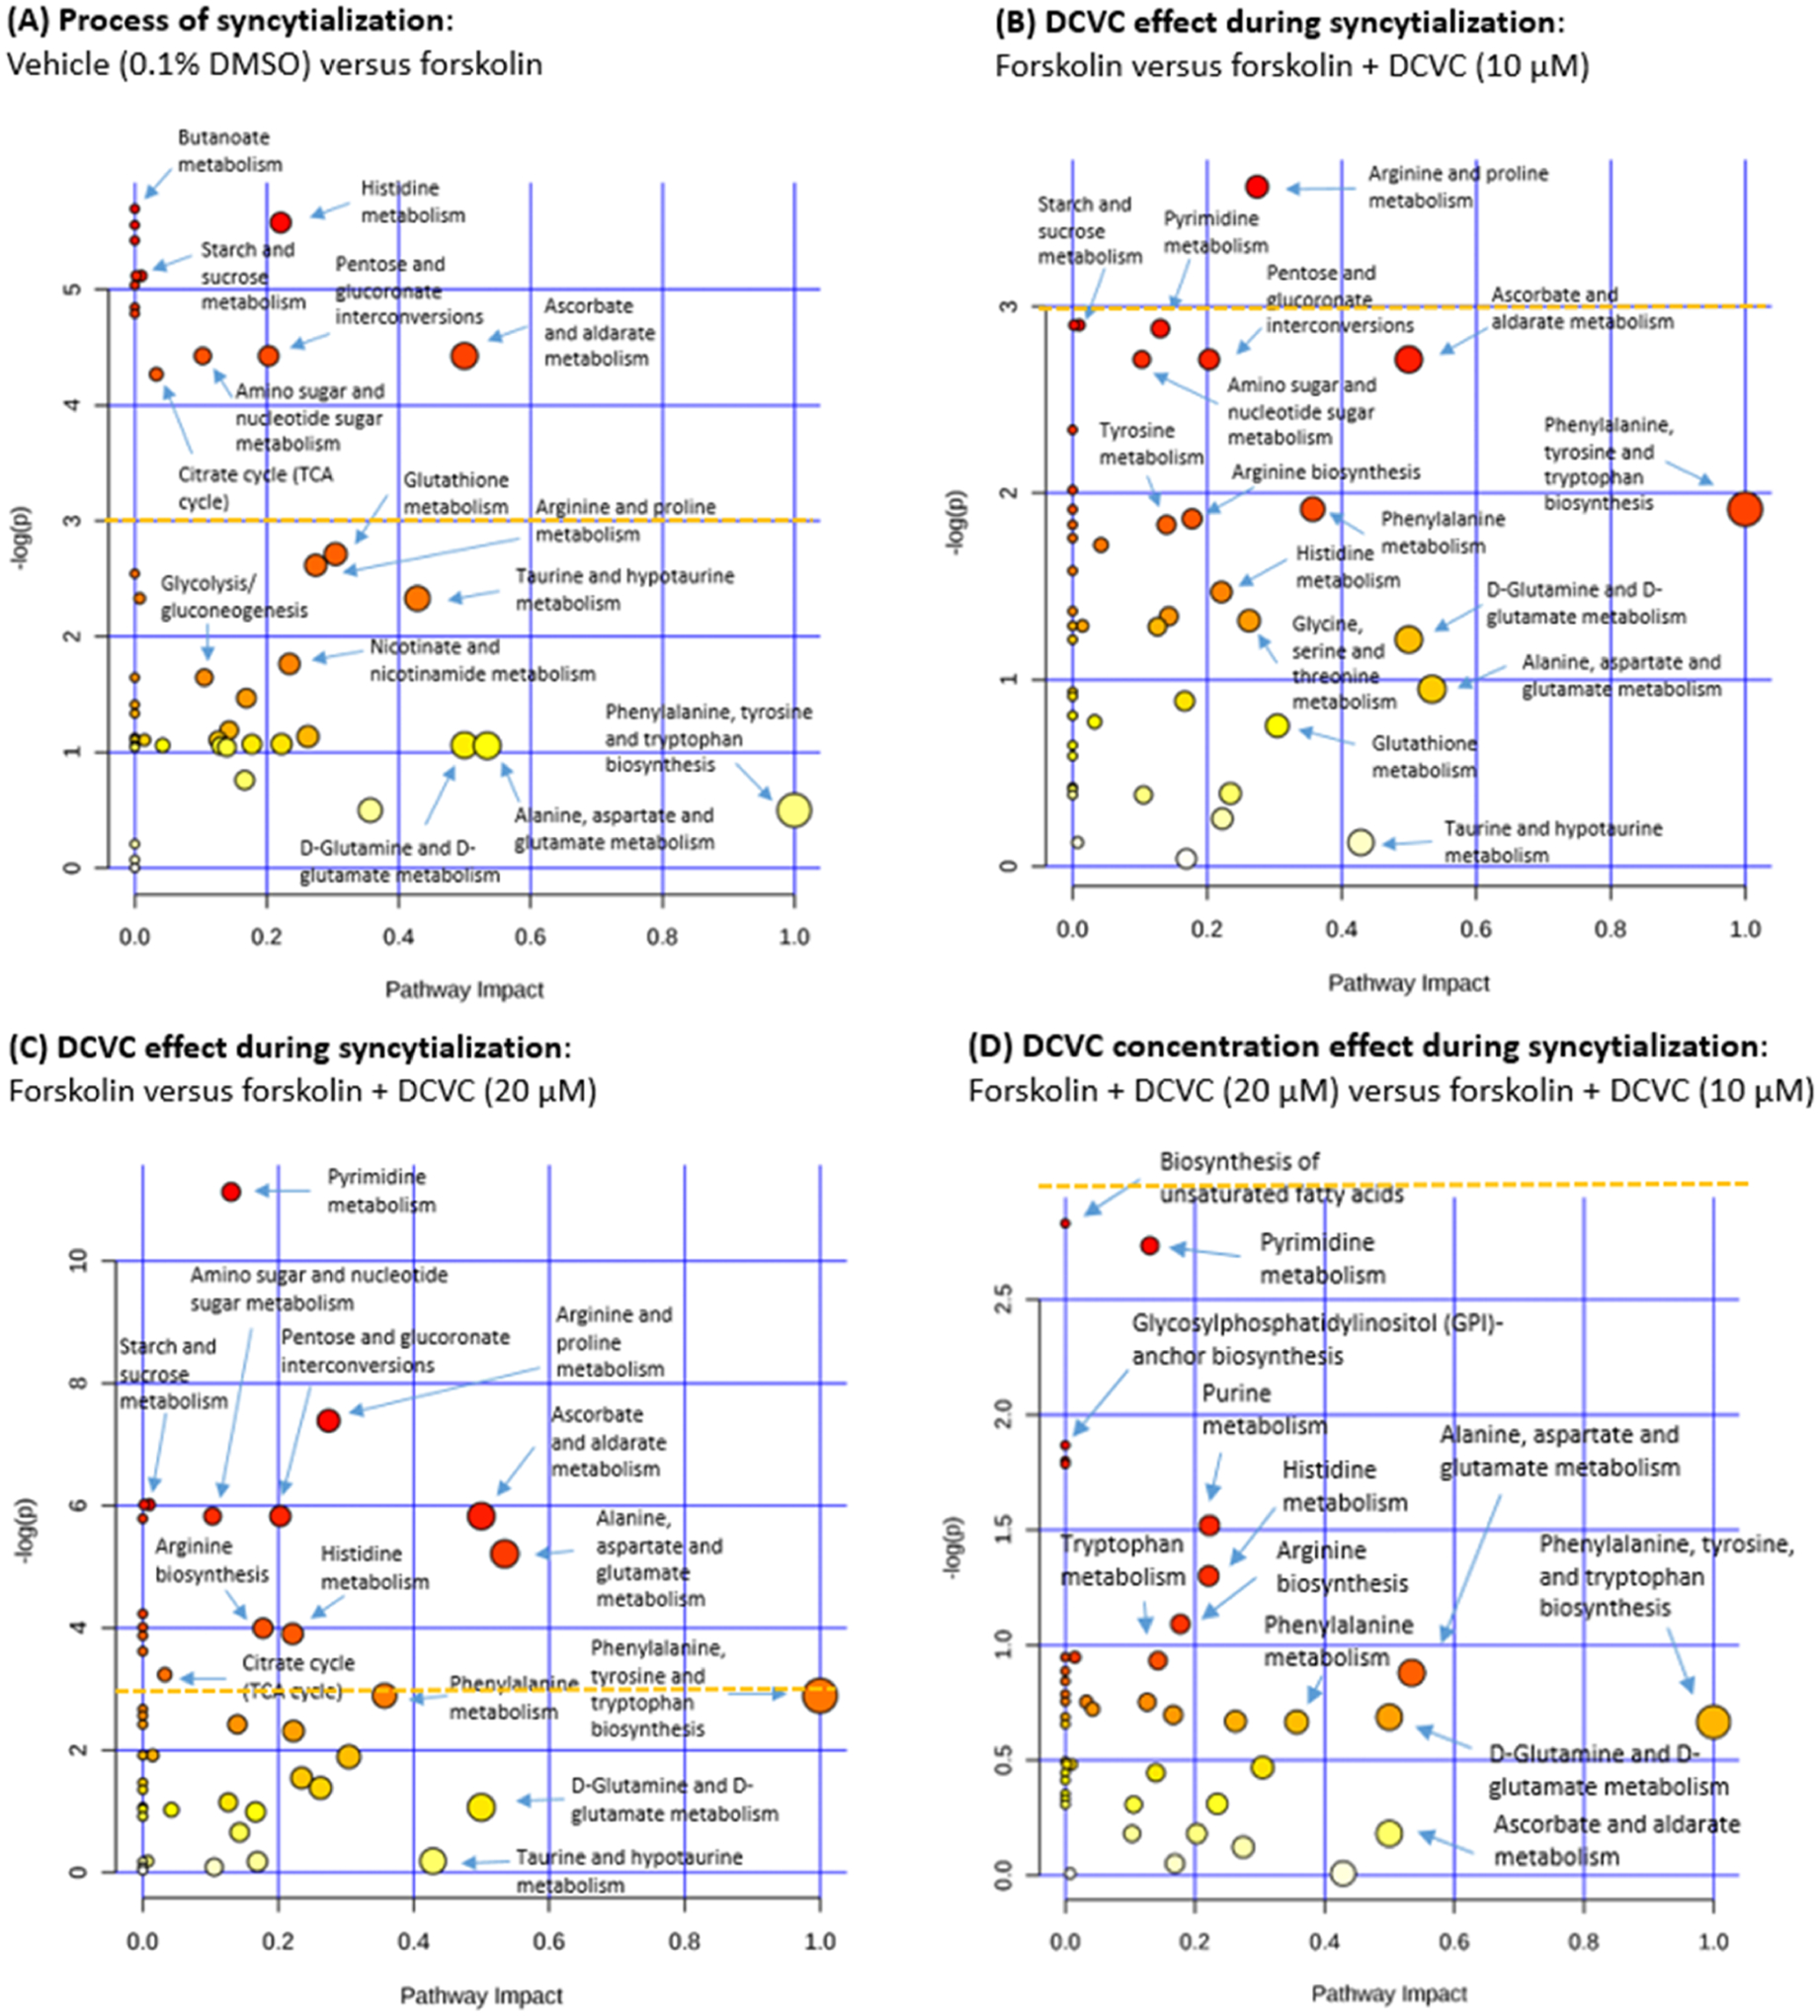
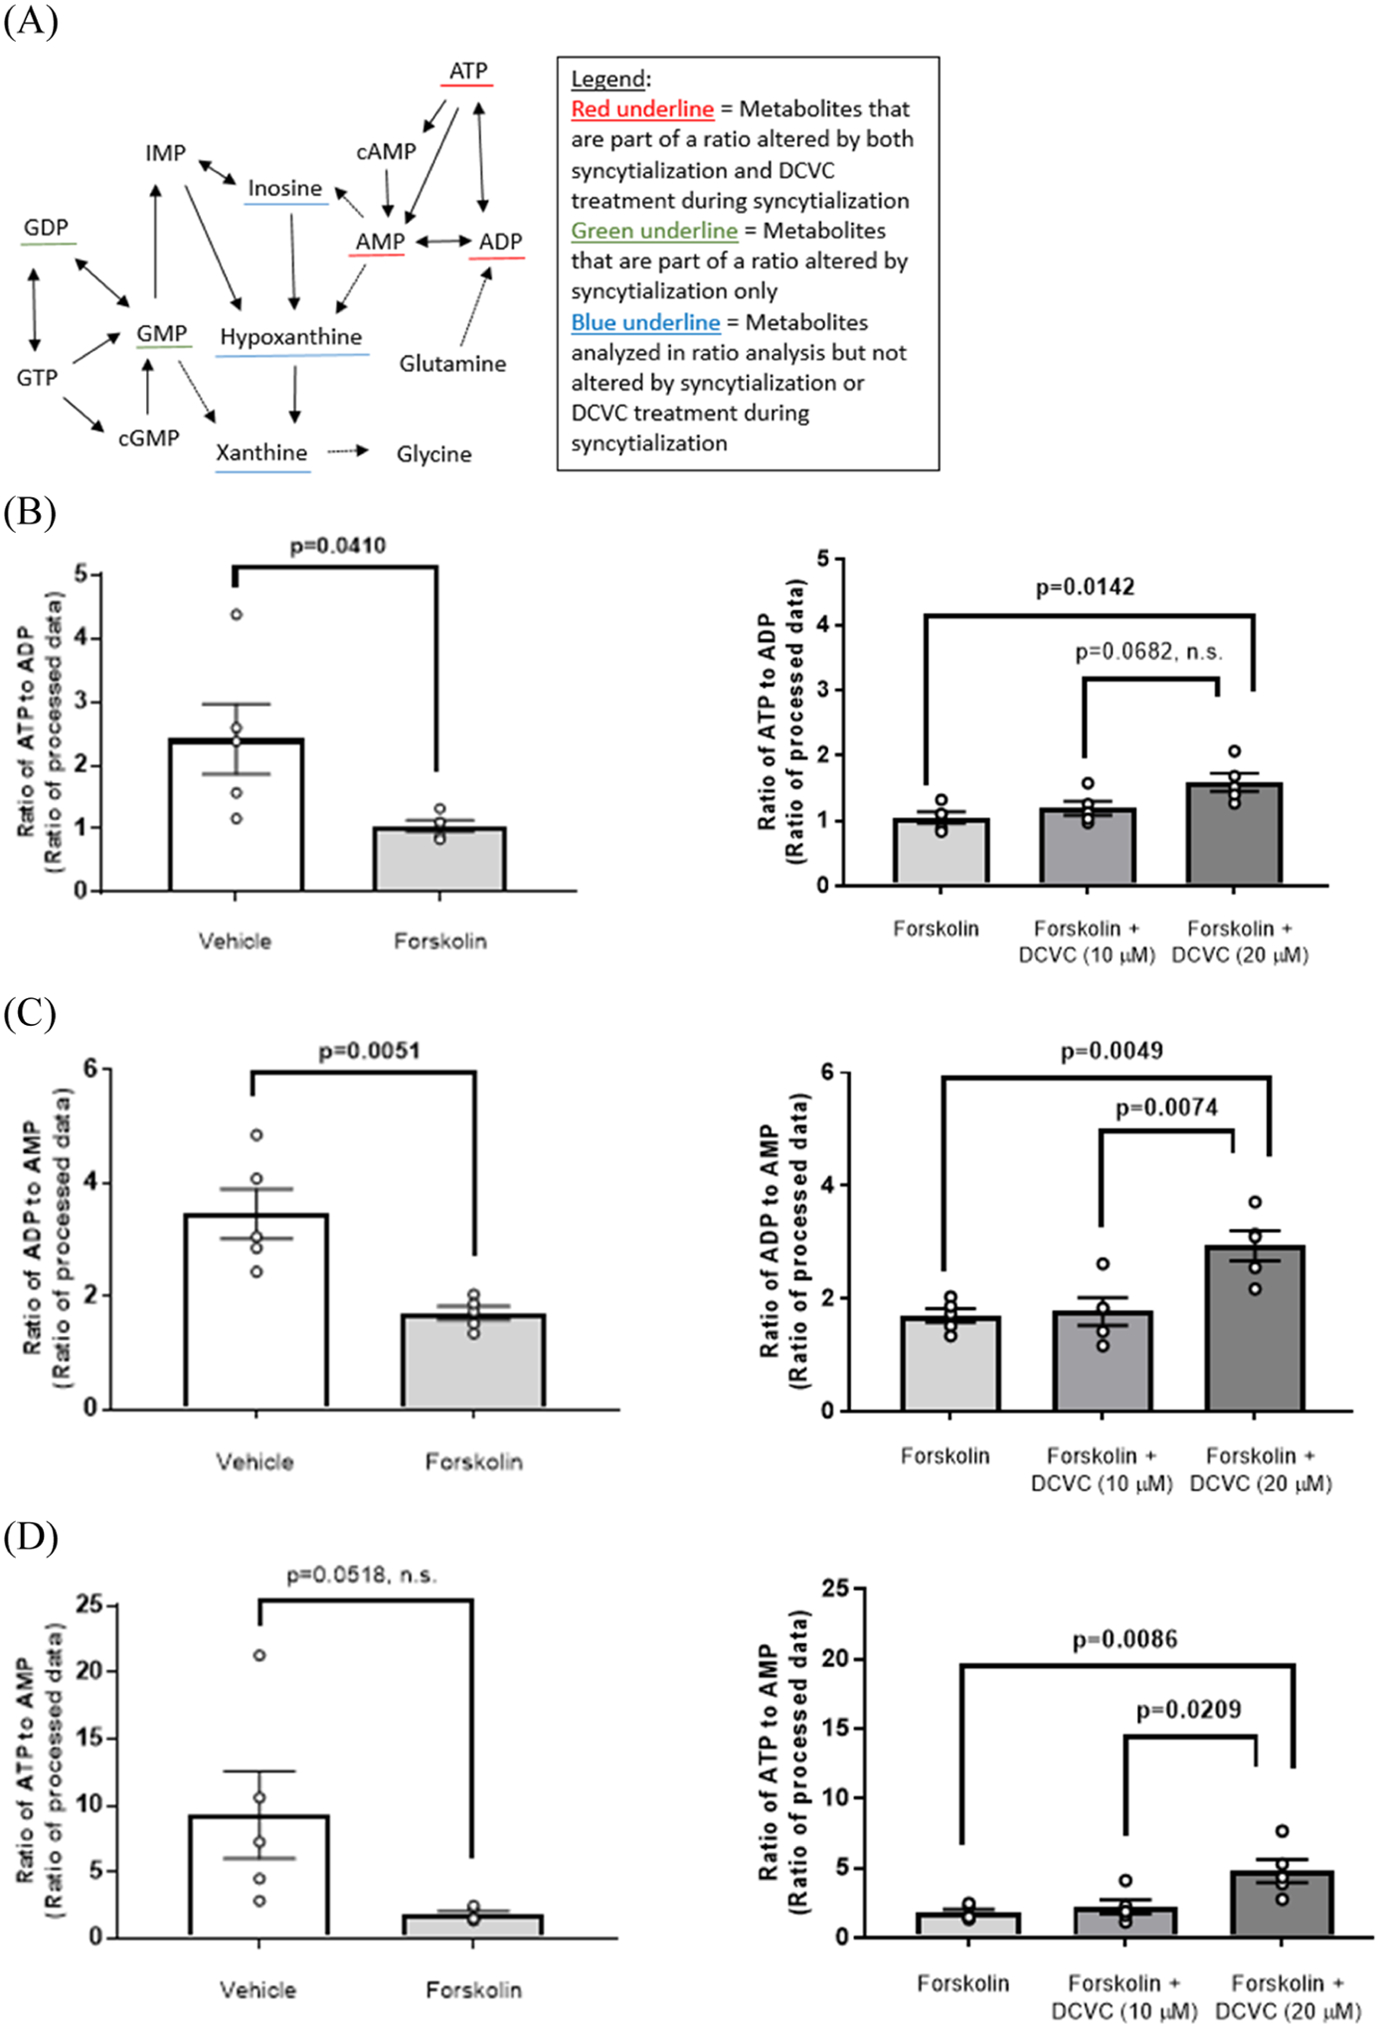
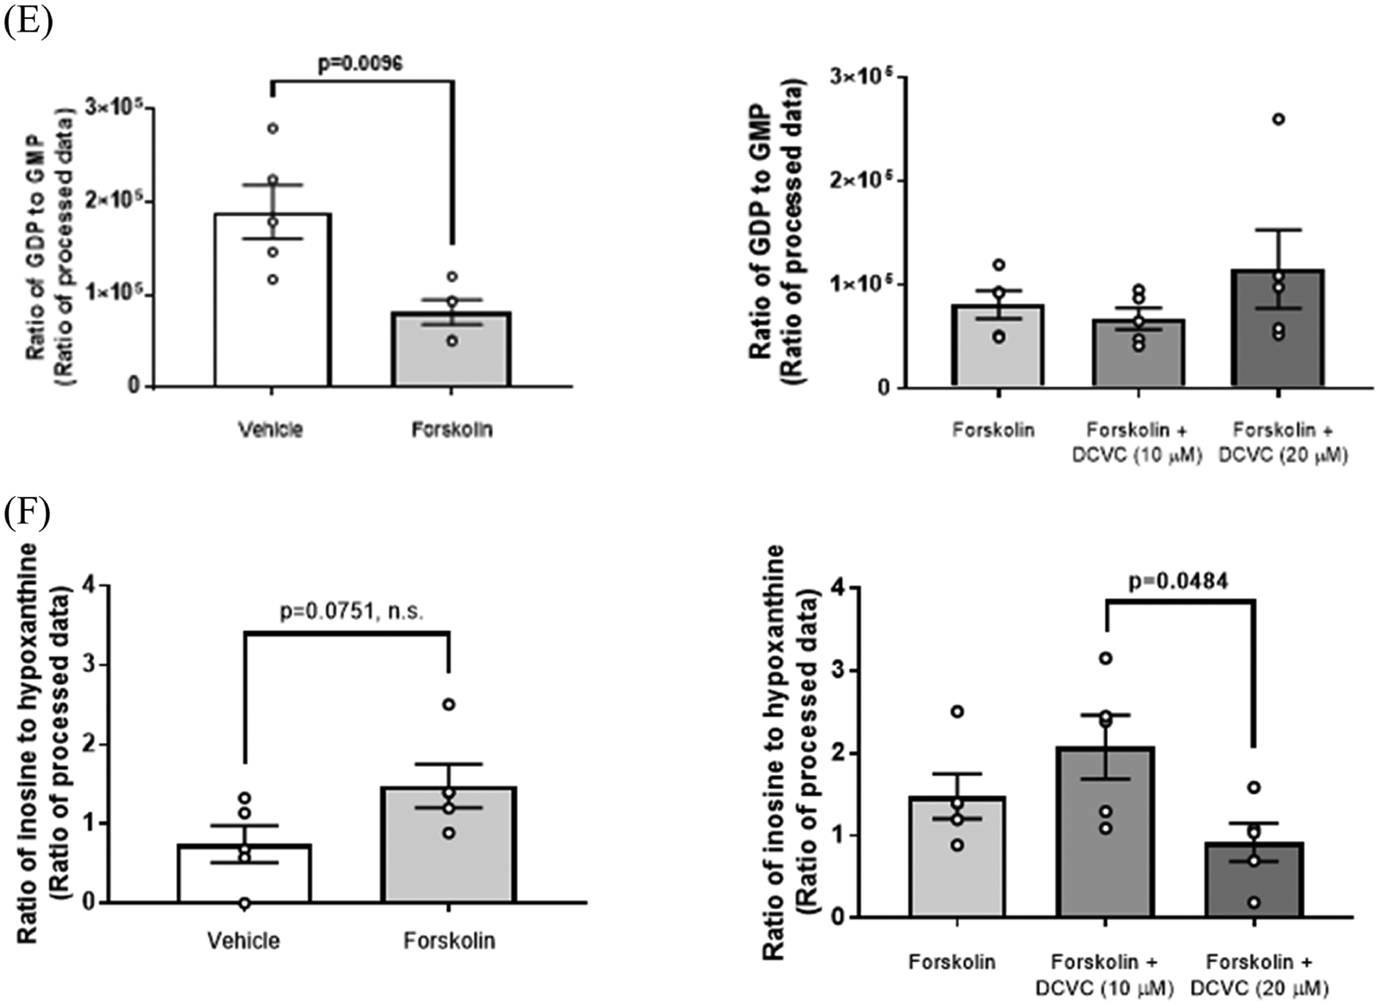
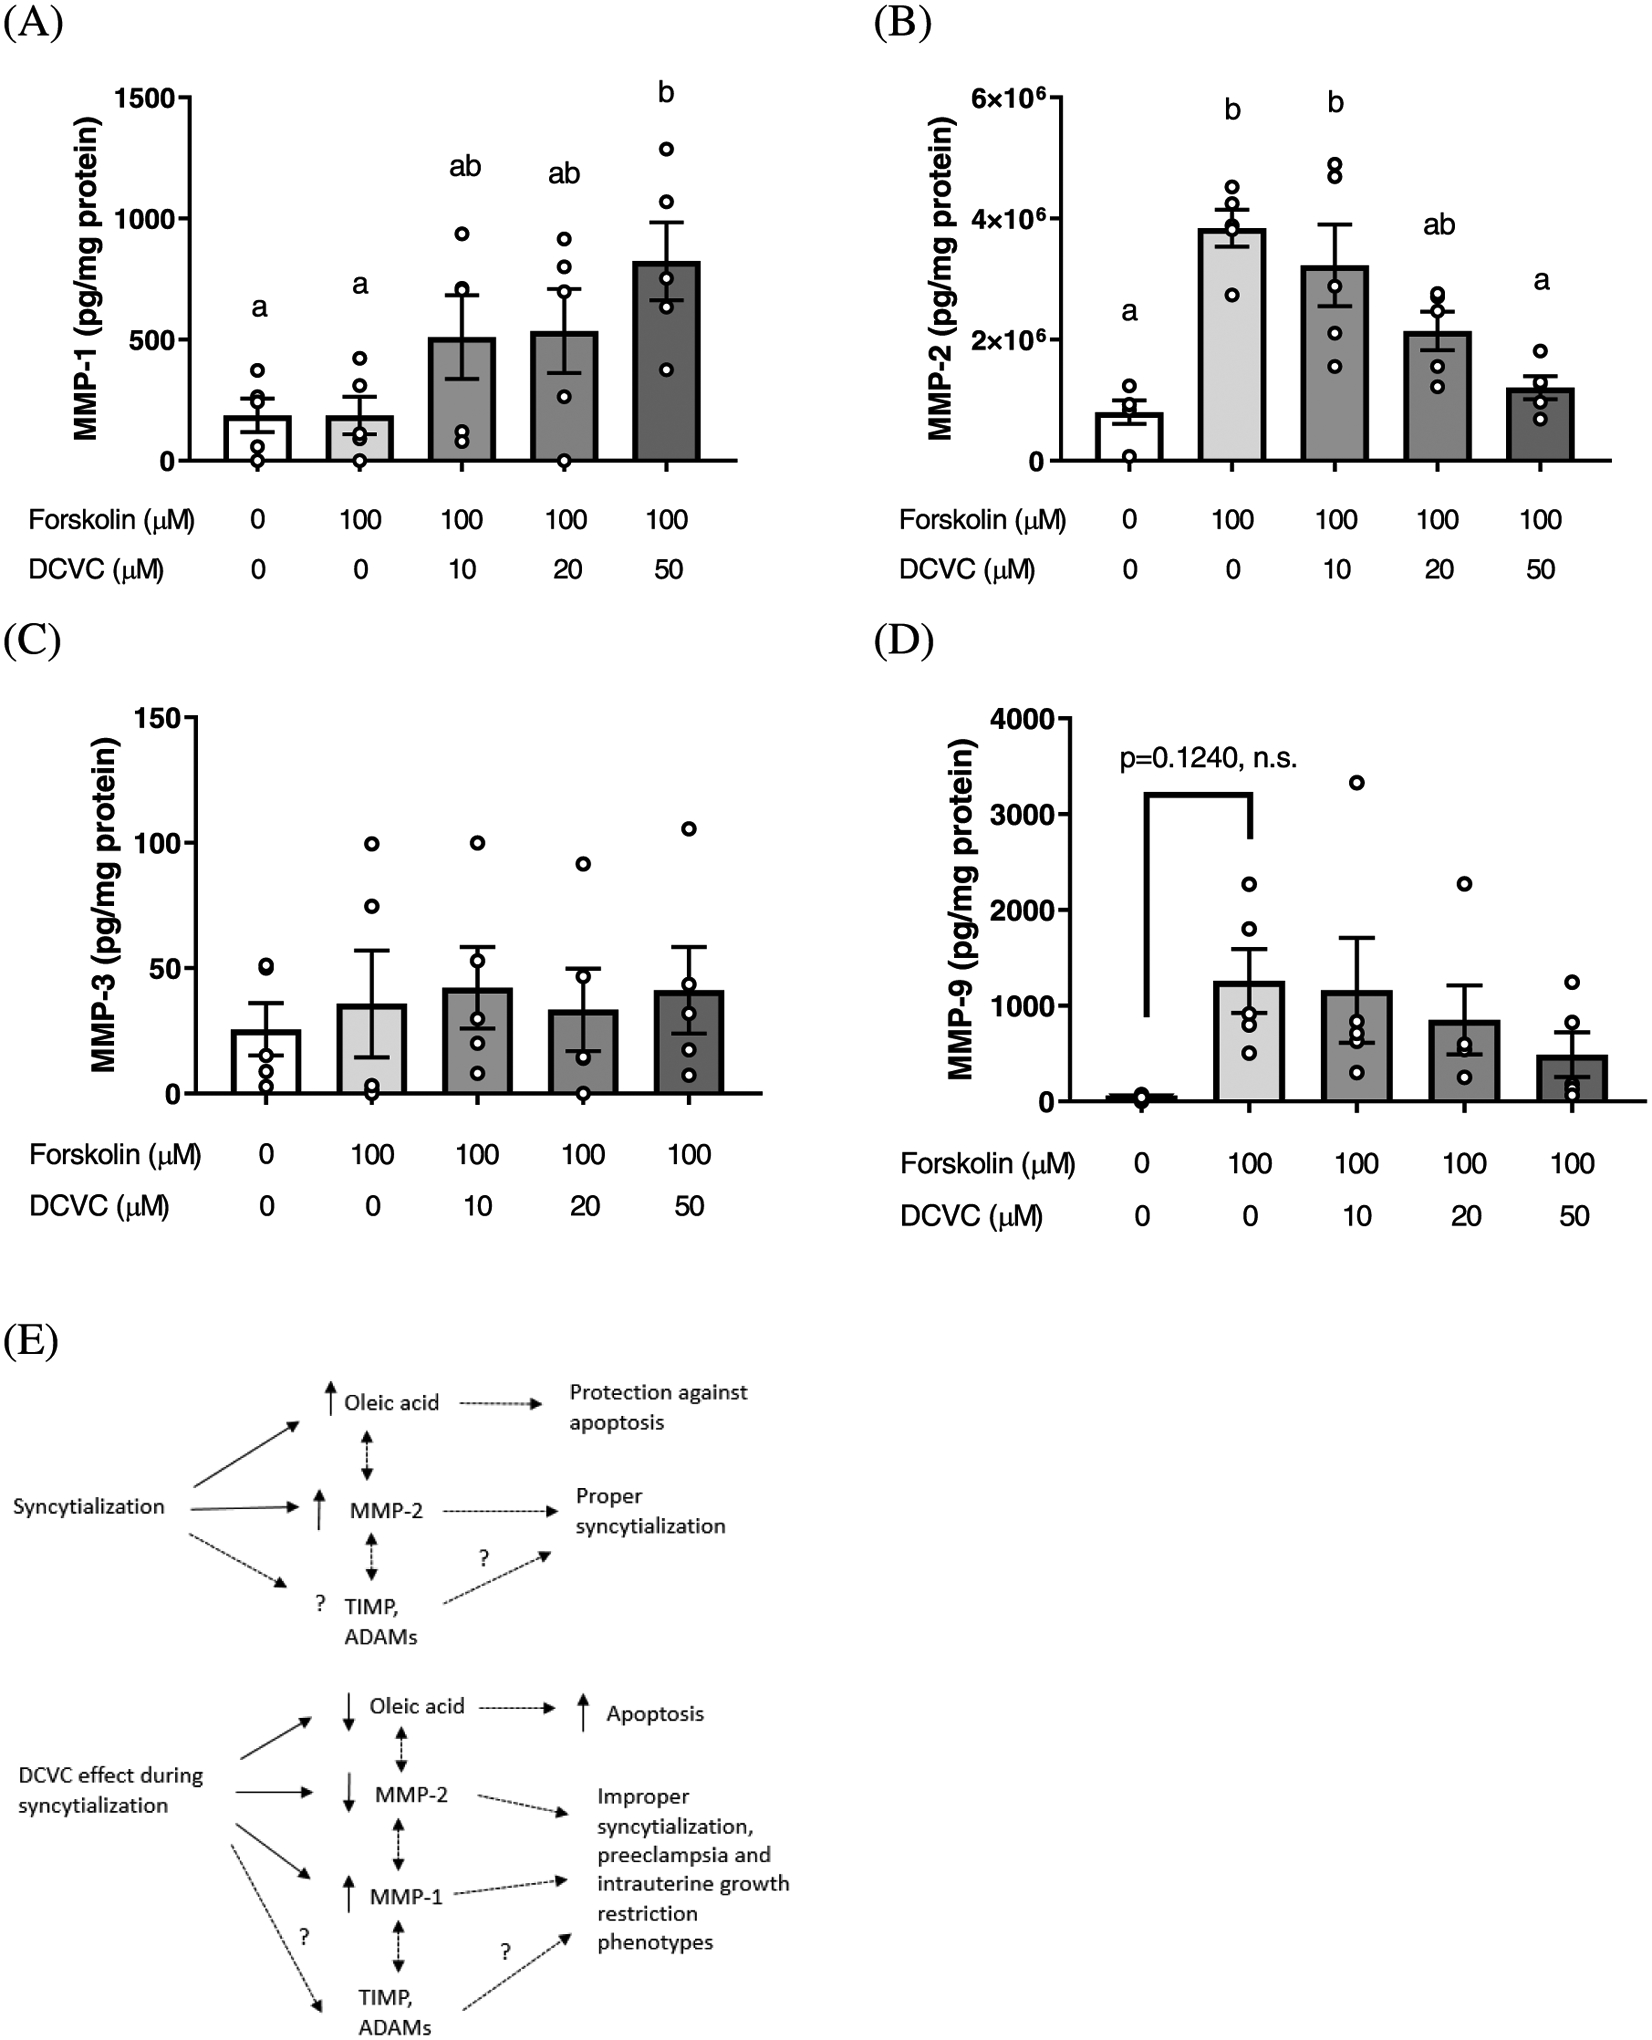
Syncytialization, the fusion of cytotrophoblasts into an epithelial barrier that constitutes the maternal-fetal interface, is a crucial event of placentation. This process is characterized by distinct changes to amino acid and energy metabolism. A metabolite of the industrial solvent trichloroethylene (TCE), S-(1,2-dichlorovinyl)-l-cysteine (DCVC), modifies energy metabolism and amino acid abundance in HTR-8/SVneo extravillous trophoblasts. In the current study, we investigated DCVC-induced changes to energy metabolism and amino acids during forskolin-stimulated syncytialization in BeWo cells, a human villous trophoblastic cell line that models syncytialization in vitro. BeWo cells were exposed to forskolin at 100 μM for 48 h to stimulate syncytialization. During syncytialization, BeWo cells were also treated with DCVC at 0 (control), 10, or 20 μM. Following treatment, the targeted metabolomics platform, "Tricarboxylic Acid Plus", was used to identify changes in energy metabolism and amino acids. DCVC treatment during syncytialization decreased oleic acid, aspartate, proline, uridine diphosphate (UDP), UDP-d-glucose, uridine monophosphate, and cytidine monophosphate relative to forskolin-only treatment controls, but did not increase any measured metabolite. Notable changes stimulated by syncytialization in the absence of DCVC included increased adenosine monophosphate and guanosine monophosphate, as well as decreased aspartate and glutamate. Pathway analysis revealed multiple pathways in amino acid and sugar metabolisms that were altered with forskolin-stimulated syncytialization alone and DCVC treatment during syncytialization. Analysis of ratios of metabolites within the pathways revealed that DCVC exposure during syncytialization changed metabolite ratios in the same or different direction compared to syncytialization alone. Building off our oleic acid findings, we found that extracellular matrix metalloproteinase-2, which is downstream in oleic acid signaling, underwent the same changes as oleic acid. Together, the metabolic changes stimulated by DCVC treatment during syncytialization suggest changes in energy metabolism and amino acid abundance as potential mechanisms by which DCVC could impact syncytialization and pregnancy.


Conflict of interest statement

The authors declare no competing financial interest.

Figures

Figure 1.
Figure 1.
Summary and purposes of treatment groups used in the metabolomics study design. Comparison of the first two treatment groups, groups 1 and 2, test the effect of syncytialization on metabolomics outcomes. Comparison of groups 2, 3, and 4 investigate the effect of DCVC treatment on forskolin-stimulated syncytialization. Group 1 is the vehicle control group exposed to 0.1% (v/v) dimethyl sulfoxide (DMSO).
Figure 2.
Figure 2.
Volcano plots displaying the negative [log10(p-value)] as a function of the log2(fold-change) for each individual metabolite displayed as dots for four different comparisons. Graphs show four different comparisons, corresponding to the effect of: (A) syncytialization, comparing forskolin-only treatment to vehicle control; (B) 10 μM DCVC during syncytialization, comparing 10 μM DCVC treatment during syncytialization to forskolin-only treatment; (C) 20 μM DCVC during syncytialization, comparing 20 μM DCVC treatment during syncytialization to forskolin-only treatment, and (D) DCVC concentration–response, comparing 20 μM DCVC during syncytialization versus 10 μM DCVC during syncytialization. Individual points correspond to individual metabolites detected. The horizontal dashed gold lines correspond to the threshold of p = 0.05. Axes ranges differ among the graphs to clearly show metabolites. Results from this figure are based on the analyses in Table S2. Abbreviations: AMP, adenosine monophosphate; Asp, aspartate; ATP, adenosine triphosphate; CMP, cytidine monophosphate; Glu, glutamate; GMP, guanosine monophosphate; GSSG, glutathione disulfide; Pro, proline; Suc, succinate; UDP, uracil diphosphate; and UMP, uracil monophosphate.
Figure 3.
Figure 3.
Summary of specific metabolites altered by syncytialization or DCVC treatment during syncytialization. Metabolites highlighted in blue or red indicate metabolites increased or decreased, respectively, in response to forskolin-stimulated syncytialization and/or DCVC treatment during syncytialization. The metabolites in the smallest, moderate, and largest text sizes were significantly different at p < 0.05, p < 0.01, and p < 0.001, respectively. In the case of the DCVC effect during syncytialization, a metabolite was listed if it changed with at least 20 μM DCVC treatment, with the exception of inosine (marked with an asterisk), which was decreased in the 20 μM DCVC group compared to the 10 μM DCVC group. Results from this figure are based on the analyses in Table S2.
Figure 4.
Figure 4.
Scatterplots showing associations between metabolite fold changes across different comparisons to visualize changes associated with syncytialization versus changes associated with DCVC treatment during syncytialization. Comparisons displayed correspond to (A) the 20 μM DCVC treatment during syncytialization versus 10 μM DCVC treatment during syncytialization comparison, (B) the 10 μM DCVC treatment during syncytialization versus syncytialization alone comparison, and (C) the 20 μM DCVC treatment during syncytialization versus syncytialization alone comparison. X and Y axes are in units of log2(fold-change), and individual data points represent individual metabolites detected in the cells. Results from this figure are based on the analyses in Table S2. Abbreviations: AMP, adenosine monophosphate; ATP, adenosine triphosphate; CMP, cytidine monophosphate; E4P, erythrose 4-phosphate; FAD, flavin adenine dinucleotide; GMP, guanosine monophosphate; GSSG, glutathione disulfide; R5P/X5P, ribose 5-phosphate/xylulose 5-phosphate; UDP, uracil diphosphate; and UMP, uracil monophosphate.
Figure 5.
Figure 5.
Pathway analysis performed by Metaboanalyst 4.0 to reveal changes in KEGG pathways altered by forskolin-stimulated syncytialization or DCVC treatment during syncytialization. Individual figures represent the effect of (A) syncytialization, comparing forskolin-only treatment to vehicle control; (B) 10 μM DCVC during syncytialization, comparing 10 μM DCVC treatment during syncytialization to forskolin-only treatment; (C) 20 μM DCVC during syncytialization, comparing 20 μM DCVC treatment during syncytialization to forskolin-only treatment, and (D) DCVC concentration–response, comparing 20 μM DCVC during syncytialization versus 10 μM DCVC during syncytialization. Pathway analysis (specific for H. sapiens) was performed by Metaboanalyst 4.0 on the data (generalized log-transformed). Individual circles represent different KEGG pathways. The circle color corresponds to the significance of the pathway (white to red in order of increasing significance), whereas the circle size corresponds to pathway impact, which is calculated as the matched metabolites as a cumulative percentage contributing to total pathway importance. A horizontal yellow dashed line indicates negative (log(p)) = 3, which corresponds to a p = 0.05 under the loge (or ln) scale used in this analysis. Axes ranges differ among the graphs to clearly label pathways.
Figure 6.
Figure 6.
Purine metabolism as modified by syncytialization and DCVC treatment during syncytialization. (A) Simplified depiction of the purine metabolism KEGG pathway in H. sapiens. Specific metabolite ratios changed by syncytialization or DCVC treatment during syncytialization are shown for (B) the ATP to ADP ratio; (C) the ADP to AMP ratio; (D) the ATP to AMP ratio; (E) the GDP to GMP ratio; and (F) the inosine to hypoxanthine ratio. The inosine to hypoxanthine ratio was indicated as nonsignificant in (A) because of the lack of statistical significance compared to the control (forskolin-only treatment). In the graphs, error bars represent the mean ± standard error of the mean (SEM). N = 5 independent experiments. Abbreviations: ATP, adenosine triphosphate; ADP, adenosine diphosphate; AMP, adenosine monophosphate; cAMP, cyclic AMP; GTP, guanosine triphosphate; GDP, guanosine diphosphate; GMP, guanosine monophosphate; cGMP, cyclic GMP; and IMP, inosine monophosphate.
Figure 6.
Figure 6.
Purine metabolism as modified by syncytialization and DCVC treatment during syncytialization. (A) Simplified depiction of the purine metabolism KEGG pathway in H. sapiens. Specific metabolite ratios changed by syncytialization or DCVC treatment during syncytialization are shown for (B) the ATP to ADP ratio; (C) the ADP to AMP ratio; (D) the ATP to AMP ratio; (E) the GDP to GMP ratio; and (F) the inosine to hypoxanthine ratio. The inosine to hypoxanthine ratio was indicated as nonsignificant in (A) because of the lack of statistical significance compared to the control (forskolin-only treatment). In the graphs, error bars represent the mean ± standard error of the mean (SEM). N = 5 independent experiments. Abbreviations: ATP, adenosine triphosphate; ADP, adenosine diphosphate; AMP, adenosine monophosphate; cAMP, cyclic AMP; GTP, guanosine triphosphate; GDP, guanosine diphosphate; GMP, guanosine monophosphate; cGMP, cyclic GMP; and IMP, inosine monophosphate.
Figure 7.
Figure 7.
Effect of syncytialization and DCVC treatment during syncytialization on matrix metalloproteinase (MMP) concentrations in BeWo cell media. Effect on (A) MMP-1, (B) MMP-2, (C) MMP-3, and (D) MMP-9. Statistical significance is denoted by non-overlapping letters (p ≤ 0.0351). Error bars represent the mean ± SEM. N = 5 independent experiments. (E) Proposed mechanism by which DCVC co-treatment may act to stimulate adverse pregnancy outcomes involving oleic acid and MMPs. Solid lines indicate relationships confirmed by the current study to date. Dotted lines indicate relationships inferred by the previous literature. Dotted lines with a question mark above indicate relationships untested previously. A high likelihood exists that the relationships are also mediated by tissue inhibitors of metalloproteinases (TIMPs) and a disintegrin and metalloproteinases (ADAMs).
Figure 8.
Figure 8.
Effect of syncytialization or DCVC treatment during syncytialization on a simplified depiction portraying relationships among KEGG metabolism pathways. Boxed names are individual KEGG pathways, and unboxed names are critical metabolites that connect the pathways. Metabolite concentrations or relative responses and Metaboanalyst 4.0 pathway analysis results were used in determining metabolite and pathway significance, respectively. Dashed arrows indicate multistep processes. Abbreviations: aCoA, acetyl coenzyme A; OAA, oxaloacetate; d-G1P, α-d-glucose 1-phosphate; UDP-Glu, uridine diphosphate-glucose; R5P, d-ribulose 5-phosphate; PRPP, phosphoribosyl pyrophosphate; FUM, fumarate; CP, carbamoyl phosphate, Gly-3P, glycerate 3-phosphate; Gly-2P, glycerate 2-phosphate; d-Glyal-3P, d-glyceraldehyde 3-phosphate; d-G6P, α-d-glucose 6-phosphate; 5-PRA, 5-phosphoribosylamine; Fru-6P, fructose 6-phosphate; and GTP, guanosine triphosphate.

Similar articles

References

    1. Wang R; Dang Y-L; Zheng R; Li Y; Li W; Lu X; Wang L-J; Zhu C; Lin H-Y; Wang H Live Cell Imaging of In Vitro Human Trophoblast Syncytialization1. Biol. Reprod 2014, 90, No. 117. - PubMed
    1. Pötgens A; Schmitz U; Bose P; Versmold A; Kaufmann P; Frank H-G Mechanisms of Syncytial Fusion: A Review. Placenta 2002, 23, S107–S113. - PubMed
    1. Wice B; Menton D; Geuze H; Schwartz AL Modulators of Cyclic AMP Metabolism Induce Syncytiotrophoblast Formation in Vitro. Exp. Cell Res 1990, 186, 306–16. - PubMed
    1. Robbins JR; Skrzypczynska KM; Zeldovich VB; Kapidzic M; Bakardjiev AI Placental Syncytiotrophoblast Constitutes a Major Barrier to Vertical Transmission of Listeria Monocytogenes. PLoS Pathog 2010, 6, No. e1000732. - PMC - PubMed
    1. Cantle SJ; Kaufmann P; Luckhardt M; Schweikhart G Interpretation of Syncytial Sprouts and Bridges in the Human Placenta. Placenta 1987, 8, 2212–34. - PubMed

Publication types