. 2023 Jul;10(20):e2206393.
doi: 10.1002/advs.202206393. Epub 2023 May 8.

CD44 and HAP-Conjugated hADSCs as Living Materials for Targeted Tumor Therapy and Bone Regeneration

Affiliations

CD44 and HAP-Conjugated hADSCs as Living Materials for Targeted Tumor Therapy and Bone Regeneration

He Xia et al. Adv Sci (Weinh). 2023 Jul.

Abstract

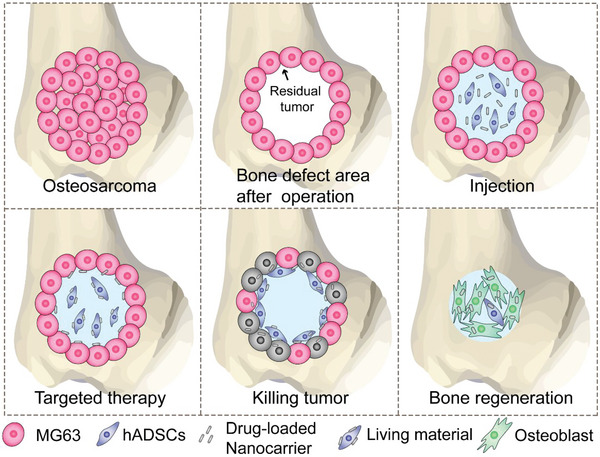
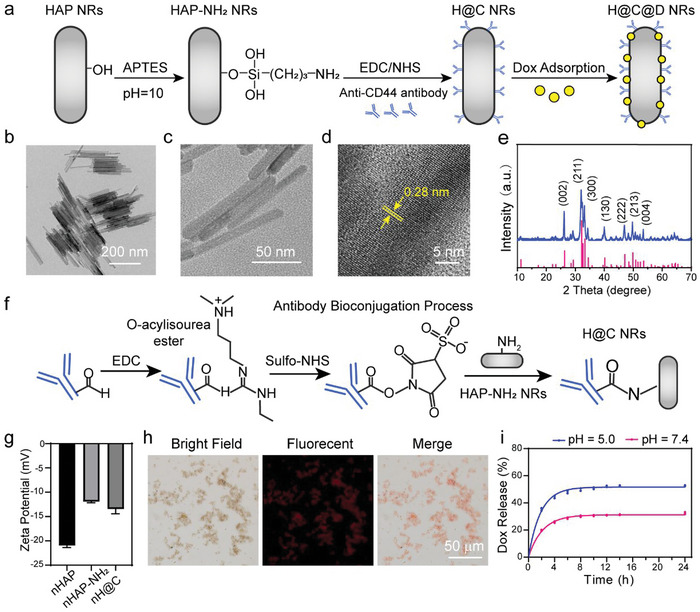
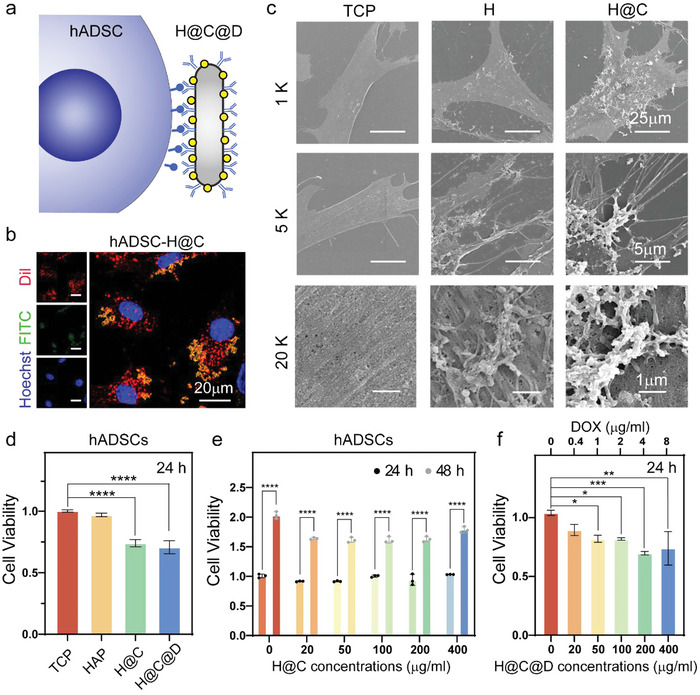
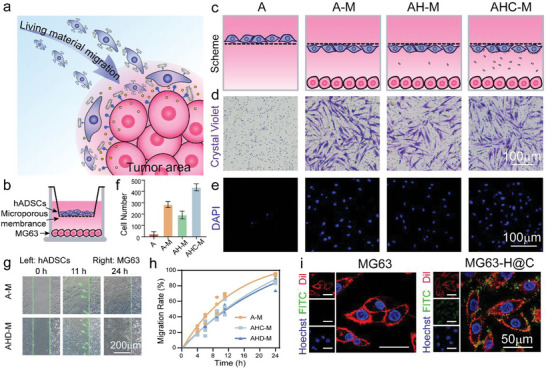
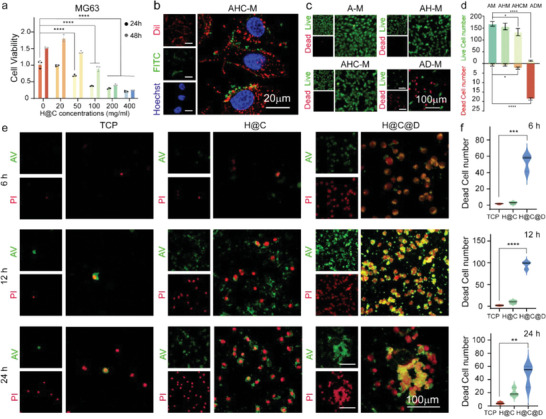
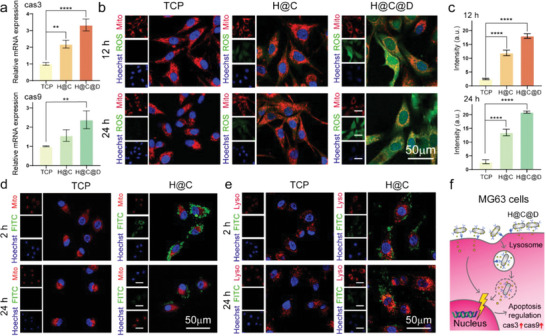
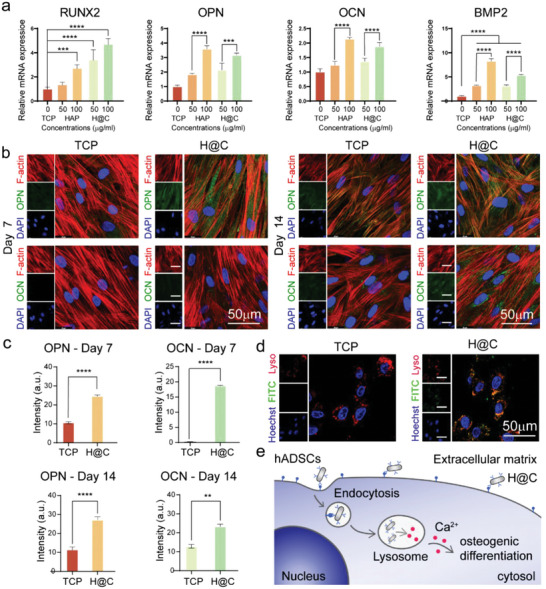
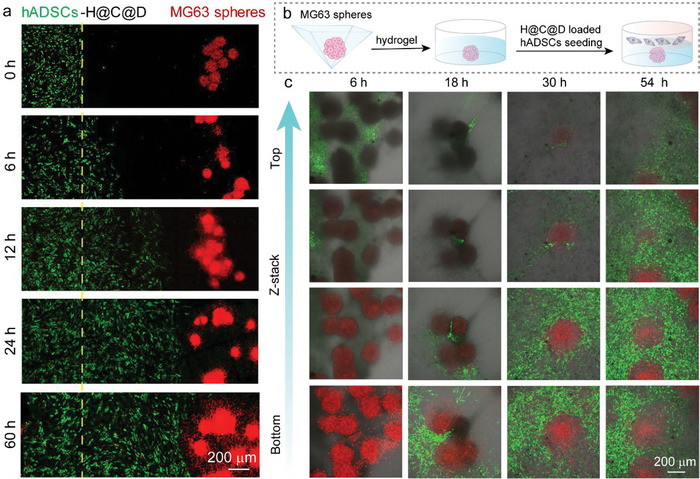
Combining targeted tumor therapy with tissue regeneration represents a promising strategy for synergistic tumor therapy. In this study, a multifunctional living material is constructed with human-derived adipose stem cells (hADSCs) and antibody-modified hydroxyapatite nanorods (nHAP) for targeted drug delivery and bone regeneration following surgery. The living material delivers the therapeutics to the tumor site efficiently based on the strength of the inherent tumor tropism of hADSCs. The bioconjugation of nHAP with hADSCs via specific antibody modification is found to be biocompatible, even when loaded with the chemotherapeutic drug doxorubicin (Dox). The endocytosis of nHAP stimulates the osteogenic differentiation of hADSCs, promoting bone tissue regeneration. Moreover, the antibody-modified nHAP-hADSC conjugate exhibits targeted tumor delivery, which is further facilitated by pH-triggered release of Dox, inducing apoptosis of tumor cells with low toxicity to healthy tissues. Therefore, the present study provides a general strategy for engineering living materials to achieve targeted tumor therapy and bone tissue regeneration after surgery, which can be extended to other disease types.

Keywords: bone tissue regeneration; living material; stem cells; targeted tumor therapy.


Conflict of interest statement

The authors declare no conflict of interest.

Figures

Scheme 1
Scheme 1
Design of the living material for the proposed targeted residual tumor elimination and bone regeneration after surgery.
Figure 1
Figure 1
Characteristics of Dox‐loaded Anti‐CD44 antibody‐modified nHAP. a) Scheme of the preparation process of Dox‐loaded Anti‐CD44 antibody‐modified nHAP. b,c) Transmission electron microscopy (TEM) images of nHAP. d) High‐resolution transmission electron microscopy (HRTEM) images of nHAP. e) XRD pattern of nHAP. f) Scheme of the bioconjugation process between the antibody and nHAP‐NH2. g) Zeta potentials of nHAP, nHAP–NH2, and nHAP@Anti‐CD44 antibody (n = 3). h) Images of rhodamine B‐labeled H@C captured by an inverted fluorescence microscope. i) Dox release from H@C@D in pH 7.4 and pH 5.0 solutions.
Figure 2
Figure 2
Construction and biocompatibility of the living material. a) Scheme of the living materials constructed with hADSCs and H@C@D. b) Bioconjugation of 100 µg mL−1 H@C on the hADSC membrane after 30 min. Red, green and blue channels show Dil‐stained cell membranes, FITC‐labeled H@C, and Hoechst‐stained nuclei, respectively. c) SEM images of hADSCs cultured with 100 µg mL−1 nHAP and H@C for 2 h. d) CCK‐8 assay of hADSCs cultured with 100 µg mL−1 nHAP, H@C, and H@C@D for 24 h. Data are presented as the mean ± SD. The p values were calculated using one‐way ANOVA with Bonferroni's comparison test (n = 3; *p < 0.05, **p < 0.01, ***p < 0.001, and ****p < 0.0001). e) CCK‐8 assay of hADSCs cultured with different concentrations of H@C for 24 and 48 h. Data are presented as the mean ± SD. The p values were calculated using two‐way ANOVA with Bonferroni's comparison test (n = 3; *p < 0.05, **p < 0.01, ***p < 0.001, and ****p < 0.0001). f) CCK‐8 assay of hADSCs cultured with different concentrations of H@C@D for 24 h. Data are presented as the mean ± SD. The p values were calculated using one‐way ANOVA with Bonferroni's comparison test (n = 3; *p < 0.05, **p < 0.01, ***p < 0.001, and ****p < 0.0001).
Figure 3
Figure 3
Tumor‐tropic migration of the living materials and targeted ability of H@C. a) Scheme of the migration process of the living materials. b) Scheme of Transwell construction. c) Magnification profile of both sides of the microporous membrane of the Transwell. d,e) Crystal violet staining and DAPI staining of hADSCs on the underside of the microporous membrane after 12 h of incubation. f) Statistical analysis of the number of migrated hADSCs based on DAPI staining in the 3D Transwell experiment. g) Optical images of the migration state of hADSCs and hADSCs conjugated with 100 µg mL−1 H@C@D for 0, 11, and 24 h. h) Migration rate of hADSCs conjugated with 100 µg mL−1 H@C and H@C@D in the 2D scratch model. i) Attachment of 100 µg mL−1 H@C on the MG63 cell membrane after 2 h. Red, green, and blue indicate Dil‐stained cell membrane, FITC‐labeled H@C, and Hoechst‐stained nuclei.
Figure 4
Figure 4
The synergistic antitumor ability of the antibody‐modified nHAP and Dox as indicated by MG63 cell apoptosis. a) CCK‐8 assay of MG63 cells cultured with different concentrations of H@C for 24 and 48 h. Data are presented as the mean ± SD. The p values were calculated using two‐way ANOVA with Bonferroni's comparison test (n = 3; *p < 0.05, **p < 0.01, ***p < 0.001, and ****p < 0.0001). b) Colocalization of H@C and MG63 cell membrane after 24 h. H@C detached from the living material. Red, green, and blue indicate the Dil‐stained cell membrane, FITC‐labeled H@C, and Hoechst‐stained nuclei. c) Live/dead staining of MG63 cells after co‐culture with the living materials for 12 h in a Transwell system. The concentration of nanorods contained in the living materials was 100 µg mL−1. d) Live and dead cell numbers were determined by live/dead staining of MG63 cells after co‐culture with the living materials for 12 h in a Transwell system and analysis by ImageJ. The p values were calculated using one‐way ANOVA with Bonferroni's comparison test (n = 3; *p < 0.05, **p < 0.01, ***p < 0.001, and ****p < 0.0001). e) AV/PI staining of MG63 cells after culture with 100 µg mL−1 H@C and H@C@D for 6, 12, and 24 h. Apoptotic cells were stained green with AV‐Fluor 488, and dead cells were stained red with PI. f) Dead cell numbers as determined by AV/PI staining of MG63 cells and analyzed by ImageJ. The p values were calculated using one‐way ANOVA with Bonferroni's comparison test (n = 3; *p < 0.05, **p < 0.01, ***p < 0.001, and ****p < 0.0001).
Figure 5
Figure 5
The antitumor effect and process of the proposed living materials in vitro. a) qRT–PCR analysis of apoptosis‐related genes in MG63 cells. Data are presented as the mean ± SD. The p values were calculated using one‐way ANOVA with Bonferroni's comparison test (n = 3; *p < 0.05, **p < 0.01, ***p < 0.001, and ****p < 0.0001). b,c) Mito/ROS staining of MG63 cells and the statistical analysis of the mean ROS fluorescence intensity in the cells. The red, green, and blue colors represent the mitochondria, ROS, and Hoechst‐stained nuclei, respectively. Data are presented as the mean ± SD. The p values were calculated using one‐way ANOVA with Bonferroni's comparison test (n = 3; *p < 0.05, **p < 0.01, ***p < 0.001, and ****p < 0.0001). d) Colocalization of FITC‐labeled H@C nanorods and mitochondria in MG63 cells after 2 and 24 h of culture. The red, green, and blue colors represent mitochondria, FITC‐labeled H@C nanorods, and Hoechst‐stained nuclei, respectively. e) Colocalization of FITC‐labeled H@C nanorods and lysosomes in MG63 cells after 2 and 24 h of culture. The red, green, and blue colors represent lysosomes, FITC‐labeled H@C nanorods, and Hoechst‐stained nuclei, respectively. f) Scheme of the mechanism by which H@C@D nanorods regulate the apoptosis of MG63 cells.
Figure 6
Figure 6
Osteogenic differentiation of hADSCs treated with H@C nanorods. a) qRT–PCR analysis of osteogenesis‐related gene expression after culture with various concentrations of HAP nanorods and H@C nanorods for 7 days. The p values were calculated using one‐way ANOVA with Bonferroni's comparison test (n = 3; *p < 0.05, **p < 0.01, ***p < 0.001, and ****p < 0.0001). b) Immunofluorescence staining of osteogenic markers after culture with 100 µg mL−1 H@C nanorods for 7 and 14 days. c) Mean fluorescence intensity after culture of MG63 cells with 100 µg mL−1 H@C nanorods for 7 and 14 days. The p values were calculated using one‐way ANOVA with Bonferroni's comparison test (n = 3; *p < 0.05, **p < 0.01, ***p < 0.001, and ****p < 0.0001). d) Colocalization of FITC‐labeled H@C nanorods and lysosomes in hADSCs after culture for 24 h. The red, green, and blue colors indicate LysoTracker‐stained lysosomes, FITC‐labeled H@C (concentration = 100 µg mL−1), and Hoechst‐stained nuclei, respectively. e) Scheme of the mechanism by which H@C nanorods regulate the fate of hADSCs.
Figure 7
Figure 7
In vitro validation of the migration ability of the living materials in the MG63 tumor spheroid model. a) Left to right 3D migration assay based on the Transwell assay. H@C@D‐loaded hADSCs were labeled with pkh67 (green), and MG63 spheroids were labeled with pkh26 (red). b) Scheme of the top to bottom 3D migration model. c) Top to bottom 3D migration assay. assay. H@C@D‐loaded hADSCs were labeled with pkh67 (green), and MG63 spheroids were labeled with pkh26 (red).
Figure 8
Figure 8
In vitro validation of the antitumor effect of the living materials in a 3D model. Tumor spheroids were labeled with PKH26 (red), and the nuclei of hADSCs and tumor spheroids were stained blue with Hoechst. ROS were stained green. The different layers of MG63 spheroids were observed by CLSM.
Figure 9
Figure 9
In vivo validation of the bone regeneration and antitumor effect of the living materials in nude mouse. a) The scheme of animal experiment. The nude mouse was injected with Matrigel contained with tumor cells (Group 1), tumor cells and hADSCs (Group 2), tumor cells and H@C@D nanorods (Group 3), and tumor cells and the living materials (Group 4). b) H&E staining images of calvarial bone defect sections at day 14. The defect area is marked with a yellow dotted line. c) Masson‐trichrome staining images of calvarial bone defect sections at day 14. The defect area is marked with a yellow dotted line. d) Immunostaining of tissue slices for the osteogenic markers and fluorescent images of PKH26‐labeled tumor cells after 21 days. Cell nuclei were stained with DAPI (blue), OCN and OPN are shown in green, while tumor cells are in green.

Similar articles

Cited by

References

    1. Gill J., Gorlick R., Nat. Rev. Clin. Oncol. 2021, 18, 609. - PubMed
    1. Gianferante D. M., Mirabello L., Savage S. A., Nat. Rev. Endocrinol. 2017, 13, 480. - PubMed
    1. Long J., Zhang W., Chen Y., Teng B., Liu B., Li H., Yao Z., Wang D., Li L., Yu X. F., Qin L., Lai Y., Biomaterials 2021, 275, 120950. - PubMed
    1. Kansara M., Teng M. W., Smyth M. J., Thomas D. M., Nat. Rev. Cancer 2014, 14, 722. - PubMed
    1. Manzari M. T., Shamay Y., Kiguchi H., Rosen N., Scaltriti M., Heller D. A., Nat. Rev. Mater. 2021, 6, 351. - PMC - PubMed

Publication types

LinkOut - more resources