. 2023 Apr 18:14:1071553.
doi: 10.3389/fimmu.2023.1071553. eCollection 2023.

Alpha4 beta7 integrin controls Th17 cell trafficking in the spinal cord leptomeninges during experimental autoimmune encephalomyelitis

Affiliations

Alpha4 beta7 integrin controls Th17 cell trafficking in the spinal cord leptomeninges during experimental autoimmune encephalomyelitis

Barbara Rossi et al. Front Immunol. .

Abstract

Th1 and Th17 cell migration into the central nervous system (CNS) is a fundamental process in the pathogenesis of experimental autoimmune encephalomyelitis (EAE), the animal model of multiple sclerosis (MS). Particularly, leptomeningeal vessels of the subarachnoid space (SAS) constitute a central route for T cell entry into the CNS during EAE. Once migrated into the SAS, T cells show an active motility behavior, which is a prerequisite for cell-cell communication, in situ reactivation and neuroinflammation. However, the molecular mechanisms selectively controlling Th1 and Th17 cell trafficking in the inflamed leptomeninges are not well understood. By using epifluorescence intravital microscopy, we obtained results showing that myelin-specific Th1 and Th17 cells have different intravascular adhesion capacity depending on the disease phase, with Th17 cells being more adhesive at disease peak. Inhibition of αLβ2 integrin selectively blocked Th1 cell adhesion, but had no effect on Th17 rolling and arrest capacity during all disease phases, suggesting that distinct adhesion mechanisms control the migration of key T cell populations involved in EAE induction. Blockade of α4 integrins affected myelin-specific Th1 cell rolling and arrest, but only selectively altered intravascular arrest of Th17 cells. Notably, selective α4β7 integrin blockade inhibited Th17 cell arrest without interfering with intravascular Th1 cell adhesion, suggesting that α4β7 integrin is predominantly involved in Th17 cell migration into the inflamed leptomeninges in EAE mice. Two-photon microscopy experiments showed that blockade of α4 integrin chain or α4β7 integrin selectively inhibited the locomotion of extravasated antigen-specific Th17 cells in the SAS, but had no effect on Th1 cell intratissue dynamics, further pointing to α4β7 integrin as key molecule in Th17 cell trafficking during EAE development. Finally, therapeutic inhibition of α4β7 integrin at disease onset by intrathecal injection of a blocking antibody attenuated clinical severity and reduced neuroinflammation, further demonstrating a crucial role for α4β7 integrin in driving Th17 cell-mediated disease pathogenesis. Altogether, our data suggest that a better knowledge of the molecular mechanisms controlling myelin-specific Th1 and Th17 cell trafficking during EAE delevopment may help to identify new therapeutic strategies for CNS inflammatory and demyelinating diseases.

Keywords: Th1 cells; Th17 cells; alpha4 beta7 integrin; experimental autoimmune encephalomyelitis; intravital microscopy; leptomeninges.


Conflict of interest statement

The authors declare that the research was conducted in the absence of any commercial or financial relationships that could be construed as a potential conflict of interest.

Figures

Figure 1
Figure 1
EIVM experiments show alterations of rheological factors in the spinal cord venules during EAE. C57BL/6 mice were injected with FITC dextran to visualize blood vessels. (A) Representative images of spinal cord pial venules (dorsal spinal vein fed by dorsal ascending venules) in healthy control animals and EAE mice at 9 (preclinical phase), 13-15 (disease peak considered 2 days after the appearance of the first clinical signs) and 22-25 (chronic phase) days post-immunization (dpi) (scale bar = 100 μm). (B) Diameters and (C) wall shear stress of pial vessels were measured in healthy controls and EAE mice at different time points of disease as described in material and methods. (D) Representative images of vascular leakage of FITC dextran at the disease peak. (B, C) Data are represented as mean ± SEM from a minimum of 30 to a maximum of 50 vessels from three independent experiments for each condition. One-way ANOVA followed by Tukey’s multiple comparison test were used for statistical analysis (*P = 0.0276; **P = 0.0055; ***P = 0.0003; ***P < 0.0001).
Figure 2
Figure 2
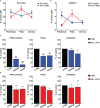
Th1 and Th17 rolling and arrest in spinal cord pial vessels during EAE. (A, B) In vitro differentiated Th1 and Th17 cells were fluorescently labeled and co-injected in immunized mice immediately before EIVM imaging at different time point of EAE. The percentage of rolling (A) and arrest (B) of Th1 and Th17 cells was evaluated as described in material and methods. Differences in terms of percentage of rolling and adhesion between Th1 and Th17 cells at different time points were determined by using Mann-Whitney U test (one tailed). Data are expressed as mean ± SEM from three independent experiments for each time point during EAE. (*P < 0.05; ** P = 0.0026). (C, D) In vitro differentiated Th1 or Th17 cells were fluorescently labeled, divided in two groups (untreated control cells and pretreated with the anti-LFA-1 antibody) and sequentially injected in immunized mice at different time points of EAE. EIVM imaging was performed immediately after every single cell injection at different time points of EAE. (C) Rolling and arrest of Th1 cells treated or not (CTRL) with anti-LFA-1 antibody at the preclinical phase, disease peak (2 days after the appearance of the first clinical signs) and chronic EAE. (D) Rolling and arrest of Th17 cells treated or not (CTRL) with anti-LFA-1 antibody at the preclinical phase, disease peak and chronic phase of EAE. One-way ANOVA followed by Dunnett’s multiple comparison test was applied to compare the frequency of rolling and adhesion events after antibody treatment with of untreated control cells (considered 100%). Data are represented as mean ± SEM from a minimum of 10 to a maximum of 19 venules from three independent experiments for each condition. (*P < 0.05, **P < 0.01; ***P < 0.001).
Figure 3
Figure 3
α4β7 blockade selectively reduces Th17 cells arrest in the spinal cord pial vessels during EAE. In vitro differentiated Th1 or Th17 cells were fluorescently labeled and sequentially injected in immunized mice in two tranches (untreated control cells and pretreated with the blocking antibody), EIVM imaging, conducted immediately after every single cell injection, was performed at the preclinical phase (9dpi), disease peak (13-15 dpi) and chronic phase (22-25 dpi) of EAE. (A) Rolling and arrest of Th1 cells before and after anti-α4 or anti-α4β7 antibodies treatment.(B) Rolling and arrest of Th17 cells before and after anti-α4 or anti-α4β7 treatment. Ordinary one-way ANOVA followed by Dunnett’s multiple comparison test was applied comparing the frequency of rolling and adhesion events after antibody treatment with control (considered 100%). Data are represented as mean ± SEM from a minimum of 12 to a maximum of 24 venules from three independent experiments for each condition. (*P < 0.05, **P < 0.01; ***P < 0.001, ****P < 0.0001).
Figure 4
Figure 4
Endogenous and in vitro polarized Th17 cells express higher levels of α4β7 integrin compared to Th1 cells. (A) CMAC-labelled in vitro polarized Th1 or Th17 cells were intravenously injected into different EAE recipient mice at disease onset and harvested from the spinal cord 48 hours later. α4β7 integrin expression by Th1 (blue) and Th17 (red) cells was evaluated before and after cell transfer and shown as MFI. Data are expressed as mean ± SEM from 3-4 mice for each Th cell subset. Statistical significance was calculated using the Mann–Whitney test (*P < 0.05). Endogenous Th cell subpopulations were identified according to their chemokine receptors expression patterns. Particularly, CXCR3+ CCR4- CCR6- CD4+ T cells were classified as Th1 cells, whereas CXCR3- CCR4+ CCR6+ CD4+ T cells were classified as Th17 cells. (B) The percentages of α4β7 integrin-expressing endogenous circulating and spinal cord-infiltrating Th1 (blue) and Th17 (red) cells were evaluated by flow cytometry after surface staining. Data are expressed as mean ± SEM from 5-8 mice. Statistical significance was calculated using the Mann–Whitney test (**P < 0.01; *** P < 0.001). (C) MFI shows that endogenous spinal cord infiltrating Th17 cells display the highest level of α4β7 integrin. Data are expressed as mean ± SEM from 5-8 mice. Statistical significance was calculated using the Mann–Whitney test (*P < 0.05; ** P < 0.01).
Figure 5
Figure 5
α4 integrins do not affect Th1 cells motility behavior in the spinal SAS at EAE peak. In vitro differentiated Th1 cells were fluorescently labeled and intravenously injected at disease onset. TPLSM imaging was performed after 48 h, when mice reached the disease peak. (A) Representative images of Th1 cells moving in the spinal SAS before (CTRL) and after 30 min of anti-α4 integrin treatment (anti-α4 antibody) (scale bar = 50 µm). (B) Normalized trajectories of 70 Th1 cells over 12 time points before and after anti- α4 antibody. (C) Mean velocity and (D) arrest index of Th1 cells before and after α4 integrins blockade. Statistical significance was calculated using the Mann–Whitney test. (E) Mean displacement of Th1 cells in not affected by anti-α4 blocking antibodies (After linear regression application, the differences between slopes resulted not quite significant; P = 0.0884). All data are expressed as mean ± SEM. A total of 185 cells were analyzed for CTRL and 171 after anti-α4 treatment from two independent experiments. Track lower than 12 time points were excluded from the analysis.
Figure 6
Figure 6
α4 integrins control Th17 cells motility in the spinal SAS at disease peak. In vitro differentiated Th17 cells were fluorescently labeled and intravenously injected at disease onset. TPLSM imaging was performed after 48 h, when mice reached the disease peak. (A) Representative images of Th17 cells before (CTRL) and after 30 min of anti-α4 integrin treatment (anti-α4 antibody) (scale bar = 50 μm). (B) Normalized trajectories of 70 Th17 cells over 12 time points before and after anti-α4 antibody. (C) Mean velocity (**P = 0.0095) and (D) arrest index (*P = 0.0149) of Th17 cells before and after α4 integrin blockade. Statistical significance was calculated using the Mann–Whitney test (*P < 0.05). (E) Mean displacement of Th1 cells is significantly reduced after anti-α4 blocking antibodies (After linear regression application, the differences between slopes resulted statistically significant; **P = 0.0072). All data are expressed as mean ± SEM. A total of 104 cells were analyzed for CTRL and 111 after anti-α4 treatment from two independent experiments. Track lower than 12 time points were excluded from the analysis.
Figure 7
Figure 7
α4β7 integrin selectively controls Th17 cells dynamics in the spinal SAS at disease peak. Cell preparation and TPLSM imaging were perform as described for Figure 5 . (A) Representative images of Th17 cells before (CTRL) and after 30 min of anti-α4β7 integrin treatment (anti-α4β7 antibody) (scale bar = 50 μm). (B) Normalized trajectories of 70 Th17 cells over 12 time points before and after anti-α4β7 antibody. (C) mean velocity and (D) arrest index of Th17 cells before and after integrin blockade. Statistical significance was calculated using the Mann–Whitney test (****P < 0.0001). (E) Mean displacement of Th17 cells is strongly decreased by anti-α4β7 blocking antibodies (After linear regression application, the differences between slopes resulted extremely significant; ***P < 0.0001). Data are expressed as mean ± SEM. A total of 146 cells were analyzed for CTRL and 176 after anti-α4 treatment from three independent experiments. Track lower than 12 time points were excluded from the analysis.
Figure 8
Figure 8
Intrathecal treatment with an anti-α4β7 blocking antibody ameliorates EAE. EAE mice were intrathecally injected with 10 μl PBS containing 50 μg of isotype control antibody (CTRL) or anti-α4β7 blocking antibody the day after disease onset and 2 days later. Some mice were euthanized 3 days after the first antibody injection for spinal cords neuropathology assessment. (A) EAE progression was measured by daily scores for the severity of clinical disease symptoms. Red arrows indicate intrathecal antibody administration. Data represent the mean ± SEM of 29 mice per condition from three independent experiments (*P < 0.05). Representative spinal cord sections and relative quantitative analysis of (B) demyelination, (C) inflammatory infiltrates and (D) CD3+ T cells, from mice treated with control (CTRL) or anti-α4β7 antibodies. 4–6 cross sections of spinal cord of 3 mice were analyzed. Error bars indicate SEM (****P < 0.0001). Scale bar = 100μm.

Similar articles

Cited by

References

    1. Ley K, Laudanna C, Cybulsky MI, Nourshargh S. Getting to the site of inflammation: the leukocyte adhesion cascade updated. Nat Rev Immunol (2007) 7(9):678–89. doi: 10.1038/nri2156 - DOI - PubMed
    1. Vestweber D. How leukocytes cross the vascular endothelium. Nat Rev Immunol (2015) 15(11):692–704. doi: 10.1038/nri3908 - DOI - PubMed
    1. Grayson MH, Hotchkiss RS, Karl IE, Holtzman MJ, Chaplin DD. Intravital microscopy comparing T lymphocyte trafficking to the spleen and the mesenteric lymph node. Am J Physiol Heart Circ Physiol (2003) 284(6):H2213–2226. doi: 10.1152/ajpheart.00999.2002 - DOI - PubMed
    1. Miller MJ, Wei SH, Cahalan MD, Parker I. Autonomous T cell trafficking examined in vivo with intravital two-photon microscopy. Proc Natl Acad Sci U.S.A. (2003) 100(5):2604–9. doi: 10.1073/pnas.2628040100 - DOI - PMC - PubMed
    1. Gelman AE, Li W, Richardson SB, Zinselmeyer BH, Lai J, Okazaki M, et al. . Cutting edge: acute lung allograft rejection is independent of secondary lymphoid organs. J Immunol (2009) 182(7):3969–73. doi: 10.4049/jimmunol.0803514 - DOI - PMC - PubMed

Publication types

Grants and funding

This work was supported in part by the European Research Council grants: 261079 NEUROTRAFFICKING, 695714 IMMUNOALZHEIMER, 693606 IMPEDE and 101069397 NeutrAD (to GC), Fondazione Italiana Sclerosi Multipla (FISM), Genova, Italy (Cod. 2013/R/21 to BR), National Multiple Sclerosis Society (NMSS), New York, NY, USA (to GC), NEXTGENERATIONEU and Ministry of University and Research (MUR), National Recovery and Resilience Plan (PNRR), project MNESYS (PE0000006) (to GC). SD was supported by a fellowship from FISM (Cod. 2013/B/5).

LinkOut - more resources