. 2023 Mar 28;15(4):862.
doi: 10.3390/v15040862.

The Isolation and In Vitro Differentiation of Primary Fetal Baboon Tracheal Epithelial Cells for the Study of SARS-CoV-2 Host-Virus Interactions

Affiliations

The Isolation and In Vitro Differentiation of Primary Fetal Baboon Tracheal Epithelial Cells for the Study of SARS-CoV-2 Host-Virus Interactions

Bharathiraja Subramaniyan et al. Viruses. .

Abstract

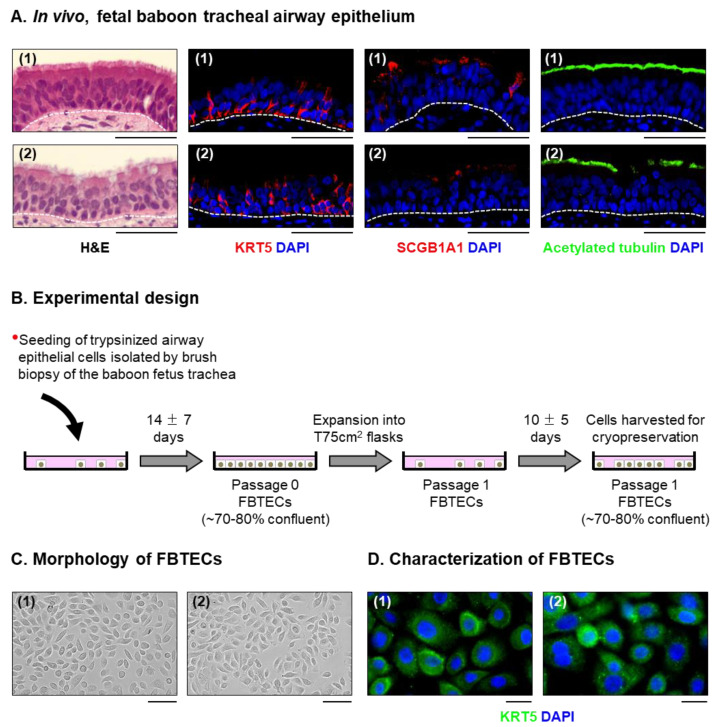
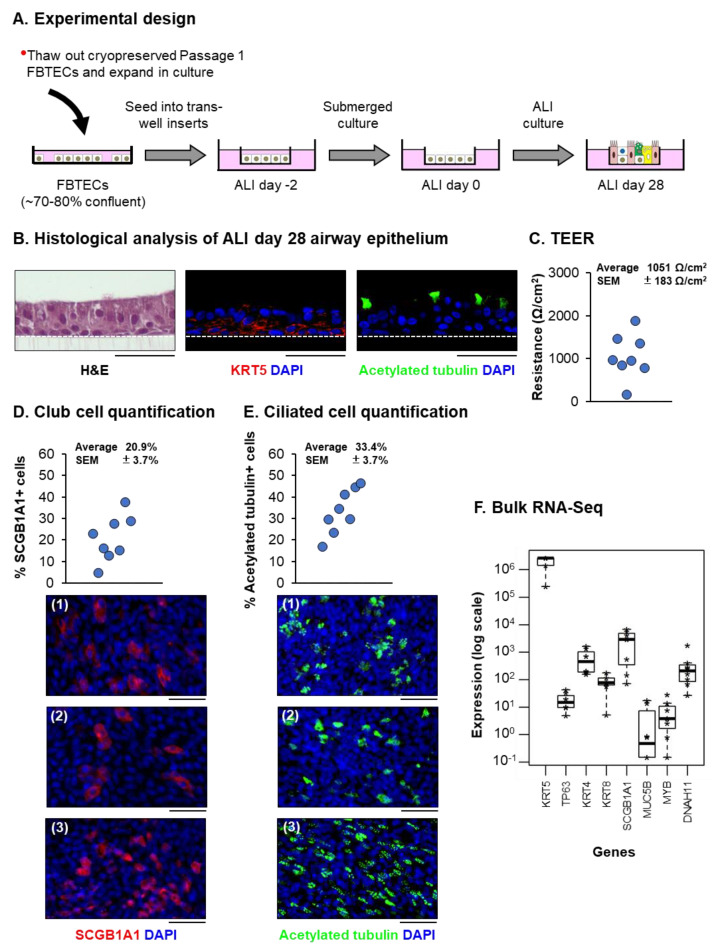
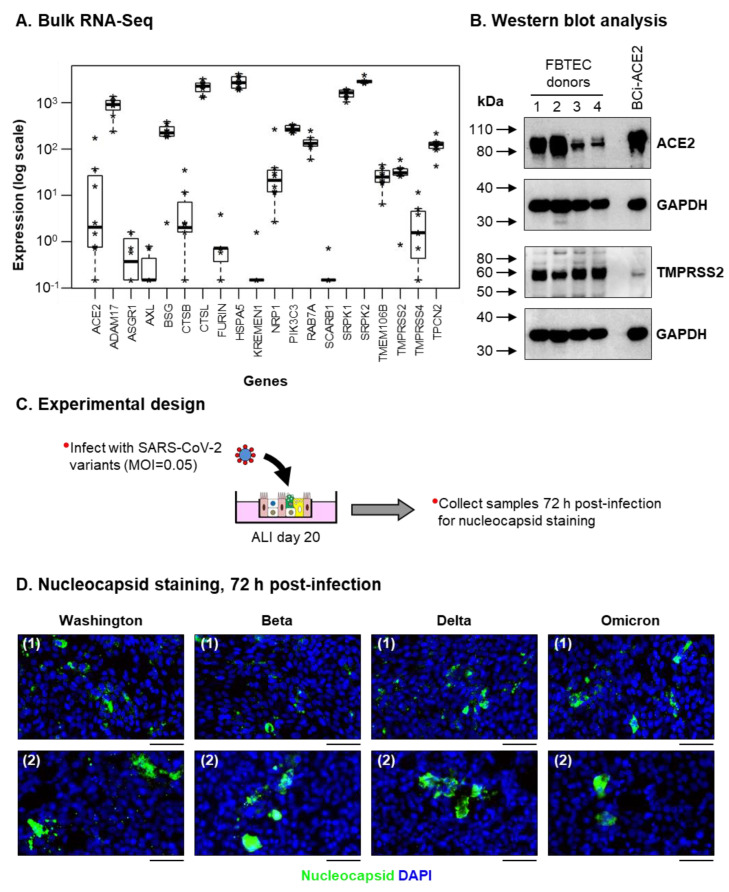
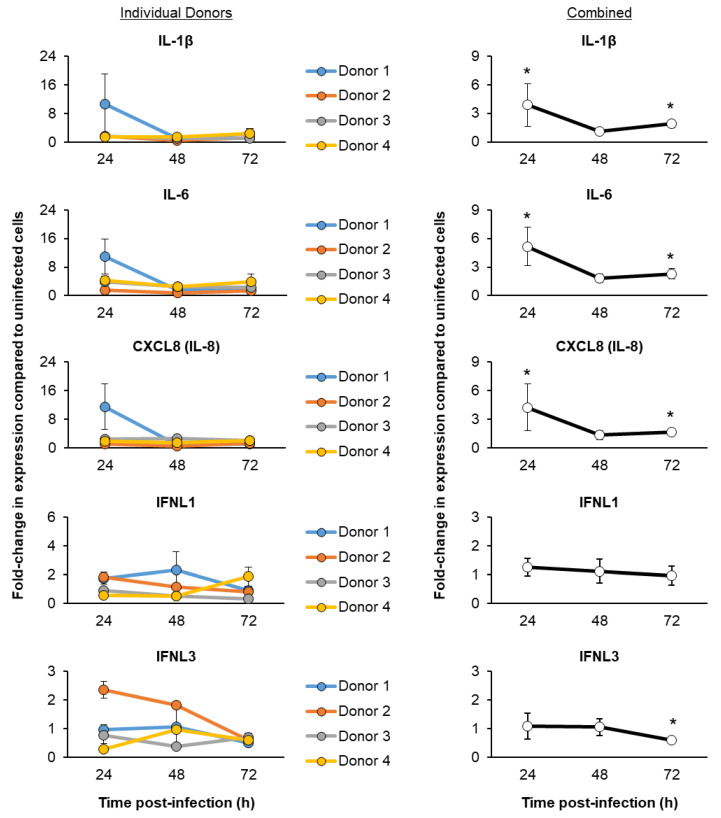
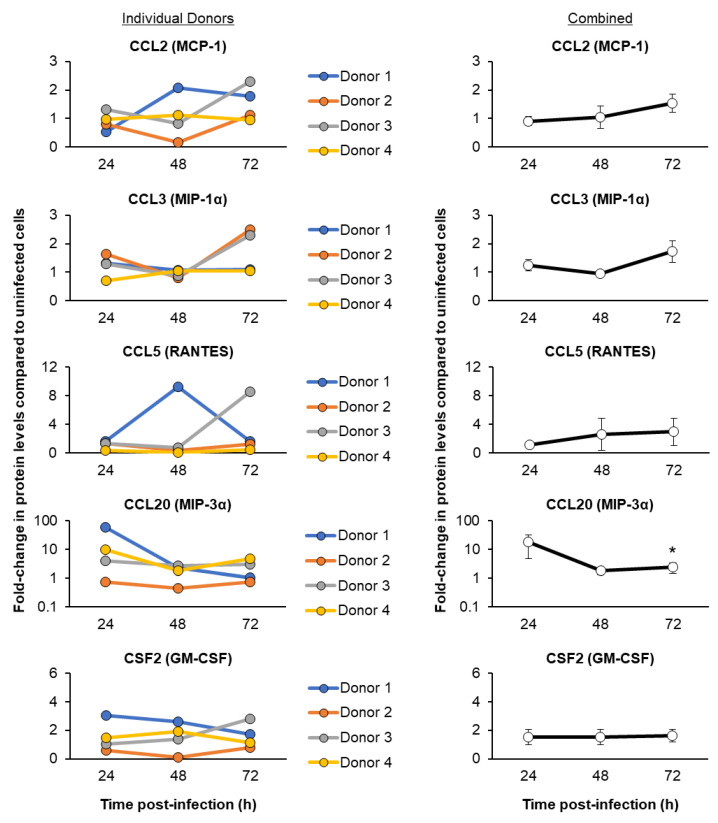
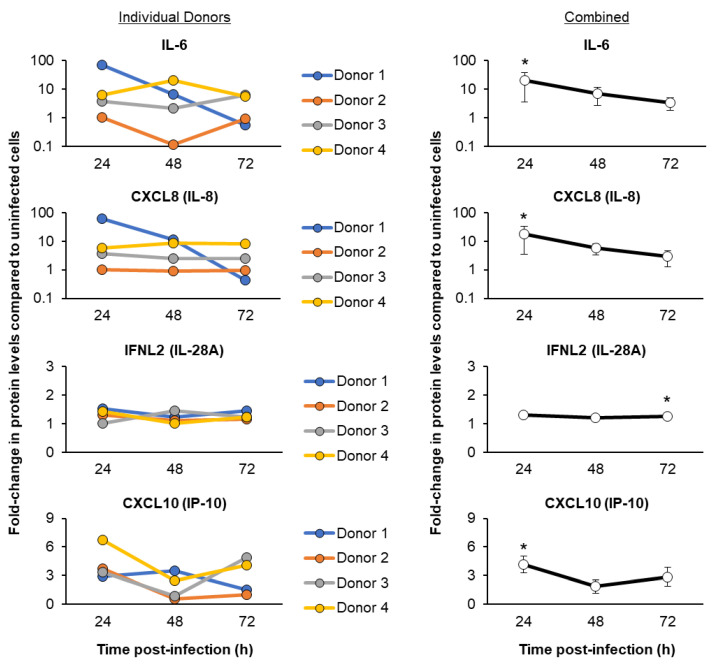
The mucociliary airway epithelium lines the human airways and is the primary site of host-environmental interactions in the lung. Following virus infection, airway epithelial cells initiate an innate immune response to suppress virus replication. Therefore, defining the virus-host interactions of the mucociliary airway epithelium is critical for understanding the mechanisms that regulate virus infection, including Severe Acute Respiratory Syndrome Coronavirus 2 (SARS-CoV-2). Non-human primates (NHP) are closely related to humans and provide a model to study human disease. However, ethical considerations and high costs can restrict the use of in vivo NHP models. Therefore, there is a need to develop in vitro NHP models of human respiratory virus infection that would allow for rapidly characterizing virus tropism and the suitability of specific NHP species to model human infection. Using the olive baboon (Papio anubis), we have developed methodologies for the isolation, in vitro expansion, cryopreservation, and mucociliary differentiation of primary fetal baboon tracheal epithelial cells (FBTECs). Furthermore, we demonstrate that in vitro differentiated FBTECs are permissive to SARS-CoV-2 infection and produce a potent host innate-immune response. In summary, we have developed an in vitro NHP model that provides a platform for the study of SARS-CoV-2 infection and other human respiratory viruses.

Keywords: COVID-19; SARS-CoV-2; airway epithelium; air–liquid interface; baboon; immune response; inflammation; innate immunity; non-human primate.


Conflict of interest statement

All the authors declare they have no conflict of interest in relation to the subject matter or materials discussed in this manuscript. The funders had no role in study design, data collection, data analysis, decision to publish or preparation of the manuscript.

Figures

Figure 1
Figure 1
Isolation, in vitro expansion and cryopreservation of primary FBTECs. (A) Histological analysis of the in vivo fetal baboon tracheal mucociliary airway epithelium. H&E staining and immunofluorescent staining of BCs (KRT5, red), club cells (SCGB1A1, red) and ciliated cells (acetylated tubulin, green). The nuclei are stained blue with DAPI. Scale bar = 50 µm. Representative images from n = 2 baboon fetuses (1–2) are shown. (B) Experimental design. Schematic for the isolation, in vitro expansion and cryopreservation of FBTECs. (C) Morphology of cultured FBTECs. Scale bar = 50 µm. (D) Characterization of FBTECs. Immunofluorescent staining of the BC marker, KRT5 (green), in Passage 1 FBTECs. Nuclei are stained blue with DAPI. Scale bar = 50 µm. Representative images from n = 2 FBTEC donors (1–2) are shown in panels (C,D).
Figure 2
Figure 2
FBTECs differentiate on in vitro ALI cultures to form a pseudostratified mucociliary airway epithelium. (A) Experimental design. Schematic for the in vitro differentiation of FBTECs on ALI culture. (B) Histological analysis of ALI day 28 airway epithelium. H&E staining and immunofluorescent staining of BCs (KRT5, red) and ciliated cells (acetylated tubulin, green). The nuclei are stained blue with DAPI. Scale bar = 50 µm. Representative images from a single FBTEC donor are shown. (C) TEER of ALI day 28 cultures from n = 8 FBTEC donors. The resistance is presented as Ohms (Ω)/cm2. (D) Club cell quantification. Immunofluorescent staining of club cells (SCGB1A1, red) in ALI day 28 cultures from n = 8 FBTEC donors. Nuclei are stained blue with DAPI. Scale bar = 50 µm. (E) Ciliated cell quantification. Immunofluorescent staining of ciliated cells (acetylated tubulin, green) in ALI day 28 cultures from n = 8 FBTEC donors. Nuclei are stained blue with DAPI. Scale bar = 50 µm. Representative images from n = 3 FBTEC donors (1–3) are shown for Panels (D,E). (F) Box plots showing expression (on a log scale) of specific markers for BC (KRT5 and TP63), intermediate (KRT4 and KRT8), club (SCGB1A1), goblet (MUC5B) and ciliated (MYB and DNAH11) cells in ALI day 28 cultures from n = 8 FBTEC donors by bulk RNA-Seq. Each donor is represented by an asterix (*), with the bar and box representing the median expression and interquartile range (IQR) across all donors, and with whiskers extending to 1.5× the IQR in either direction from the top or bottom quartile.
Figure 3
Figure 3
ALI differentiated FBTECs are permissive to SARS-CoV-2 Infection. (A) Box plots showing the expression (on a log scale) of host factors that regulate SARS-CoV-2 replication in ALI day 28 cultures from n = 8 FBTEC donors by bulk RNA-Seq. Each donor is represented by an asterix (*), with the bar and box representing the median expression and interquartile range (IQR) across all donors, and with whiskers extending to 1.5× the IQR in either direction from the top or bottom quartile. (B) Western blot analysis of ACE2 and TMPRSS2 protein levels in ALI day 28 differentiated cultures from n = 4 FBTEC donors (1–4). Cell lysates of the human airway epithelial cell line BCi-NS1.1 over-expressing human ACE2 (BCi-ACE2) were used as a positive control for both proteins. GAPDH was used as a loading control. (C) Experimental design. ALI day 20 cultures of FBTEC cells were infected with multiple SARS-CoV-2 variants (Washington, Beta, Delta and Omicron) at a MOI of 0.05. (D) Immunofluorescent staining of SARS-CoV-2 nucleocapsid (green) and the nuclei (blue, DAPI) in cultures 72 h post-infection for each SARS-CoV-2 variant (Washington, Beta, Delta and Omicron). Scale bar = 50 µm. Representative images from n = 2 FBTEC donors (1–2) are shown.
Figure 4
Figure 4
Temporal kinetics of SARS-CoV-2 Omicron infection. (A) Experimental design. ALI days 27–31 cultures of FBTEC cells from n = 4 donors (1–4) were infected with SARS-CoV-2 Omicron at a MOI of 1. The cells were then harvested as a function of time post-infection (24–72 h) for an analysis of the viral replication. (B) Immunofluorescent staining of SARS-CoV-2 nucleocapsid (green) and the nuclei (blue, DAPI) in cultures 72 h post-infection for each donor (1–4). Scale bar = 50 µm. (C) qPCR analysis of the SARS-CoV-2 nucleocapsid gene expression. In the left panel, the data are presented for each individual donor, with each data point representing the mean relative expression from n = 3 ALI wells and the error bars indicating the SEM. In the right panel, the data are combined and presented as the mean relative expression from n = 4 donors, with the error bars indicating the SEM. (D) Infectious virus production quantified by TCID50. Data are presented for each individual donor from two replicates (Rep 1 and Rep 2), with each data point representing the TCID50/mL calculated from a single ALI well. The black dashed line represents the limit of detection for the assay.
Figure 5
Figure 5
Temporal kinetics of the host cytokine and chemokine responses following SARS-CoV-2 Omicron infection. ALI day 27–31 cultures of FBTEC cells from n = 4 donors (1–4) were infected with SARS-CoV-2 Omicron at a MOI of 1. The cells were then as a function of time post-infection (24–72 h) for qPCR analysis of the immune related genes IL-1β, IL-6, CXCL8 (IL-8), IFNL1 and IFNL3. In the left panel, the data are presented for each individual donor, with each data point representing the mean fold-change in expression compared to uninfected cells from n = 3 ALI wells and the error bars indicating the SEM. In the right panel, the data are combined and is presented as the mean fold-change in expression compared to uninfected cells from n = 4 donors, with the error bars indicating the SEM. * p < 0.05.
Figure 6
Figure 6
Temporal kinetics of the host cytokine and chemokine responses following SARS-CoV-2 Omicron infection. On ALI days 27–31, cultures of FBTEC cells from n = 4 donors (1–4) were infected with SARS-CoV-2 Omicron at a MOI of 1. The media supernatants were then harvested as a function of time post-infection (24–72 h) to analyze the protein levels of immune related genes CCL2 (MCP-1), CCL3 (MIP-1α), CCL5 (RANTES), CCL20 (MIP-3α) and CSF2 (GM-CSF). In the left panel, the data are presented for each individual donor, with each data point representing the fold-change in protein levels compared to uninfected cells from a single (n = 1) ALI well. In the right panel, the data are combined and presented as the mean fold-change in protein levels compared to the uninfected cells from n = 4 donors. The error bars indicate the SEM. * p ≤ 0.05.
Figure 7
Figure 7
Temporal kinetics of the host cytokine, chemokine and IFN responses following SARS-CoV-2 Omicron infection. On ALI days 27–31, cultures of FBTEC cells from n = 4 donors (1–4) were infected with SARS-CoV-2 Omicron at a MOI of 1. The media supernatants were then harvested as a function of time post-infection (24–72 h) to analyze the protein levels of immune related genes IL-6, CXCL8 (IL-8), IFNL2 (IL-28A) and CXCL10 (IP-10). In the left panel, the data are presented for each individual donor, with each data point representing the fold-change in protein levels compared to uninfected cells from a single (n = 1) ALI well. In the right panel, the data are combined and presented as the mean fold-change in protein levels compared to the uninfected cells from n = 4 donors. The error bars indicate the SEM. * p ≤ 0.05.

Similar articles

References

    1. Alysandratos K.D., Herriges M.J., Kotton D.N. Epithelial Stem and Progenitor Cells in Lung Repair and Regeneration. Annu. Rev. Physiol. 2021;83:529–550. doi: 10.1146/annurev-physiol-041520-092904. - DOI - PMC - PubMed
    1. Basil M.C., Katzen J., Engler A.E., Guo M., Herriges M.J., Kathiriya J.J., Windmueller R., Ysasi A.B., Zacharias W.J., Chapman H.A., et al. The Cellular and Physiological Basis for Lung Repair and Regeneration: Past, Present, and Future. Cell Stem. Cell. 2020;26:482–502. doi: 10.1016/j.stem.2020.03.009. - DOI - PMC - PubMed
    1. Basil M.C., Morrisey E.E. Lung regeneration: A tale of mice and men. Semin. Cell Dev. Biol. 2020;100:88–100. doi: 10.1016/j.semcdb.2019.11.006. - DOI - PMC - PubMed
    1. Davis J.D., Wypych T.P. Cellular and functional heterogeneity of the airway epithelium. Mucosal. Immunol. 2021;14:978–990. doi: 10.1038/s41385-020-00370-7. - DOI - PMC - PubMed
    1. Hogan B.L., Barkauskas C.E., Chapman H.A., Epstein J.A., Jain R., Hsia C.C., Niklason L., Calle E., Le A., Randell S.H., et al. Repair and regeneration of the respiratory system: Complexity, plasticity, and mechanisms of lung stem cell function. Cell Stem. Cell. 2014;15:123–138. doi: 10.1016/j.stem.2014.07.012. - DOI - PMC - PubMed

Publication types