. 2023 Apr 16;24(8):7349.
doi: 10.3390/ijms24087349.

Network Biology Analyses and Dynamic Modeling of Gene Regulatory Networks under Drought Stress Reveal Major Transcriptional Regulators in Arabidopsis

Affiliations

Network Biology Analyses and Dynamic Modeling of Gene Regulatory Networks under Drought Stress Reveal Major Transcriptional Regulators in Arabidopsis

Nilesh Kumar et al. Int J Mol Sci. .

Abstract

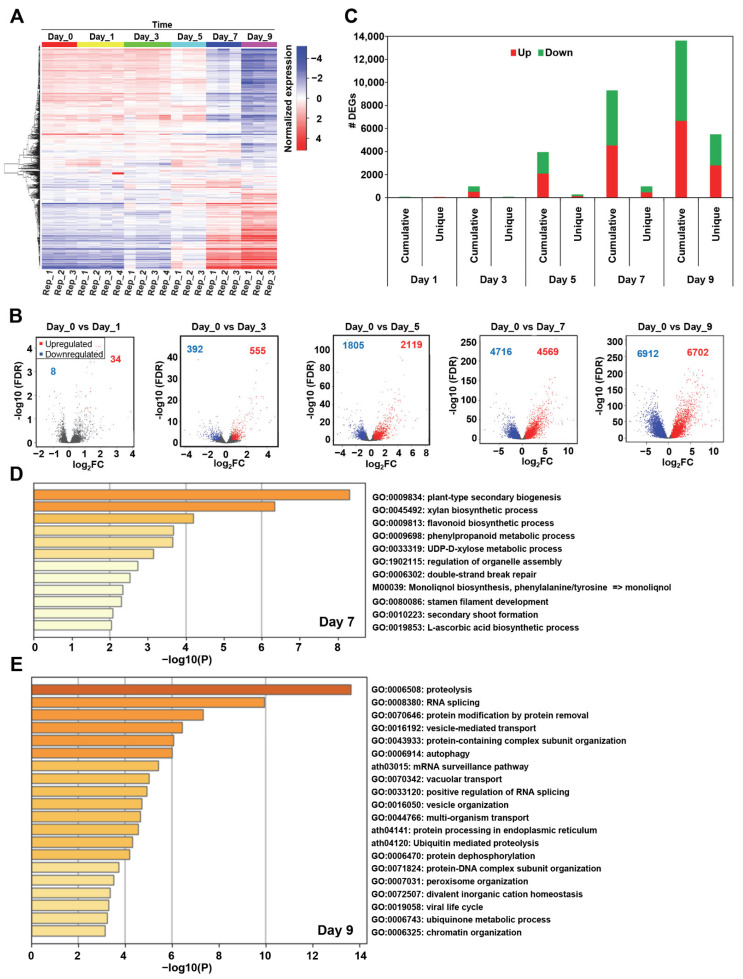
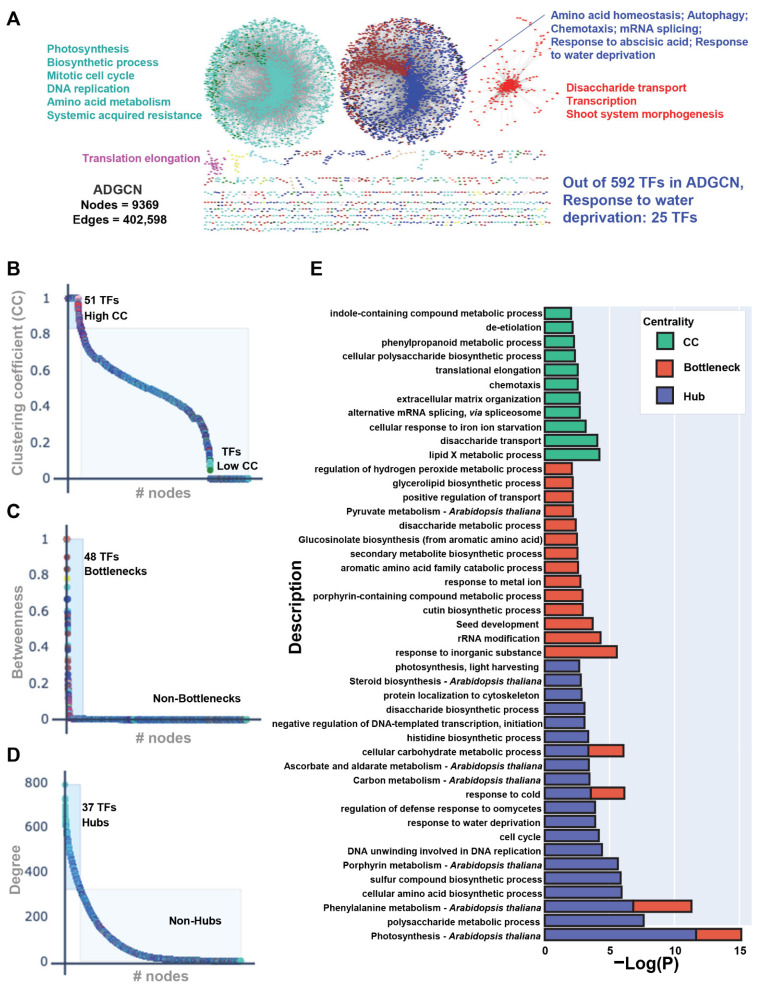
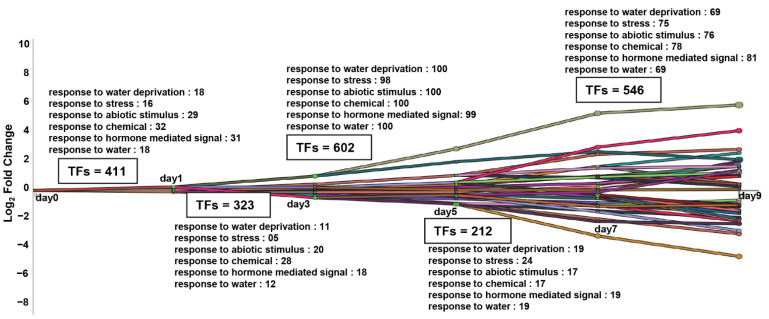
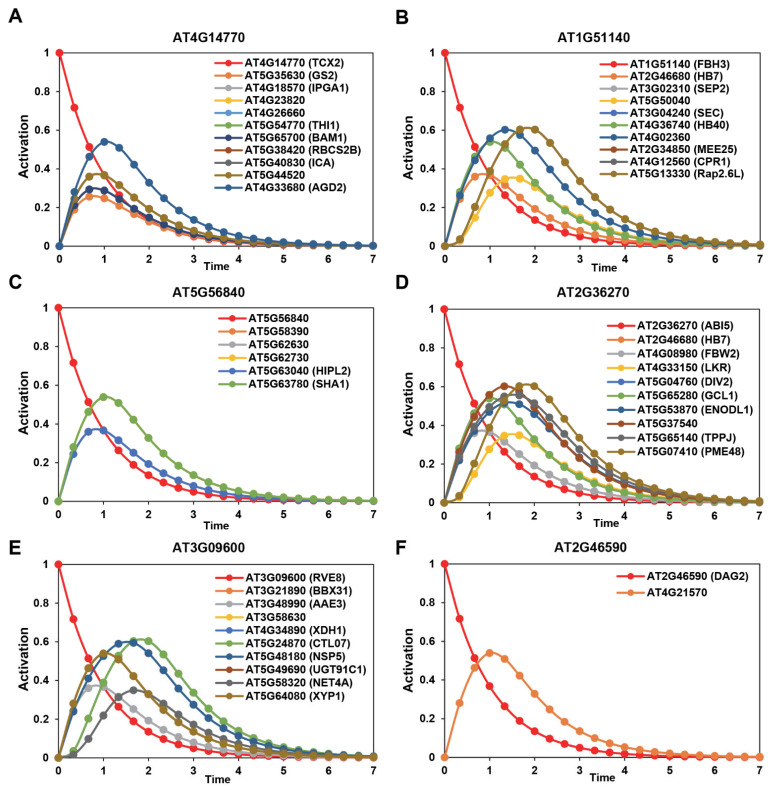
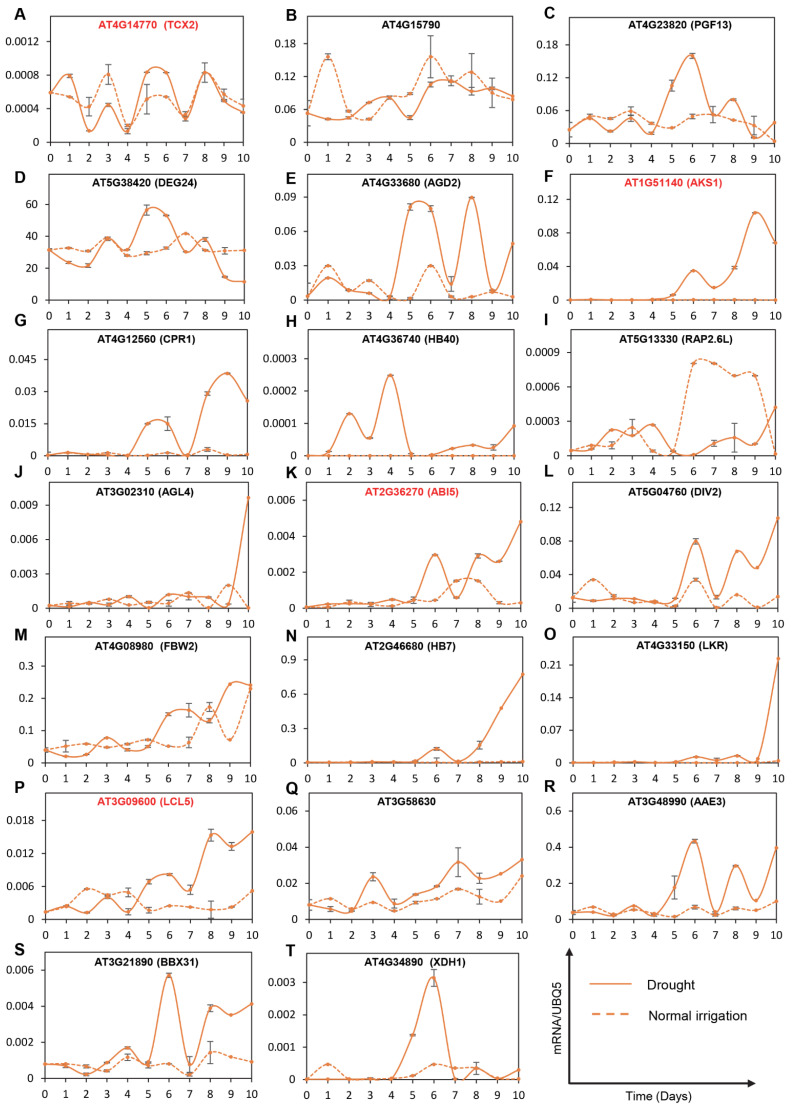
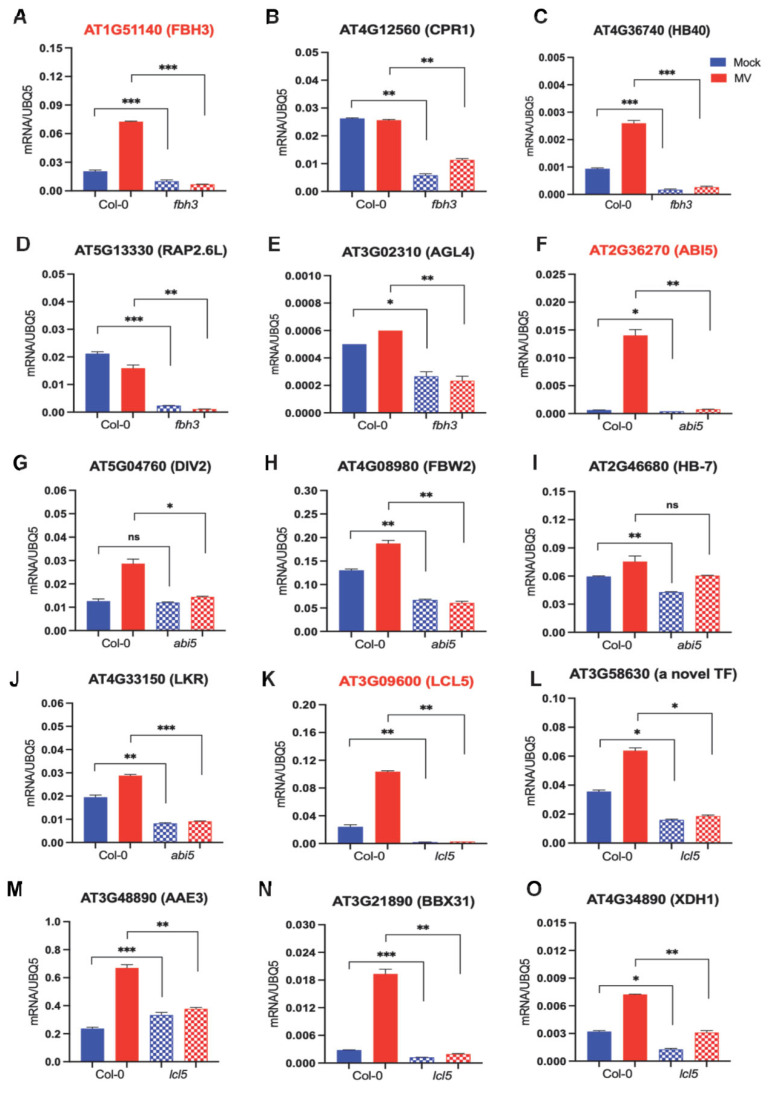
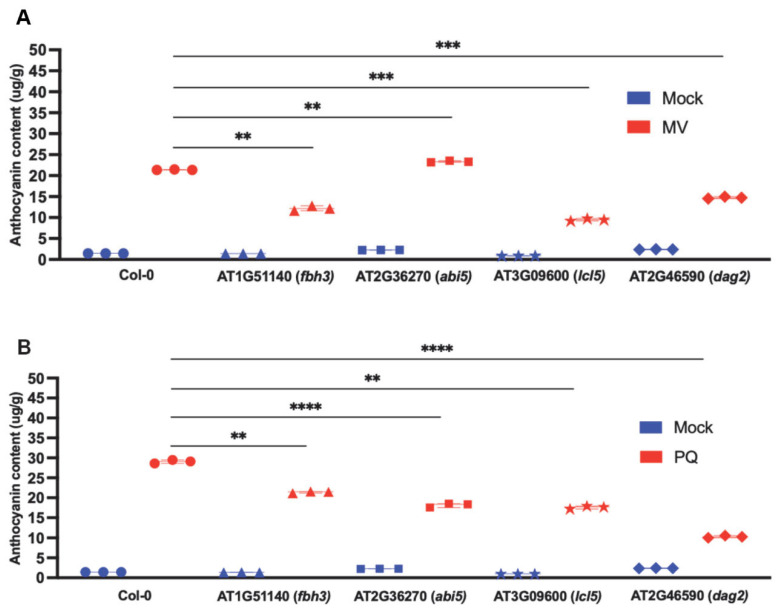
Drought is one of the most serious abiotic stressors in the environment, restricting agricultural production by reducing plant growth, development, and productivity. To investigate such a complex and multifaceted stressor and its effects on plants, a systems biology-based approach is necessitated, entailing the generation of co-expression networks, identification of high-priority transcription factors (TFs), dynamic mathematical modeling, and computational simulations. Here, we studied a high-resolution drought transcriptome of Arabidopsis. We identified distinct temporal transcriptional signatures and demonstrated the involvement of specific biological pathways. Generation of a large-scale co-expression network followed by network centrality analyses identified 117 TFs that possess critical properties of hubs, bottlenecks, and high clustering coefficient nodes. Dynamic transcriptional regulatory modeling of integrated TF targets and transcriptome datasets uncovered major transcriptional events during the course of drought stress. Mathematical transcriptional simulations allowed us to ascertain the activation status of major TFs, as well as the transcriptional intensity and amplitude of their target genes. Finally, we validated our predictions by providing experimental evidence of gene expression under drought stress for a set of four TFs and their major target genes using qRT-PCR. Taken together, we provided a systems-level perspective on the dynamic transcriptional regulation during drought stress in Arabidopsis and uncovered numerous novel TFs that could potentially be used in future genetic crop engineering programs.

Keywords: Arabidopsis; co-expression network; computational simulation; drought; network centrality; systems biology; transcriptional regulation; water deprivation.


Conflict of interest statement

The authors declare no conflict of interest.

Figures

Figure 1
Figure 1
Arabidopsis transcriptome dataset (GSE76827) displays more change in the expression patterns at later sampling days of drought stress. (A) Heatmap of the gene expression profile of Arabidopsis under drought conditions on different sampling days (as indicated). The color bars display the normalized gene expression (Red ≥ 1, Blue ≤ −1). (B) The total number of uniquely expressed genes on days 1, 3, 5, 7, and 9 are shown in the plots. (C) Differential gene expression is displayed during the drought treatment time frame. The total number of genes significantly deferentially expressed were 42, 947, 3924, 9285, and 13,614, respectively, on days 1, 3, 5, 7, and 9(false discovery rate (FDR) ≤ 0.05, log2 Fold Change (log2FC) ≥ |0.58|). Red dots correspond to up-regulated genes, while blue points indicate down-regulated genes. (D,E) The gene ontology (GO) enrichment analysis of Arabidopsis unique differentially expressed genes (DEGs) on day 7; (D), and day 9; (E)) after drought stress is presented (p-value ≤ 0.05). The color gradient of bars in the gene enrichment analysis represents low (yellow) to high (red) enrichment significance values.
Figure 2
Figure 2
(A) Weighted gene co-expression network analysis (WGCNA) constructed the Arabidopsis Drought-specific Gene Co-expression Network (ADGCN) encompassing 9370 nodes connected by 402,598 weighted edges (≥0.75). Nodes are colored based on their specific module assignment. Most significant modules based on connectivity and clustering coefficient were annotated by GO analysis and the enriched pathways are listed next to their respective modules (p-value ≤ 0.05). (BD) ADGCN network analysis plots displaying clustering coefficient (CC) (B), betweenness centrality (C), and degree distribution (D). (E) Functional annotation and pathway enrichment analyses of high CC (green), high bottleneck (red), and high hub (violet) genes.
Figure 3
Figure 3
The plot illustrates the interactive Dynamic Regulatory Events Miner (iDREM) of drought response in Arabidopsis from day 0 to 9 at significance p < 0.01. The ontology identified the transcription factors (TFs) and genes involved in different functions on different days of drought stress. Each colored line corresponds to a unique transcriptional regulatory path and numbers of TFs representing each functional category are listed in text boxes.
Figure 4
Figure 4
(AF) The dynamic modeling and simulation of transcription factor regulatory network’s activity upon activation of six transcription factors (AT4G14770, AT1G51140, AT5G56840, AT2G36270, AT3G09600, and AT2G46590) identified by SQUAD. Activation patterns of the TFs are shown in red lines whereas individual target genes’ activation is illustrated in different colors.
Figure 5
Figure 5
Kinetics of gene expression of transcription factors (red) and their targets in Col-0 under drought (solid lines) and normal irrigation (dotted lines) conditions. RT-qPCR was performed in leaf samples collected daily from day 0 to day 10. Gene expression was assessed using reference gene UBQ5 in four groups: TF1 (AAT4G14770 and targets (B) AT4G15790, (C) AT4G23820, (D) AT5G38420, (E) AT4G33680; TF2 (F) AT1G51140 and targets (G) AT4G12560, (H) AT4G36740, (I) AT5G13330, (J) AT3G02310; TF3 (K) AT2G36270 and targets (L) AT5G04760, (M) AT4G08980, (N) AT2G46680, (O) AT4G33150; TF4 (P) AT3G09600 and targets (Q) AT3G58630, (R) AT3G48990, (S) AT3G21890, (T) AT4G34890. The graphs represent the mean with standard errors of three technical replicates. Experiments were performed in three biological replications. The gray lines indicate error bars computed as the standard errors.
Figure 6
Figure 6
Gene expression profile of transcription factors (red) and their targets in Col-0, fbh3 mutant, abi5 mutant, and lcl5 mutants in 1/2 MS media and 2uM methyl viologen (MV) treatment conditions. RT-qPCR was performed in leaf samples collected after 7 days of treatment. Gene expression was assessed using reference gene UBQ5 in three groups: TF1 (A) AT1G51140 and targets (B) AT4G12560, (C) AT4G36740, (D) AT5G13330, (E) AT3G02310; TF2 (F) AT2G36270 and targets (G) AT5G04760, (H) AT4G08980, (I) AT2G46680, (J) AT4G33150; TF3 (K) AT3G09600 and targets (L) AT3G58630, (M) AT3G48990, (N) AT3G21890, (O) AT4G34890. The graphs represent the mean with standard errors of three technical replicates. Experiments were performed in three biological replications. The statistical significance of the data is denoted by asterisks in the following manner: “* p < 0.05”, “** p < 0.005”, and “*** p < 0.0005”. The label “ns” indicates non-significant results, as determined by Student’s t-test. The lattice column indicates the significant differences between Col-0 and the mutants in comparison.
Figure 7
Figure 7
Anthocyanin content in leaves of 7 days old Arabidopsis plant in MS media and different stress conditions. (A) 2uM Methyl viologen (MV) treatment, n = 12 (three biological replicates) (B) 2uM paraquat (PQ) treatment, n = 12 (three biological replicates). Asterisks represented statistical significance (** p < 0.005, *** p < 0.0005, and **** p < 0.00005, Student’s t-test. The symbol ⬤ indicates Col-0, ▲ represents fbh3 mutant, ◼ signifies abi5 mutant, ★ identifies lcl5 mutant and ⯁ indicates dag2 mutant.

Similar articles

Cited by

References

    1. Rey D., Holman I.P., Knox J.W. Developing drought resilience in irrigated agriculture in the face of increasing water scarcity. Reg. Environ. Chang. 2017;17:1527–1540. doi: 10.1007/s10113-017-1116-6. - DOI - PMC - PubMed
    1. Fahad S., Bajwa A.A., Nazir U., Anjum S.A., Farooq A., Zohaib A., Sadia S., Nasim W., Adkins S., Saud S., et al. Crop Production under Drought and Heat Stress: Plant Responses and Management Options. Front. Plant Sci. 2017;8:1147. doi: 10.3389/fpls.2017.01147. - DOI - PMC - PubMed
    1. Leng G., Hall J. Crop yield sensitivity of global major agricultural countries to droughts and the projected changes in the future. Sci. Total Environ. 2019;654:811–821. doi: 10.1016/j.scitotenv.2018.10.434. - DOI - PMC - PubMed
    1. Obidiegwu J.E., Bryan G.J., Jones H.G., Prashar A. Coping with drought: Stress and adaptive responses in potato and perspectives for improvement. Front. Plant Sci. 2015;6:542. doi: 10.3389/fpls.2015.00542. - DOI - PMC - PubMed
    1. Lv L., Zhang W., Sun L., Zhao A., Zhang Y., Wang L., Liu Y., Li Z., Li H., Chen X. Gene co-expression network analysis to identify critical modules and candidate genes of drought-resistance in wheat. PLoS ONE. 2020;15:e0236186. doi: 10.1371/journal.pone.0236186. - DOI - PMC - PubMed

Substances

LinkOut - more resources