

HIV-Differentiated Metabolite N-Acetyl-L-Alanine Dysregulates Human Natural Killer Cell Responses to Mycobacterium tuberculosis Infection
- PMID: 37108430
- PMCID: PMC10138430
- DOI: 10.3390/ijms24087267
HIV-Differentiated Metabolite N-Acetyl-L-Alanine Dysregulates Human Natural Killer Cell Responses to Mycobacterium tuberculosis Infection
Abstract
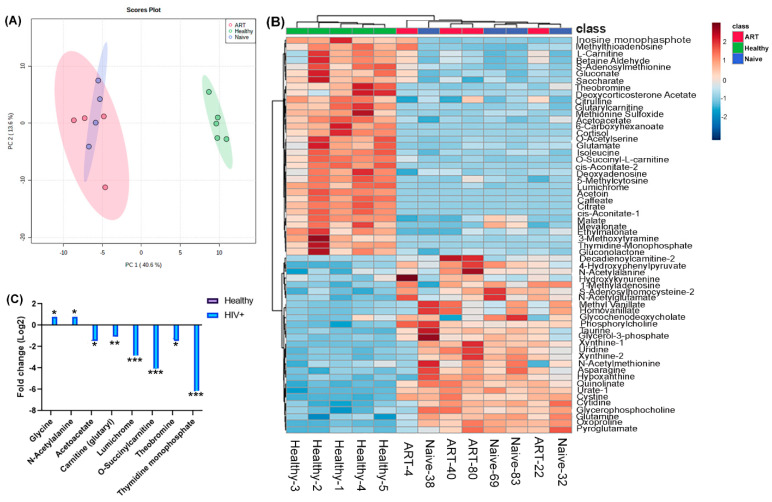
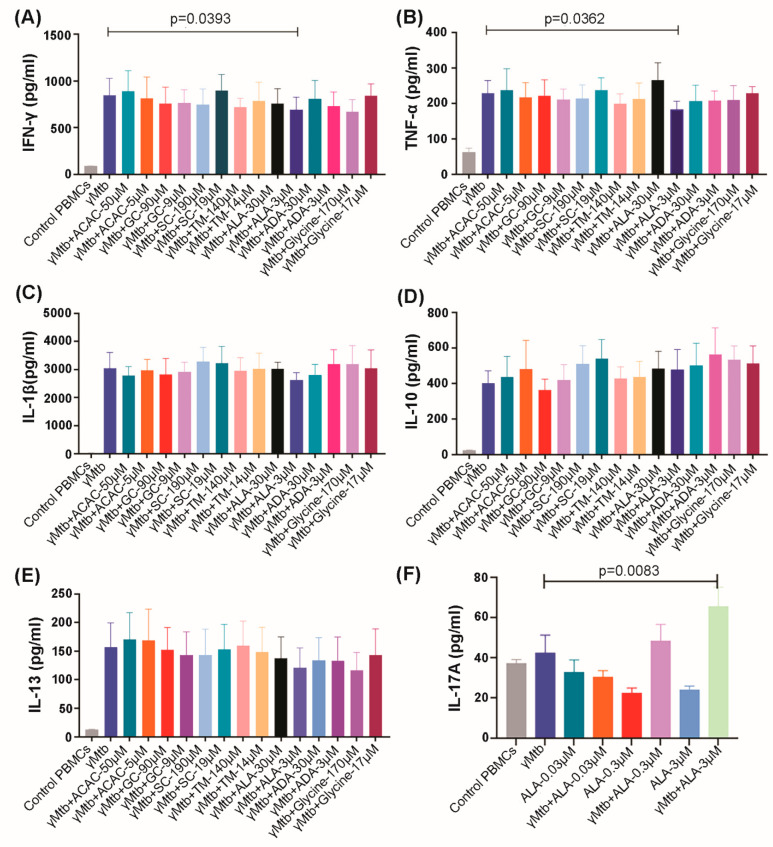
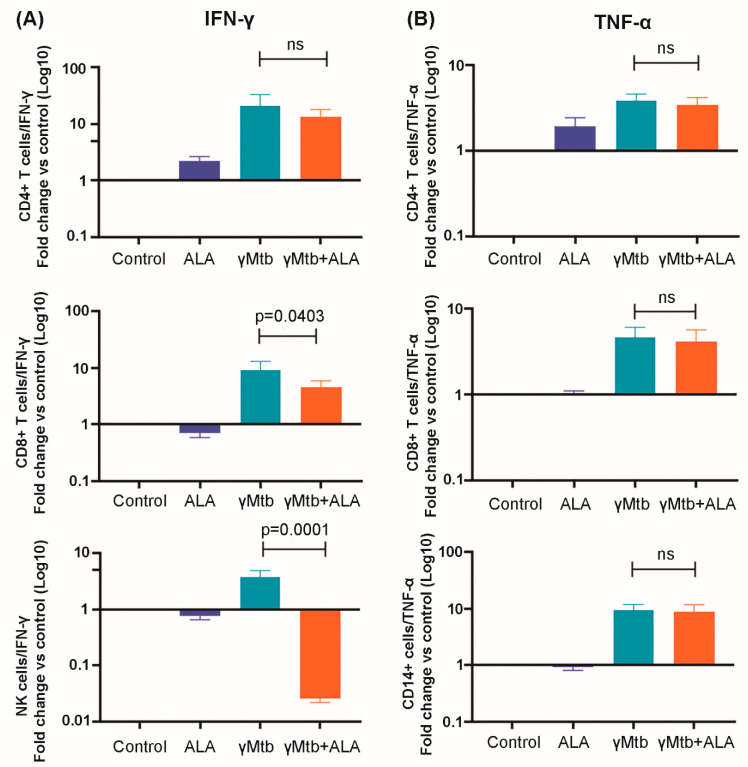
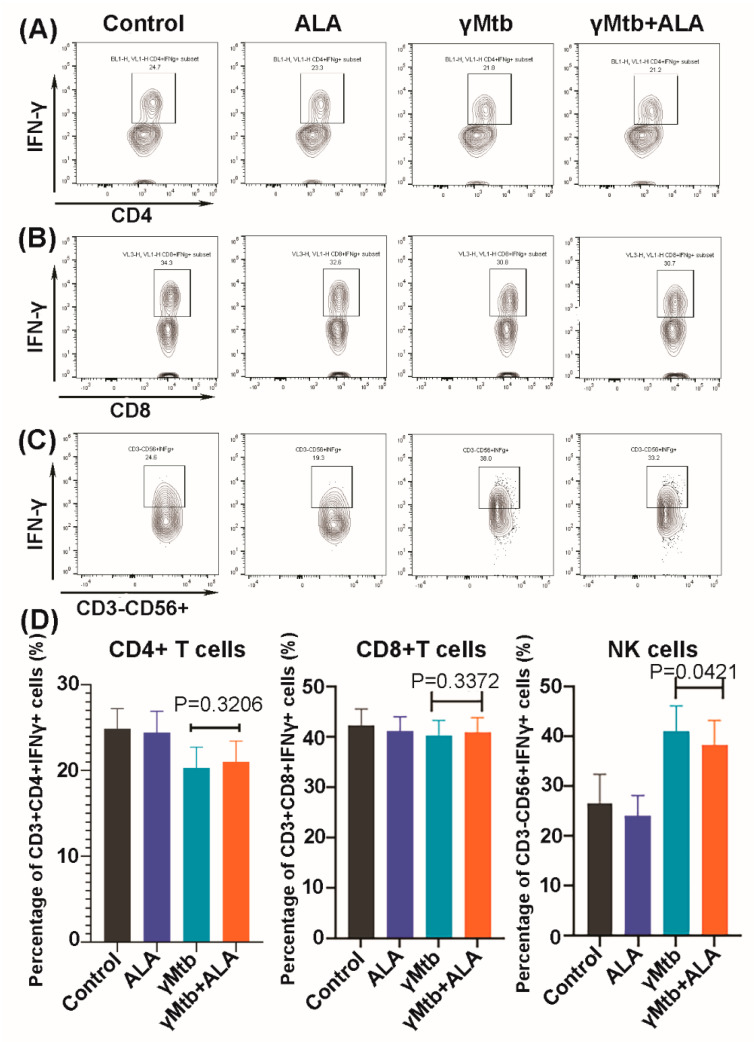
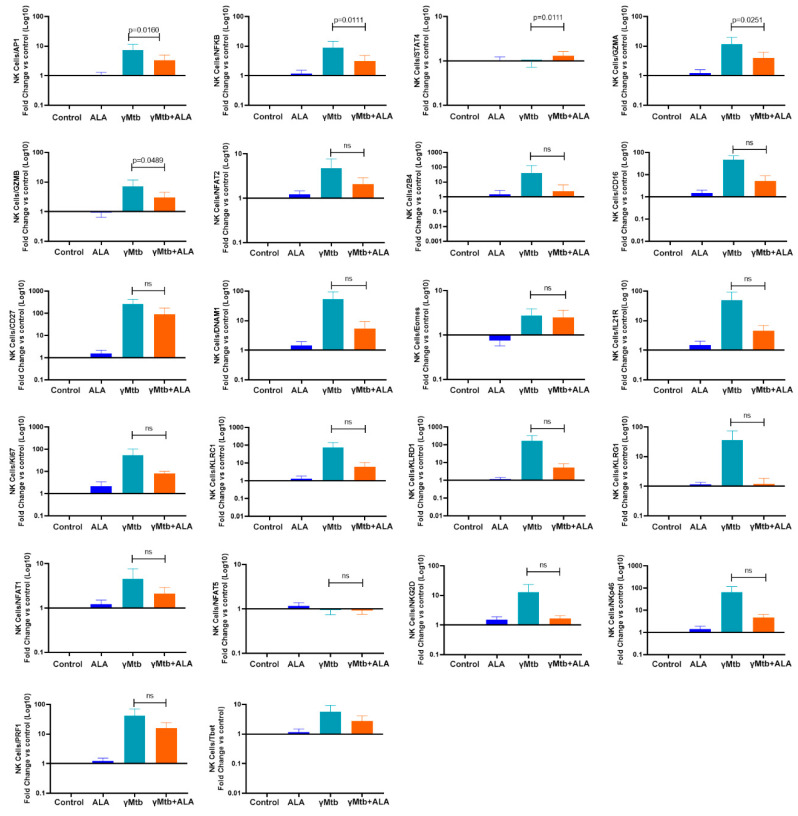
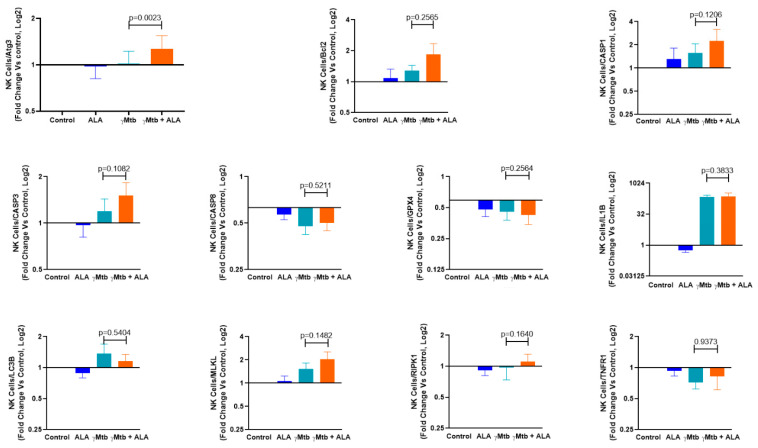
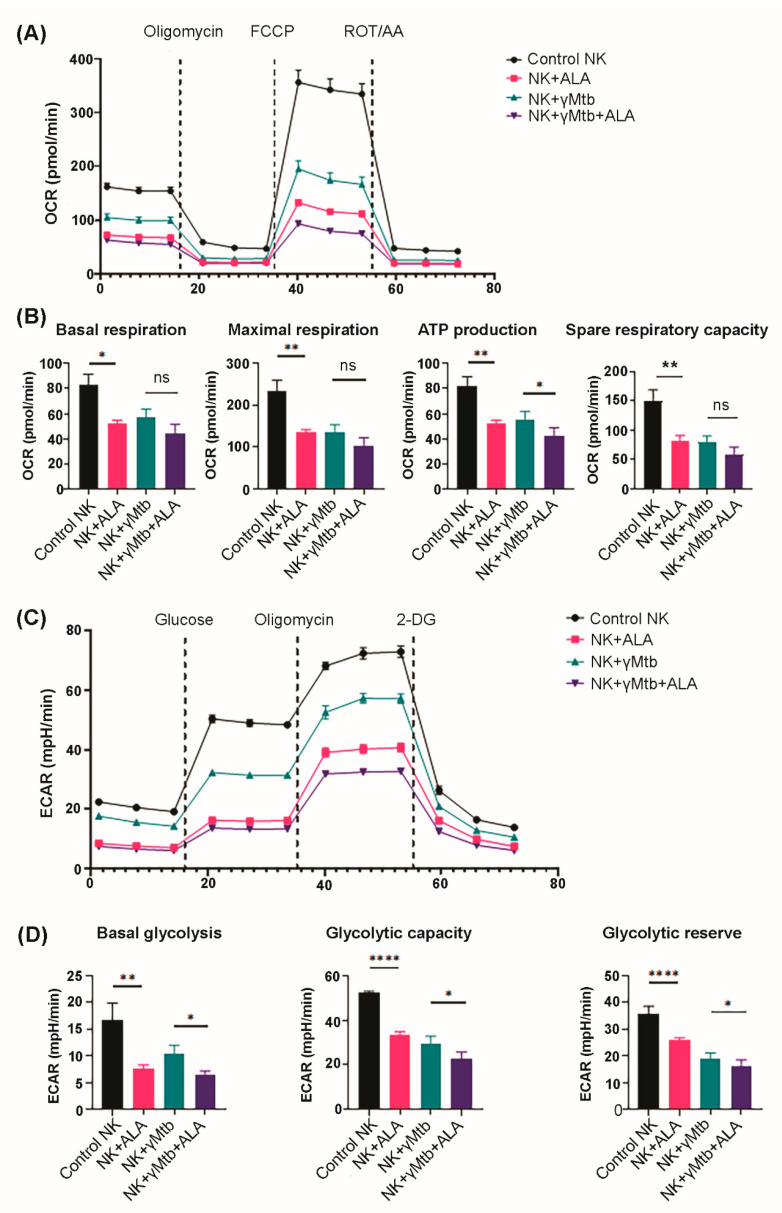
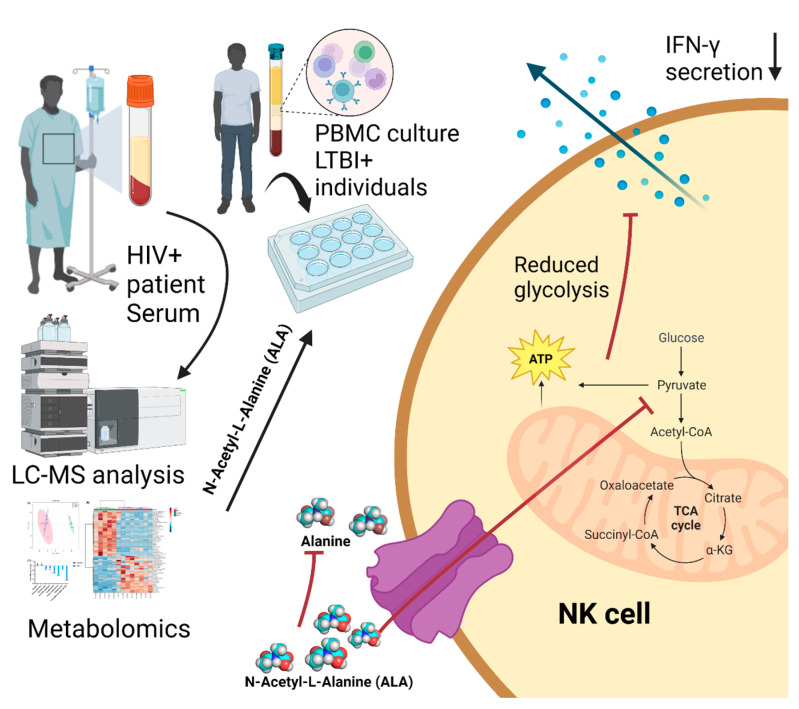
Mycobacterium tuberculosis (Mtb) has latently infected over two billion people worldwide (LTBI) and caused ~1.6 million deaths in 2021. Human immunodeficiency virus (HIV) co-infection with Mtb will affect the Mtb progression and increase the risk of developing active tuberculosis by 10-20 times compared with HIV- LTBI+ patients. It is crucial to understand how HIV can dysregulate immune responses in LTBI+ individuals. Plasma samples collected from healthy and HIV-infected individuals were investigated using liquid chromatography-mass spectrometry (LC-MS), and the metabolic data were analyzed using the online platform Metabo-Analyst. ELISA, surface and intracellular staining, flow cytometry, and quantitative reverse-transcription PCR (qRT-PCR) were performed using standard procedures to determine the surface markers, cytokines, and other signaling molecule expressions. Seahorse extra-cellular flux assays were used to measure mitochondrial oxidative phosphorylation and glycolysis. Six metabolites were significantly less abundant, and two were significantly higher in abundance in HIV+ individuals compared with healthy donors. One of the HIV-upregulated metabolites, N-acetyl-L-alanine (ALA), inhibits pro-inflammatory cytokine IFN-γ production by the NK cells of LTBI+ individuals. ALA inhibits the glycolysis of LTBI+ individuals' NK cells in response to Mtb. Our findings demonstrate that HIV infection enhances plasma ALA levels to inhibit NK-cell-mediated immune responses to Mtb infection, offering a new understanding of the HIV-Mtb interaction and providing insights into the implication of nutrition intervention and therapy for HIV-Mtb co-infected patients.
Keywords: HIV–Mtb co-infection; Mtb latent infection (LTBI); N-acetyl-L-alanine; interferon-γ; metabolite; natural killer cells.
Conflict of interest statement
The authors declare no competing interests.
Figures
Update of
-
HIV-differentiated metabolite N-Acetyl-L-Alanine dysregulates human natural killer cell responses to Mycobacterium tuberculosis infection.bioRxiv [Preprint]. 2023 Mar 1:2023.02.28.530445. doi: 10.1101/2023.02.28.530445. bioRxiv. 2023. Update in: Int J Mol Sci. 2023 Apr 14;24(8):7267. doi: 10.3390/ijms24087267. PMID: 36909560 Free PMC article. Updated. Preprint.
Similar articles
-
HIV-differentiated metabolite N-Acetyl-L-Alanine dysregulates human natural killer cell responses to Mycobacterium tuberculosis infection.bioRxiv [Preprint]. 2023 Mar 1:2023.02.28.530445. doi: 10.1101/2023.02.28.530445. bioRxiv. 2023. Update in: Int J Mol Sci. 2023 Apr 14;24(8):7267. doi: 10.3390/ijms24087267. PMID: 36909560 Free PMC article. Updated. Preprint.
-
Antigens of Mycobacterium tuberculosis Stimulate CXCR6+ Natural Killer Cells.Front Immunol. 2020 Sep 28;11:582414. doi: 10.3389/fimmu.2020.582414. eCollection 2020. Front Immunol. 2020. PMID: 33117393 Free PMC article.
-
Distinct effector memory CD4+ T cell signatures in latent Mycobacterium tuberculosis infection, BCG vaccination and clinically resolved tuberculosis.PLoS One. 2012;7(4):e36046. doi: 10.1371/journal.pone.0036046. Epub 2012 Apr 24. PLoS One. 2012. PMID: 22545156 Free PMC article.
-
Functional Signatures of Human CD4 and CD8 T Cell Responses to Mycobacterium tuberculosis.Front Immunol. 2014 Apr 22;5:180. doi: 10.3389/fimmu.2014.00180. eCollection 2014. Front Immunol. 2014. PMID: 24795723 Free PMC article. Review.
-
[Characteristics of a diagnostic method for tuberculosis infection based on whole blood interferon-gamma assay].Kekkaku. 2006 Nov;81(11):681-6. Kekkaku. 2006. PMID: 17154047 Review. Japanese.
Cited by
-
A novel humanized mouse model for HIV and tuberculosis co-infection studies.Front Immunol. 2024 May 10;15:1395018. doi: 10.3389/fimmu.2024.1395018. eCollection 2024. Front Immunol. 2024. PMID: 38799434 Free PMC article.
-
HIV-TB Coinfection: Current Therapeutic Approaches and Drug Interactions.Viruses. 2024 Feb 21;16(3):321. doi: 10.3390/v16030321. Viruses. 2024. PMID: 38543687 Free PMC article. Review.
-
Genetically predicted N-Acetyl-L-Alanine mediates the association between CD3 on activated and secreting Tregs and Guillain-Barre syndrome.Front Neurosci. 2024 Sep 20;18:1398653. doi: 10.3389/fnins.2024.1398653. eCollection 2024. Front Neurosci. 2024. PMID: 39371607 Free PMC article.
-
A Novel Humanized Mouse Model for HIV and Tuberculosis Co-infection Studies.bioRxiv [Preprint]. 2024 Mar 7:2024.03.05.583545. doi: 10.1101/2024.03.05.583545. bioRxiv. 2024. Update in: Front Immunol. 2024 May 10;15:1395018. doi: 10.3389/fimmu.2024.1395018. PMID: 38496484 Free PMC article. Updated. Preprint.
-
The role of circulating metabolites and gut microbiome in hypertrophic scar: a two-sample Mendelian randomization study.Arch Dermatol Res. 2024 Jun 1;316(6):315. doi: 10.1007/s00403-024-03116-8. Arch Dermatol Res. 2024. PMID: 38822918
References
-
- Kaplan J.E., Benson C., Holmes K.K., Brooks J.T., Pau A., Masur H., Centers for Disease Control and Prevention (CDC) National Institutes of Health. HIV Medicine Association of the Infectious Diseases Society of America Guidelines for prevention and treatment of opportunistic infections in HIV-infected adults and adolescents: Recommendations from CDC, the National Institutes of Health, and the HIV Medicine Association of the Infectious Diseases Society of America. MMWR Recomm. Rep. 2009;58:1–207. - PubMed
MeSH terms
Substances
Grants and funding
LinkOut - more resources
Full Text Sources
Medical
