. 2023 Aug 1;21(8):808-824.
doi: 10.1158/1541-7786.MCR-22-1000.

Dynamic Intestinal Stem Cell Plasticity and Lineage Remodeling by a Nutritional Environment Relevant to Human Risk for Tumorigenesis

Affiliations

Dynamic Intestinal Stem Cell Plasticity and Lineage Remodeling by a Nutritional Environment Relevant to Human Risk for Tumorigenesis

Jiahn Choi et al. Mol Cancer Res. .

Abstract

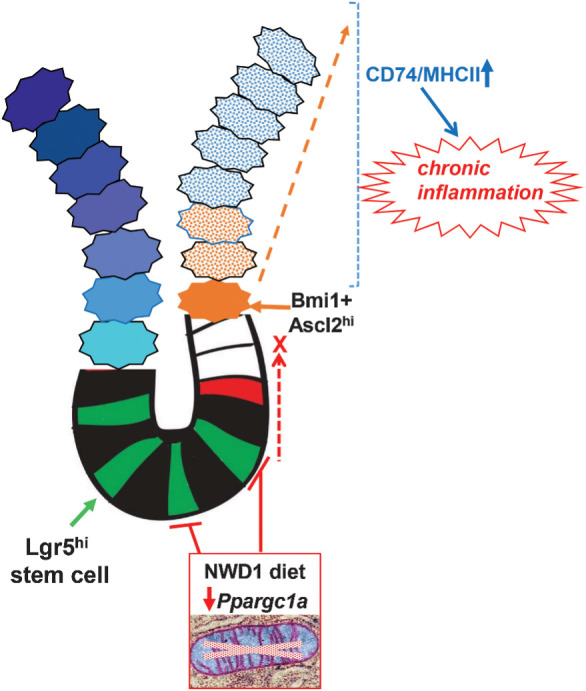
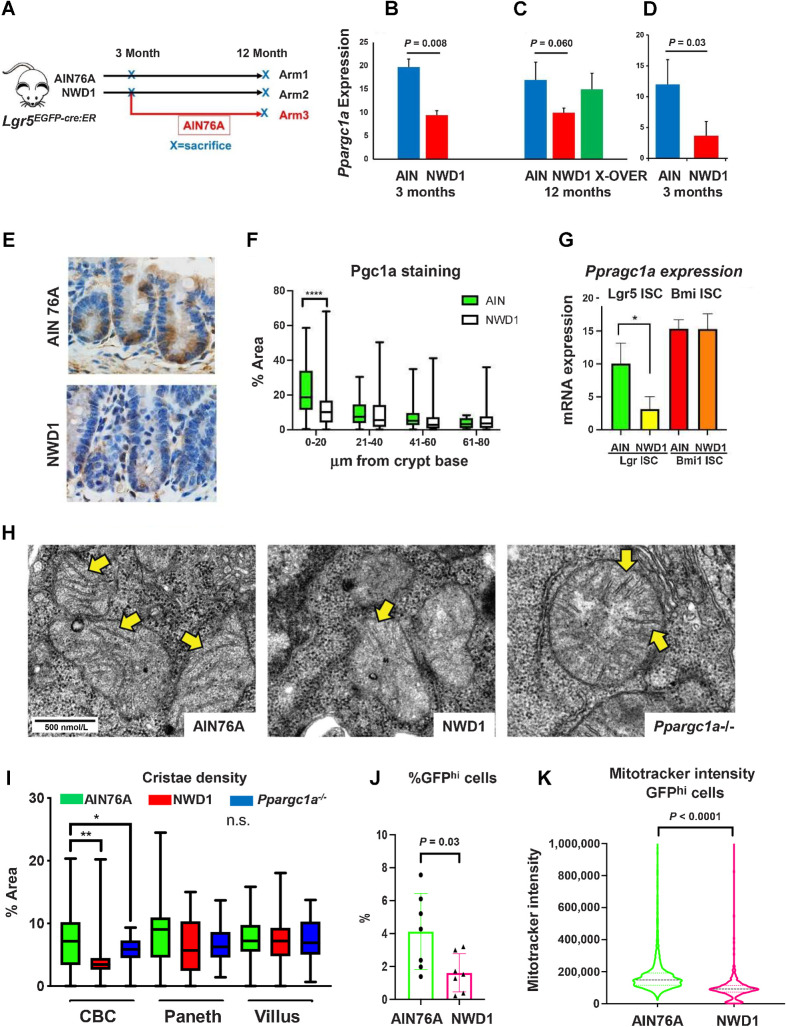
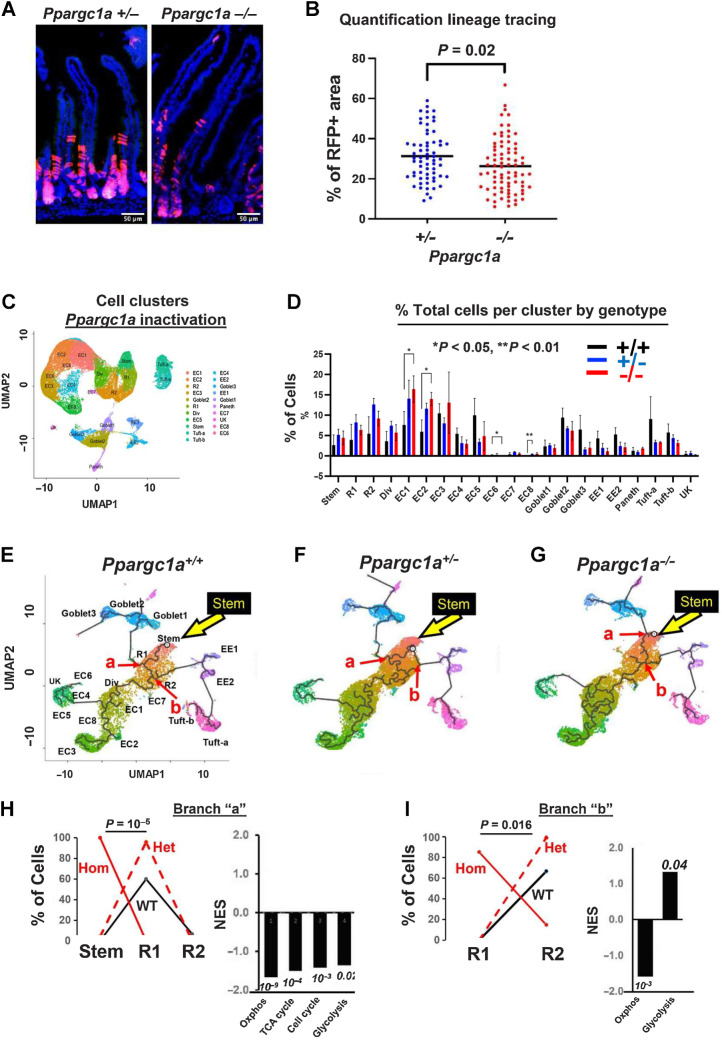
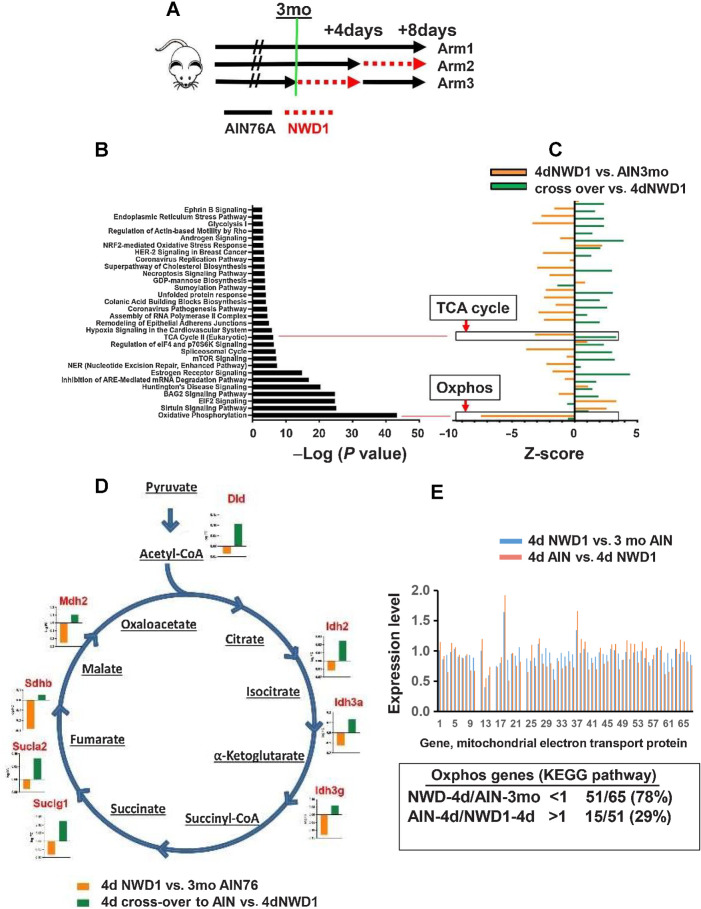
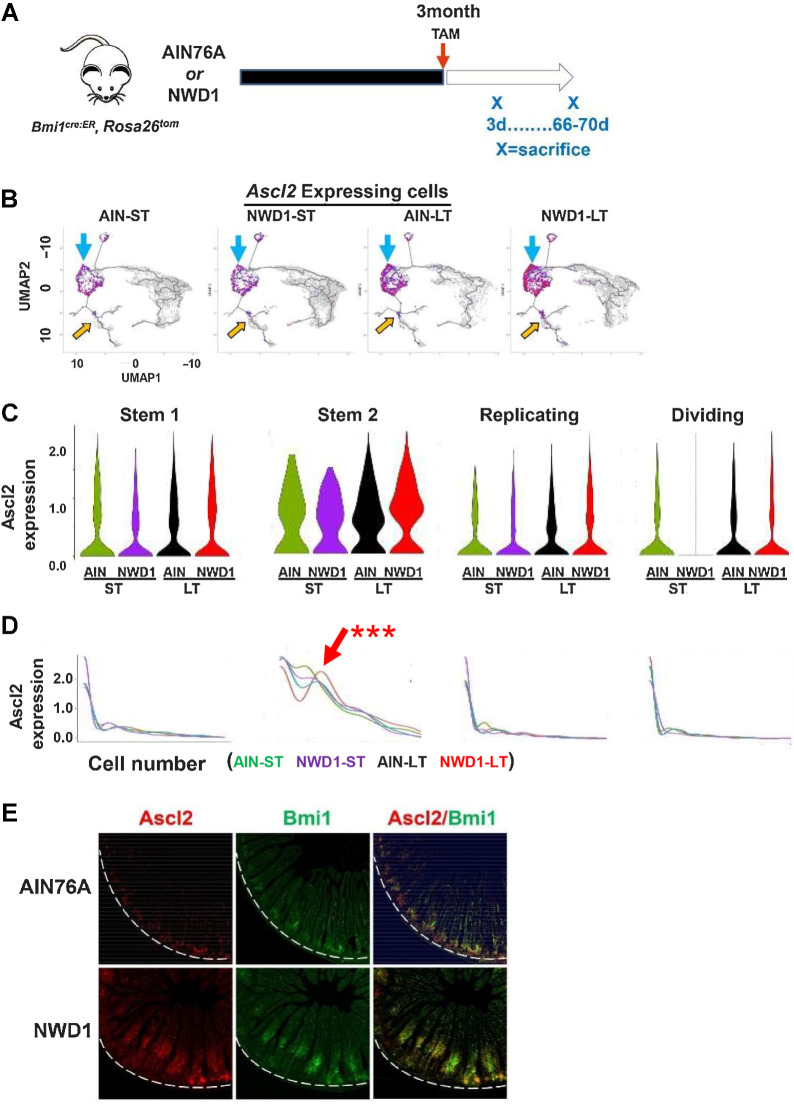
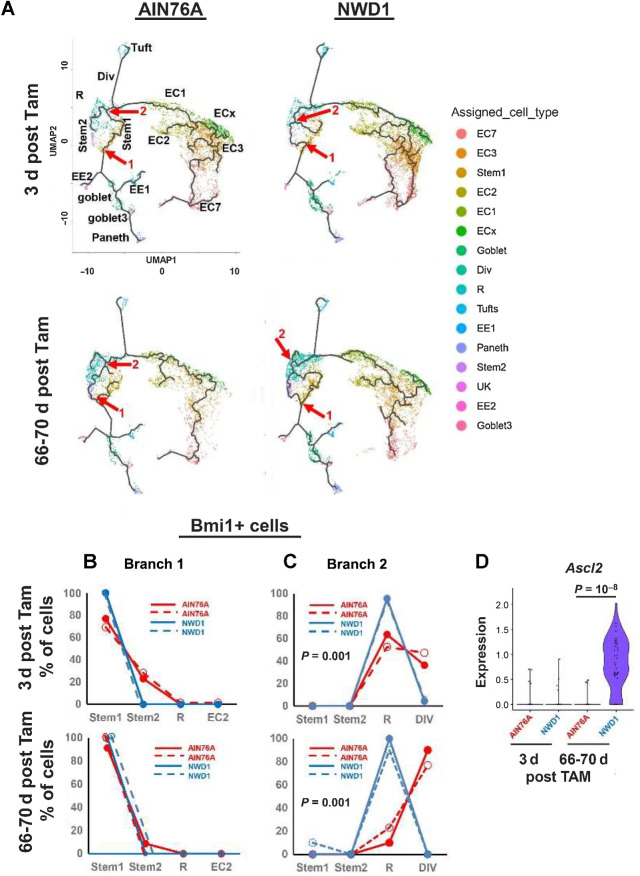
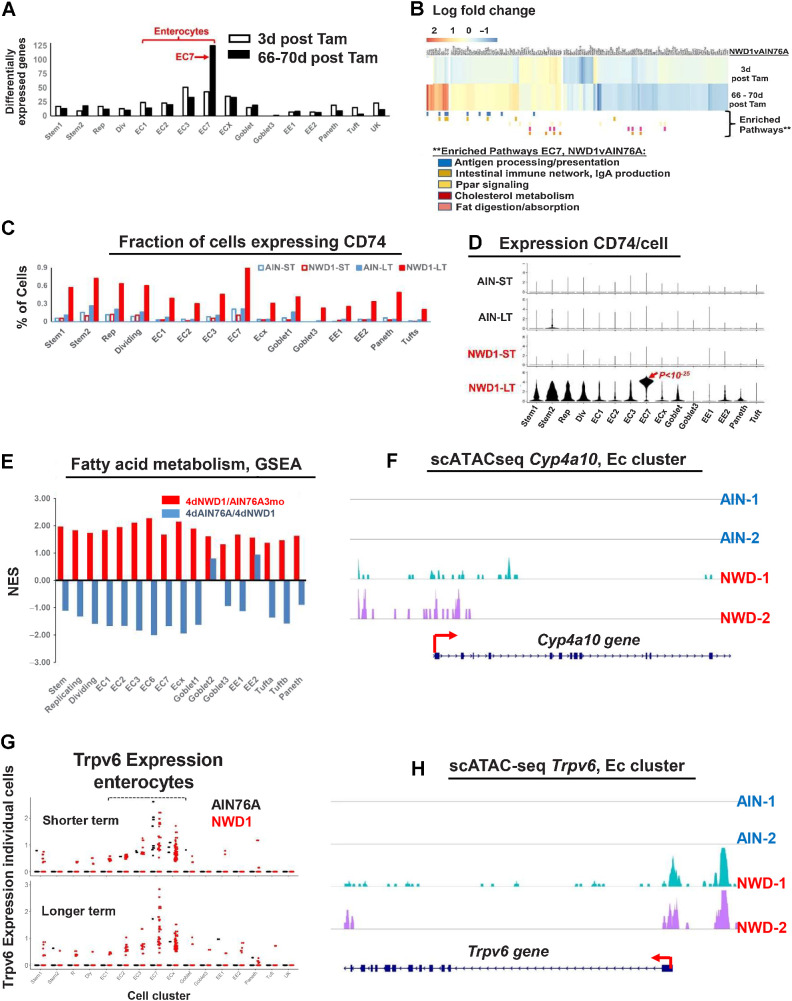
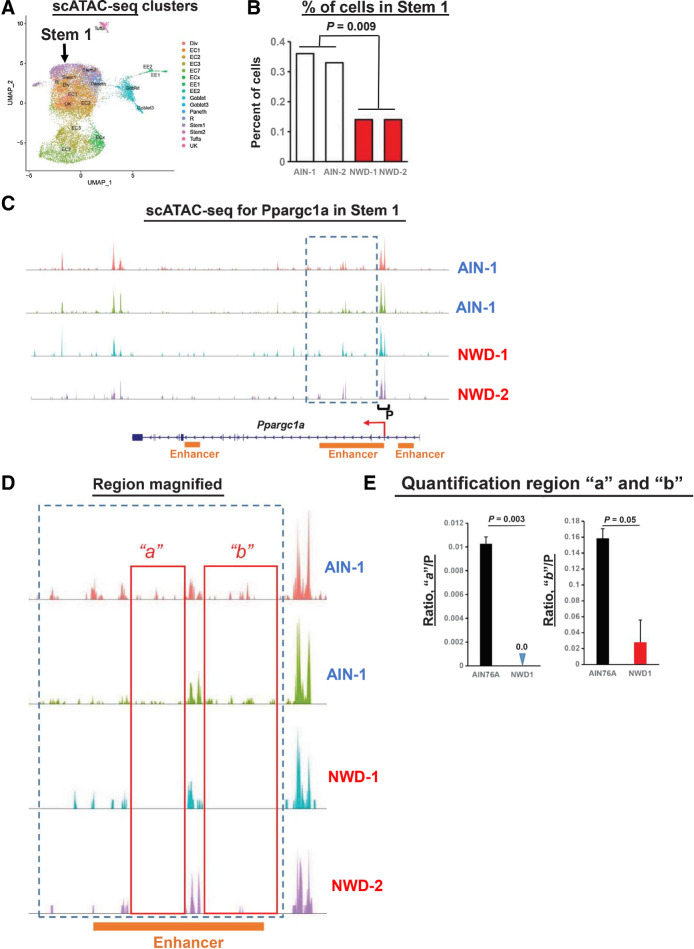
New Western-style diet 1 (NWD1), a purified diet establishing mouse exposure to key nutrients recapitulating levels that increase human risk for intestinal cancer, reproducibly causes mouse sporadic intestinal and colonic tumors reflecting human etiology, incidence, frequency, and lag with developmental age. Complex NWD1 stem cell and lineage reprogramming was deconvolved by bulk and single-cell RNA sequencing, single-cell Assay for Transposase-Accessible Chromatin using sequencing, functional genomics, and imaging. NWD1 extensively, rapidly, and reversibly, reprogrammed Lgr5hi stem cells, epigenetically downregulating Ppargc1a expression, altering mitochondrial structure and function. This suppressed Lgr5hi stem cell functions and developmental maturation of Lgr5hi cell progeny as cells progressed through progenitor cell compartments, recapitulated by Ppargc1a genetic inactivation in Lgr5hi cells in vivo. Mobilized Bmi1+, Ascl2hi cells adapted lineages to the nutritional environment and elevated antigen processing and presentation pathways, especially in mature enterocytes, causing chronic, protumorigenic low-level inflammation. There were multiple parallels between NWD1 remodeling of stem cells and lineages with pathogenic mechanisms in human inflammatory bowel disease, also protumorigenic. Moreover, the shift to alternate stem cells reflects that the balance between Lgr5-positive and -negative stem cells in supporting human colon tumors is determined by environmental influences. Stem cell and lineage plasticity in response to nutrients supports historic concepts of homeostasis as a continual adaptation to environment, with the human mucosa likely in constant flux in response to changing nutrient exposures.

Implications: Although oncogenic mutations provide a competitive advantage to intestinal epithelial cells in clonal expansion, the competition is on a playing field dynamically sculpted by the nutritional environment, influencing which cells dominate in mucosal maintenance and tumorigenesis.


Figures

None
Graphical abstract
Figure 1. Dietary impact on ISCs: A, Lgr5EGFP.cre:ER mice fed AIN76A or NWD1 for 3 or 12 months from weaning, or NWD1 for 3 months then switched to AIN76A for 9 months (cross-over); B–D, Ppargc1a expression by bulk RNA-seq of Lgr5hi cells of two different mouse cohorts fed either NWD1 or AIN76A for 3 months from weaning (B and D), or for NWD1 or AIN76 for 12 months compared with NWD1 for 3 months and then switched to AIN76A for an additional 9 months (C - Arm 3, A). N-3 mice for each group for each cohort. E and F, Pgc1a IHC and quantitation in crypts of mice fed AIN76A or NWD1 for 3 months. N = 3 mice for each group. G, Ppargc1a expression in Lgr5hi and Bmi1+ cells from bulk RNA-seq analysis of mice fed different diets for 3 months. N = 3 mice for each group. H, Examples of mitochondria in WT mice fed AIN76A or NWD1, or mice fed AIN76A and Ppargc1a homozygously inactivated in Lgr5 cells (800X – yellow arrows indicate examples of cristae). I, Quantitation of mitochondrial cristae density in CBC, Paneth, and villus cells, evaluated at 5,000X magnification. N = 3 mice for each group. J, FACs analysis of Lgr5hi cell number. N = 7 mice for each diet group. K, Mitotracker staining of mice fed AIN76A or NWD1 for 3 months. (*, P < 0.05; **, 0.01; ***, 0.001). N = 7 mice for each group. B, C, D, G, and J, Mean ± SD. F and I, Box and whiskers plot. K, Median ± quartiles.
Figure 1.
Dietary impact on ISCs: A,Lgr5EGFP.cre:ER mice fed AIN76A or NWD1 for 3 or 12 months from weaning, or NWD1 for 3 months then switched to AIN76A for 9 months (cross-over); B–D,Ppargc1a expression by bulk RNA-seq of Lgr5hi cells of two different mouse cohorts fed either NWD1 or AIN76A for 3 months from weaning (B and D), or for NWD1 or AIN76 for 12 months compared with NWD1 for 3 months and then switched to AIN76A for an additional 9 months (C - Arm 3, A). N-3 mice for each group for each cohort. E and F, Pgc1a IHC and quantitation in crypts of mice fed AIN76A or NWD1 for 3 months. N = 3 mice for each group. G,Ppargc1a expression in Lgr5hi and Bmi1+ cells from bulk RNA-seq analysis of mice fed different diets for 3 months. N = 3 mice for each group. H, Examples of mitochondria in WT mice fed AIN76A or NWD1, or mice fed AIN76A and Ppargc1a homozygously inactivated in Lgr5 cells (800X – yellow arrows indicate examples of cristae). I, Quantitation of mitochondrial cristae density in CBC, Paneth, and villus cells, evaluated at 5,000X magnification. N = 3 mice for each group. J, FACs analysis of Lgr5hi cell number. N = 7 mice for each diet group. K, Mitotracker staining of mice fed AIN76A or NWD1 for 3 months. (*, P < 0.05; **, 0.01; ***, 0.001). N = 7 mice for each group. B, C, D, G, and J, Mean ± SD. F and I, Box and whiskers plot. K, Median ± quartiles.
Figure 2. Genetic inactivation of Ppargc1a in Lgr5 cells: A, Suppressed lineage tracing from Lgr5hi cells by homozygous inactivation of Ppargc1a in Lgr5cre:er-GFP, Ppargc1aF/+ or −/−, Rosa26tom mice fed AIN76A diet, 3 days after a single TAM injection. B, Quantification of lineage tracing. N = 2 mice for each genetic group. C, Cluster map and cell types (nine scRNA-seq libraries). D, Epithelial cell distribution in clusters/lineages in WT mice or with heterozygous or homozygous Ppargc1a inactivation targeted to Lgr5hi cells; shown are stem cells, Replicating cells (R1, R2), Dividing cells (Div), multiple enterocyte populations (EC), Goblet, Enteroendocrine (EE1, EE2), Paneth and Tuft cells and a minor unknown population that could not be aligned with markers (UK). E–G, Trajectory analysis from scRNA-seq of total intestinal epithelial cells from WT mice or 3 days after heterozygous or homozygous Ppargc1a inactivation: yellow arrow, Stem cell cluster; abbreviations as in C and D. H and I, Cell type distribution at branch point “a” and “b”, respectively (red arrows in E–G) of WT, het and hom inactivation of Ppragc1a and GSEA of pathways of Ppargc1a−/− compared with WT mice at those branch points (numbers are P values). For C–I, N = 3 mice for each genetic group.
Figure 2.
Genetic inactivation of Ppargc1a in Lgr5 cells: A, Suppressed lineage tracing from Lgr5hi cells by homozygous inactivation of Ppargc1a in Lgr5cre:er-GFP, Ppargc1aF/+ or −/−, Rosa26tom mice fed AIN76A diet, 3 days after a single TAM injection. B, Quantification of lineage tracing. N = 2 mice for each genetic group. C, Cluster map and cell types (nine scRNA-seq libraries). D, Epithelial cell distribution in clusters/lineages in WT mice or with heterozygous or homozygous Ppargc1a inactivation targeted to Lgr5hi cells; shown are stem cells, Replicating cells (R1, R2), Dividing cells (Div), multiple enterocyte populations (EC), Goblet, Enteroendocrine (EE1, EE2), Paneth and Tuft cells and a minor unknown population that could not be aligned with markers (UK). E–G, Trajectory analysis from scRNA-seq of total intestinal epithelial cells from WT mice or 3 days after heterozygous or homozygous Ppargc1a inactivation: yellow arrow, Stem cell cluster; abbreviations as in C and D. H and I, Cell type distribution at branch point “a” and “b”, respectively (red arrows in EG) of WT, het and hom inactivation of Ppragc1a and GSEA of pathways of Ppargc1a−/− compared with WT mice at those branch points (numbers are P values). For C–I,N = 3 mice for each genetic group.
Figure 3. Rapid reprogramming of cells by dietary shift: A, Mice fed AIN76A for 3 months (Arm1), switched to NWD1 for 4 days (Arm 2), or then switched back to AIN76A for 4 days (Arm 3), total Epcam+, CD45-negative epithelial cells FACs isolated and analyzed by scRNA-seq. B, Pathways significantly altered by rapid dietary shifts and their negative log P value for significance of pathway change. C, Magnitude of change of each pathway under the different dietary conditions; D, TCA cycle genes repressed by switching mice from AIN76A to NWD1 for 4 days and then elevated when mice switched back to AIN76A control diet for 4 days. E, Altered expression of each gene in the Oxphos pathway by 4-day shift from AIN76A to NWD1, and response of each to subsequent switch back to AIN76A for 4 days. For A–E, N = 3 mice for each arm in A.
Figure 3.
Rapid reprogramming of cells by dietary shift: A, Mice fed AIN76A for 3 months (Arm1), switched to NWD1 for 4 days (Arm 2), or then switched back to AIN76A for 4 days (Arm 3), total Epcam+, CD45-negative epithelial cells FACs isolated and analyzed by scRNA-seq. B, Pathways significantly altered by rapid dietary shifts and their negative log P value for significance of pathway change. C, Magnitude of change of each pathway under the different dietary conditions; D, TCA cycle genes repressed by switching mice from AIN76A to NWD1 for 4 days and then elevated when mice switched back to AIN76A control diet for 4 days. E, Altered expression of each gene in the Oxphos pathway by 4-day shift from AIN76A to NWD1, and response of each to subsequent switch back to AIN76A for 4 days. For A–E,N = 3 mice for each arm in A.
Figure 4. scRNA-seq of Bmi1+ intestinal epithelial cells in response to diet: A, Rosa26tom marked Epcam+, CD45-negative epithelial cells FACs isolated from Bm1cre:er, Rosa26tom mice fed AIN76A or NWD1 for 3 months, then sacrificed at 3 or 66–70 days after TAM injection to activate the Rosatom marker (shorter, longer term, respectively) and analyzed by scRNA-seq (N = 2 for each group). B, Cell trajectory analysis as a function of diet and time after marking by TAM injection: Blue arrows, Ascl2 expressing cells among stem and progenitor cells; or yellow arrows, in goblet and enteroendocrine cells. C and D, Expression of Ascl2 per cell in Stem1, 2, Replicating and Dividing cell clusters: red arrow in D for Stem 2 cells is a population that expressed Ascl2 at a higher level. *** This was highly significant by a likelihood ratio test (P = 0.01), by a negative binomial regression-negative binomial mixed-effect model, with regression and fit using R functions glm.nb and glmer.nb, respectively (84), assuming each cell as independent, and number of Ascl2 reads for each cell as response. Furthermore, Ascl2 expression for NWD1-LT differed significantly from the other three groups (P = 0.002) by post hoc analysis by a similar negative binomial, and the potential that the difference between NWD1-LT and the other groups was random was P = 0.11, tested by a negative binomial mixed-effect model with mice per dietary group treated as random effects, indicating the alternate hypothesis that effects were random is false. E, Ascl2 and Bmi1 expression by ISH in mice fed diets for 3 months: white dotted lines demark the crypt base. For each of the four diet-timepoint groups analyzed in A–D, N = 2 mice per group.
Figure 4.
scRNA-seq of Bmi1+ intestinal epithelial cells in response to diet: A, Rosa26tom marked Epcam+, CD45-negative epithelial cells FACs isolated from Bm1cre:er, Rosa26tom mice fed AIN76A or NWD1 for 3 months, then sacrificed at 3 or 66–70 days after TAM injection to activate the Rosatom marker (shorter, longer term, respectively) and analyzed by scRNA-seq (N = 2 for each group). B, Cell trajectory analysis as a function of diet and time after marking by TAM injection: Blue arrows, Ascl2 expressing cells among stem and progenitor cells; or yellow arrows, in goblet and enteroendocrine cells. C and D, Expression of Ascl2 per cell in Stem1, 2, Replicating and Dividing cell clusters: red arrow in D for Stem 2 cells is a population that expressed Ascl2 at a higher level. *** This was highly significant by a likelihood ratio test (P = 0.01), by a negative binomial regression-negative binomial mixed-effect model, with regression and fit using R functions glm.nb and glmer.nb, respectively (84), assuming each cell as independent, and number of Ascl2 reads for each cell as response. Furthermore, Ascl2 expression for NWD1-LT differed significantly from the other three groups (P = 0.002) by post hoc analysis by a similar negative binomial, and the potential that the difference between NWD1-LT and the other groups was random was P = 0.11, tested by a negative binomial mixed-effect model with mice per dietary group treated as random effects, indicating the alternate hypothesis that effects were random is false. E,Ascl2 and Bmi1 expression by ISH in mice fed diets for 3 months: white dotted lines demark the crypt base. For each of the four diet-timepoint groups analyzed in A–D,N = 2 mice per group.
Figure 5. A, Trajectory analysis of Bmi1+ marked cells at 3 or 66–70 days after Tam activation of the Bmi1 marker, annotated with individual cell types: red arrows/numbers denote branch points analyzed. Cell types identified are stem cells, Replicating cells (R1, R2), Dividing cells (Div), multiple enterocyte populations (EC), Goblet, Enteroendocrine cells (EE1, EE2), Tuft and Paneth cells. B and C, Cell type distribution at branch points “1” and “2” (red arrows in A), D, Ascl2 expression per cell at branch point 2. For each of the four diet-timepoint groups analyzed in A–D, N = 2 mice per group.
Figure 5.
A, Trajectory analysis of Bmi1+ marked cells at 3 or 66–70 days after Tam activation of the Bmi1 marker, annotated with individual cell types: red arrows/numbers denote branch points analyzed. Cell types identified are stem cells, Replicating cells (R1, R2), Dividing cells (Div), multiple enterocyte populations (EC), Goblet, Enteroendocrine cells (EE1, EE2), Tuft and Paneth cells. B and C, Cell type distribution at branch points “1” and “2” (red arrows in A), D,Ascl2 expression per cell at branch point 2. For each of the four diet-timepoint groups analyzed in A–D,N = 2 mice per group.
Figure 6. NWD1 reprogramming and adaptation of cells: A, number of differentially expressed genes (>50% and P = 0.01) in Bmi1 cell clusters of Supplementary Fig. S6B. B, Heatmap of genes differentially expressed by diet in EC7 cells and cell pathways enriched (GSEA) as a function of diet in Bmi1+ EC7 cells longer term after marking of Bmi1+ cells (statistical analysis in text). C, Fraction of cells in each cluster expressing CD74. D, CD74 expression per cell, in each cell cluster as a function of diet and time after marking of Bmi1+ cells. E, GSEA for each cell cluster for the fatty acid metabolism pathway in the rapid dietary cross-over experiment (Fig. 3A)—red bars, pathway change in mice fed AIN76A for 3 months, then switched to NWD1 for 4 days before sacrifice; blue bars, the mice then switched back to AIN76A for 4 more days. F, scATAC-seq data for Cyp4a10 in enterocytes. G, scRNA-seq data for Trpv6 Bmi1+ derived cells from AIN and NWD1 fed mice 3 days or 66–70 days after cells were marked (Fig. 4A). H, scATAC-seq data for Trpv6 in enterocytes for mice fed either AIN76A or NWD1 for 4 months from weaning. For each of the diet-time point groups analyzed in A–D, F, and H, N = 2 mice for each diet-time point group; for E, N = 3 mice per group.
Figure 6.
NWD1 reprogramming and adaptation of cells: A, number of differentially expressed genes (>50% and P = 0.01) in Bmi1 cell clusters of Supplementary Fig. S6B. B, Heatmap of genes differentially expressed by diet in EC7 cells and cell pathways enriched (GSEA) as a function of diet in Bmi1+ EC7 cells longer term after marking of Bmi1+ cells (statistical analysis in text). C, Fraction of cells in each cluster expressing CD74. D, CD74 expression per cell, in each cell cluster as a function of diet and time after marking of Bmi1+ cells. E, GSEA for each cell cluster for the fatty acid metabolism pathway in the rapid dietary cross-over experiment (Fig. 3A)—red bars, pathway change in mice fed AIN76A for 3 months, then switched to NWD1 for 4 days before sacrifice; blue bars, the mice then switched back to AIN76A for 4 more days. F, scATAC-seq data for Cyp4a10 in enterocytes. G, scRNA-seq data for Trpv6 Bmi1+ derived cells from AIN and NWD1 fed mice 3 days or 66–70 days after cells were marked (Fig. 4A). H, scATAC-seq data for Trpv6 in enterocytes for mice fed either AIN76A or NWD1 for 4 months from weaning. For each of the diet-time point groups analyzed in A–D, F, and H,N = 2 mice for each diet-time point group; for E,N = 3 mice per group.
Figure 7. scATAC-seq data, stem cells: A, Clusters from the scATAC-seq data. B, Per cent Stem 1 cells in mice fed AIN76A or NWD1 based on the scATAC-seq data. C, scATAC-seq data for the Ppargc1a gene in the Stem 1 cluster. Box delineates region of diminished peaks in NWD1 compared with AIN76A fed mice, and P denotes the promoter region. D, Boxed region in C expanded, with “a” and “b” denoting areas within this region where peaks in AIN fed mice are substantially diminished in NWD1 fed mice. E, Quantification of reads in regions a and b relative to reads at the promotor for mice fed the different diets; statistical analysis by a Poisson regression on aggregated read counts over all cells per mouse, normalized by coverage per sample in the promoter region of Ppargc1a. E, Mean ± SD. For A–E, N = 2 mice for each dietary group.
Figure 7.
scATAC-seq data, stem cells: A, Clusters from the scATAC-seq data. B, Per cent Stem 1 cells in mice fed AIN76A or NWD1 based on the scATAC-seq data. C, scATAC-seq data for the Ppargc1a gene in the Stem 1 cluster. Box delineates region of diminished peaks in NWD1 compared with AIN76A fed mice, and P denotes the promoter region. D, Boxed region in C expanded, with “a” and “b” denoting areas within this region where peaks in AIN fed mice are substantially diminished in NWD1 fed mice. E, Quantification of reads in regions a and b relative to reads at the promotor for mice fed the different diets; statistical analysis by a Poisson regression on aggregated read counts over all cells per mouse, normalized by coverage per sample in the promoter region of Ppargc1a. E, Mean ± SD. For A–E,N = 2 mice for each dietary group.

Comment in

  • 1541-7786. doi: 10.1158/1541-7786.MCR-21-8-HI

Similar articles

Cited by

References

    1. Shivdasani RA. Race to the bottom: darwinian competition in early intestinal tumorigenesis. Cell Stem Cell 2021;28:1340–2. - PubMed
    1. Murata K, Jadhav U, Madha S, van Es J, Dean J, Cavazza A, et al. . Ascl2-dependent cell dedifferentiation drives regeneration of ablated intestinal stem cells. Cell Stem Cell 2020;26:377–90. - PMC - PubMed
    1. Davies KJ. Adaptive homeostasis. Mol Aspects Med 2016;49:1–7. - PMC - PubMed
    1. Li W, Peregrina K, Houston M, Augenlicht LH. Vitamin D and the nutritional environment in functions of intestinal stem cells: implications for tumorigenesis and prevention. J Steroid Biochem Mol Biol 2019;198:105556. - PMC - PubMed
    1. Augenlicht LH. Environmental impact on intestinal stem cell functions in mucosal homeostasis and tumorigenesis. J Cell Biochem 2017;118:943–52. - PMC - PubMed

Publication types