. 2023 Jul 3;222(7):e202203060.
doi: 10.1083/jcb.202203060. Epub 2023 Apr 24.

Reticulons promote formation of ER-derived double-membrane vesicles that facilitate SARS-CoV-2 replication

Affiliations

Reticulons promote formation of ER-derived double-membrane vesicles that facilitate SARS-CoV-2 replication

Jeffrey M Williams et al. J Cell Biol. .

Abstract

Severe acute respiratory syndrome coronavirus-2 (SARS-CoV-2), the etiologic agent for the global COVID-19 pandemic, triggers the formation of endoplasmic reticulum (ER)-derived replication organelles, including double-membrane vesicles (DMVs), in the host cell to support viral replication. Here, we clarify how SARS-CoV-2 hijacks host factors to construct the DMVs. We show that the ER morphogenic proteins reticulon-3 (RTN3) and RTN4 help drive DMV formation, enabling viral replication, which leads to productive infection. Different SARS-CoV-2 variants, including the delta variant, use the RTN-dependent pathway to promote infection. Mechanistically, our results reveal that the membrane-embedded reticulon homology domain (RHD) of the RTNs is sufficient to functionally support viral replication and physically engage NSP3 and NSP4, two viral non-structural membrane proteins known to induce DMV formation. Our findings thus identify the ER morphogenic RTN3 and RTN4 membrane proteins as host factors that help promote the biogenesis of SARS-CoV-2-induced DMVs, which can act as viral replication platforms.


Conflict of interest statement

Disclosures: The authors declare no competing interests exist.

Figures
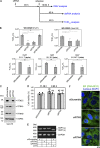
Figure S1.
Figure S1.
(Related to Fig. 1). Depletion of RTN3 or RTN4 does not compromise overall cellular integrity. (A) A working scheme outlining key experiments performed in this manuscript. Briefly, Huh7 or Vero E6 cells were transfected with the indicated siRNAs for 48 h followed by infection for the indicated times before the specific investigation (e.g., DMV, dsRNA, or TCID50/ml analysis) was performed. (B) Graphs from Fig. 1, B–D with the y-axis in log-scale. (C) siRNA KD of RTN3 or RTN4 in Vero E6 cells. Cell extracts derived from Vero E6 cells transfected with the indicated siRNAs were subjected to SDS-PAGE and immunoblotting with the indicated antibodies. (D) Huh7 cells were transfected with the indicated siRNAs for 48 or 96 h then subjected to the MTS assay to measure cell viability. Graph represents the percent absorbance relative to control cells for each time point. Data are represented as the mean values and error bars represent means ± SD from three biological replicates. (E) Huh7 cells were transfected with the indicated siRNAs for 48 h and treated with or without DTT for 2 h. The splicing of Xbp1 was analyzed by PCR. S indicates spliced XBP1 (ER stress), while U indicates unspliced XBP1 (no ER stress). Primers for GAPDH were analyzed by PCR and serves as the loading control. (F) Huh7 cells treated with the indicated siRNAs for 48 h were fixed, permeabilized, stained with anti-DNAJB12 (ER marker) and DAPI, and analyzed by confocal microscopy. NS, not significant where only P < 0.05 was considered to be significant. Source data are available for this figure: SourceData FS1.
Figure 1.
Figure 1.
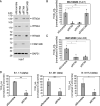
SARS-CoV-2 exploits RTN3 and RTN4 to support SARS-CoV-2 infection. (A) siRNA KD of RTN3, RTN4, or FAM134B. Cell extracts derived from Huh7 cells transfected with the indicated siRNA were subjected to SDS-PAGE and immunoblotting with the indicated antibodies. (B) Huh7 cells transfected with the indicated siRNAs were infected with SARS-CoV-2 WA1. 48 h after infection, Huh7 media containing the secreted virus was serially diluted onto a 96-well plate of Vero E6 cells. After 48 h, each well was scored for the cytopathic effect (CPE), and the TCID50/ml was determined. The graph represents TCID50/ml relative to control (scrambled siRNA-treated) cells. Error bars represent means ± SD from three biological replicates. (C) Vero E6 cells transfected with the indicated siRNAs were infected with SARS-CoV-2 WA1 for 48 h, and the TCID50/ml was determined as in B. Error bars represent means ± SD from three biological replicates. (D) Huh7 cells were transfected with the scrambled or RTN3 siRNA and infected with SARS-CoV-2 alpha (B.1.1.7, left panel), beta (B1.351, center panel), and delta (B1.617.2, right panel) variants and the TCID50/ml was determined as in B. Graphs represent the TCID50/ml relative to control (scrambled siRNA-treated) cells. Error bars represent means ± SD from three biological replicates per variant. (B–D) Huh7 cells were infected at 2 MOI with the indicated variants. Results were analyzed using Student’s two-tailed t test. Data are represented as the mean values, where indicated. The P values are indicated by *P < 0.05, ***P < 0.001. Source data are available for this figure: SourceData F1.
Figure 2.
Figure 2.
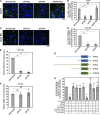
RTN3 and RTN4 are required for efficient SARS-CoV-2 genome replication. (A) Huh7 cells were transfected with the indicated siRNAs, infected with SARS-Cov-2 WA1 (2 MOI) for 48 h, and then processed for epifluorescence microscopy. Anti-dsRNA (j2) was stained in green and DAPI in blue. Scale bars, 10 µm. (B) Quantification of the percentage of cells positive for dsRNA relative to control (scrambled siRNA-treated) cells for Huh7 cells in A. >100 cells were counted for each condition. Error bars represent means ± SD from three biological replicates. (C) Vero E6 cells were transfected with the indicated siRNAs, infected with SARS-CoV-2 WA1 for 48 h at (2 MOI), and then processed for epifluorescence microscopy. Anti-dsRNA (j2) was stained in green and DAPI in blue. Scale bars, 10 µm. (D) Quantification of the percentage of cells positive for dsRNA relative to control (scrambled siRNA-treated) cells for Vero E6 cells in C. >100 cells were counted for each condition. Error bars represent means ± SD from three biological replicates. (E) Huh7 cells were transfected with the indicated siRNAs, infected with SARS-CoV-2 WA1 for 48 h at 2 MOI, and the total RNA was isolated. RT-qPCR was subsequently performed using primers against Orf1a of SARS-CoV-2. Graph represents relative viral genome levels compared to control (scrambled siRNA-treated) cells. Error bars represent means ± SD from three biological replicates. (F) Huh7 cells were transfected with the indicated siRNAs, infected with SARS-CoV-2 WA1 for 4 h at 5 MOI, and the total RNA was isolated. RT-qPCR was subsequently performed as in E. Graph represents relative viral genome levels compared to control (scrambled siRNA-treated) cells. Error bars represent means ± SD from three biological replicates. (G) Schematic of the indicated RTN isoforms used to rescue the RTN3 or RTN4 KD cells. (H) Huh7 cells were transfected with the indicated siRNAs for 24 h and then transfected with the indicated DNA constructs for 24 h. Cells were then infected and processed as in A and quantified as in B. Error bars represent means ± SD from three biological replicates. Results were analyzed using Student’s two-tailed t test. Data are represented as the mean values where indicated. The P values are indicated by ***P < 0.001. NS, not significant where only P < 0.05 was considered to be significant.
Figure 3.
Figure 3.
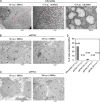
RTN3 and RTN4 are necessary for DMV formation. (A–C) Huh7 cells were transfected with the indicated siRNAs and infected with SARS-CoV-2 WA1 for either 12 h or 24 h at 2 MOI. Cells were fixed with glutaraldehyde and processed for conventional TEM. Representative images are shown for each condition where the magnification level is indicated above each image. N denotes the nucleus. (A) Representative TEM images showing a peri-nuclear patch of SARS-CoV-2-induced DMVs (left and center). The magnification was increased to clearly reveal the double membrane structures (right). Scale bars (left to right), 4 µm, 1 µm, 200 nm. (B and C) Representative TEM images from cells depleted of RTN3 (B) or RTN4 (C). Scale bars, 4 µm. (D) Quantification indicating the percentage of cells containing DMVs relative to total cells counted for each condition. N indicates the number of cells counted for that condition.
Figure S2.
Figure S2.
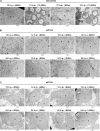
(Related to Fig. 3). RTN3 and RTN4 are necessary for DMV formation. (A–C) Additional representative images corresponding to those in Fig. 3. Huh7 cells were treated with the indicated siRNAs and infected with SARS-CoV-2 WA1 at 2 MOI. Scale bars, 4 µm, 200 nm where indicated. (A) While patches of peri-nuclear DMVs are evident in control cells (shown at 800× and magnified to 10,000×, where red dots indicate a viral DMV), the DMVs are absent in RTN3 KD (B) and RTN4 KD (C) cells.
Figure S3.
Figure S3.
(Related to Fig. 3). ER morphology in control and RTN-depleted cells. Representative images from Fig. 3 with the ER highlighted in pink. The images show that the global ER morphology was largely unperturbed under the conditions of RTN depletion when compared to control cells. Huh7 cells were transfected with the indicated siRNAs and infected with SARS-CoV-2 WA1 for 12 h at 2 MOI. Cells were fixed with glutaraldehyde and processed for TEM analysis. The ER was highlighted in pink by using Photoshop. N denotes the nucleus. The top images represent 800× magnification, while the bottom images are zoomed-in sections from the blue boxes in the corresponding images above. Scale bars, 4 µm.
Figure S4.
Figure S4.
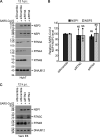
(Related to Fig. 3). Level of NSP1 and NSP3 in control and RTN-depleted cells. (A) Huh7 cells were transfected with the indicated siRNAs and then infected (where indicated) with SARS-CoV-2 WA1 at 5 MOI for 12 h and then lysed. The resulting cell extracts were subjected to SDS-PAGE and immunoblotting with the indicated antibodies. (B) Quantification of the NSP1 and NSP3 levels relative to control cells in A. Error bars represent means ± SD from three biological replicates. NS, not significant where only P < 0.05 was considered to be significant. (C) Vero E6 cells were transfected with the indicated siRNAs and then infected (where indicated) with SARS-CoV-2 WA1 at 5 MOI for 12 h and then lysed. The resulting cell extracts were subjected to SDS-PAGE and immunoblotting with the indicated antibodies. Source data are available for this figure: SourceData FS4.
Figure 4.
Figure 4.
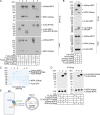
RTN3 and RTN4 bind to NSP3 and NSP4. (A and B) HEK 293T cells were transfected with the indicated DNA constructs for 24 h, and the resulting cell extracts were immunoprecipitated (IP) with anti-FLAG (A) or anti-HA (B). The precipitated material was subjected to SDS-PAGE and immunoblotting with the indicated antibodies. Input represents 5% of the total sample used for the IP. * denotes a non-specific unidentified protein. (C) FLAG-GFP (lane 1), FLAG-RTN3A (lane 2), FLAG-GFP-RTN4A (lane 3), NSP4-2xStrep (lane 4), and 2xStrep-NSP3 (lane 5) constructs were transfected in HEK293T cells, isolated, and subjected to Coomassie staining. (D) Lanes 1–3: 2xStrep-NSP3 was incubated with FLAG-GFP, FLAG-RTN3A, or FLAG-GFP-RTN4A, and the samples subjected to anti-Strep immunoprecipitation. The precipitated material was further subjected to SDS-PAGE followed by immunoblotting with the indicated antibodies. Lanes 4–6: As in lanes 1–3, except NSP4-2xStrep was used instead of 2xStrep-NSP3. (E) Schematic summarizing the key finding that the RTN3 and RTN4 ER membrane proteins, which bind to the viral non-structural proteins NSP3 and NSP4, help to promote the formation of the ER-derived DMV structures that participate in SARS-CoV-2 genome replication. Source data are available for this figure: SourceData F4.

Comment in

Similar articles

Cited by

References

    1. Al-Mulla, H.M., Turrell L., Smith N.M., Payne L., Baliji S., Züst R., Thiel V., Baker S.C., Siddell S.G., and Neuman B.W.. 2014. Competitive fitness in coronaviruses is not correlated with size or number of double-membrane vesicles under reduced-temperature growth conditions. MBio. 5:e01107–e01113. 10.1128/mBio.01107-13 - DOI - PMC - PubMed
    1. Angelini, M.M., Akhlaghpour M., Neuman B.W., and Buchmeier M.J.. 2013. Severe acute respiratory syndrome coronavirus nonstructural proteins 3, 4, and 6 induce double-membrane vesicles. MBio. 4:4. 10.1128/mBio.00524-13 - DOI - PMC - PubMed
    1. Chen, Y.J., Bagchi P., and Tsai B.. 2020a. ER functions are exploited by viruses to support distinct stages of their life cycle. Biochem. Soc. Trans. 48:2173–2184. 10.1042/BST20200395 - DOI - PMC - PubMed
    1. Chen, Y.J., Williams J.M., Arvan P., and Tsai B.. 2020b. Reticulon protects the integrity of the ER membrane during ER escape of large macromolecular protein complexes. J. Cell Biol. 219:e201908182. 10.1083/jcb.201908182 - DOI - PMC - PubMed
    1. Chen, Y.J., Knupp J., Arunagiri A., Haataja L., Arvan P., and Tsai B.. 2021. PGRMC1 acts as a size-selective cargo receptor to drive ER-phagic clearance of mutant prohormones. Nat. Commun. 12:5991. 10.1038/s41467-021-26225-8 - DOI - PMC - PubMed

Publication types

Supplementary concepts