. 2023 Sep-Oct;25(7):105141.
doi: 10.1016/j.micinf.2023.105141. Epub 2023 Apr 19.

Controlling viral inflammatory lesions by inhibiting fatty acid metabolism

Affiliations

Controlling viral inflammatory lesions by inhibiting fatty acid metabolism

Engin Berber et al. Microbes Infect. 2023 Sep-Oct.

Abstract

Herpes simplex virus infection is a major cause of vision loss in humans. Eye damaging consequences are often driven by inflammatory cells as a result of an immune response to the virus. In the present report, we have compared the effect of inhibiting energy metabolism with etomoxir (Etox), which acts on the fatty acid oxidation pathway and 2-Deoxy-d-glucose (2DG), which acts on glycolysis for their inhibitory effects on herpetic ocular lesions. Both drugs showed similar protective effects when therapy was started on the day of infection, but some 2DG recipients succumbed to encephalitis. In contrast, all Etox recipients remained healthy. Both drugs were compared for effects on inflammatory reactions in the trigeminal ganglion (TG), where virus replicates and then establishes latency. Results indicate that 2DG significantly reduced CD8 and CD4 Th1 T cells in the TG, whereas Etox had minimal or no effect on such cells, perhaps explaining why encephalitis occurred only in 2DG recipients. Unlike treatment with 2DG, Etox therapy was largely ineffective when started at the time of lesion expression. Reasons for the differential effects were discussed as was the relevance of combining metabolic reprogramming approaches to combat viral inflammatory lesions.

Keywords: 2DG; Etomoxir; FAO; HSV; Immunometabolism; Immunopathogenesis.


Conflict of interest statement

Declaration of competing interest There is no competing interest exist.

Figures

Fig. 1.
Fig. 1.
Comparison of ocular HSV disease survival and lesion severity. C57BL/6 mice (n=8) were infected with HSV-1 RE (3×10⁴PFU) and treated daily with Etox (15 mg/kg) or 2DG (250 mg/kg). Controls received PBS only. Fig. 1A shows the percentage of survival and log-rank (Mantel-Cox) test results. Fig.1B shows the extent of angiogenesis and Fig. 1C the severity of SK recorded on 14 days pi. Studies were performed three times and data collected from two independent studies. To compare eye lesions in treated and untreated groups, one-way ANOVA performed with the mean SD. The level of significance was represented as follows; *p<0.05.
Fig. 2.
Fig. 2.
Comparison of proinflammatory innate cell responses in the corneas at 14 days pi in Etox and 2DG treated and control animals that showed ocular lesions (2+ or greater). Fig. 2A shows total leukocytes (CD45), Fig. 2B shows neutrophil cell numbers (CD45, CD11b, CDLy6G) and Fig. 2C shows macrophage cell numbers (CD45, CD11b, F4/80). Fig. 2D shows flow plots representing the average cell frequencies from PBS, Etox and 2DG-treated animals. Studies were performed three times and data represent two independent studies (n=7 for PBS, n=4 for Etox, n=3 for 2DG). To compare the effects of two drugs, one-way ANOVA test was performed with the mean SD. The levels of significance as follows; **p<0.01, ***p<0.001, ****p<0.0001. SSC-A, side scatter A.
Fig. 3.
Fig. 3.
Comparison of T cell responses in the corneas of surviving mice on day 14 pi in Etox and 2DG treated and controls with positive ocular lesions (2+ or greater). Cells were isolated and stimulated with PMA/Iono for intracellular cytokine expression. Fig. 3A shows total CD4 T cell numbers, Fig. 3B shows Th1 cell numbers (CD4, IFNγ), Fig. 3C shows Th17 cell numbers (CD4, IL-17A), Fig. 3D shows Treg cell numbers (CD4, Foxp3). Fig. 3E shows flow plots representing the average cell frequencies from PBS, Etox and 2DG-treated animals. Studies were performed three times and data represent of two independent studies (n=7 for PBS, n=4 for Etox, n=3 for 2DG). To compare the effects of two drugs, one-way ANOVA test was performed with the mean SD. The level of significance as follows; *p<0.05. SSC-A, side scatter A.
Fig. 4.
Fig. 4.
Comparison of innate cell responses in the TGs of surviving mice on day 14 pi in Etox and 2DG treated and controls (2+ or greater eye lesions). Fig. 4A shows total leukocytes (CD45), Fig. 4B shows neutrophils (CD45, CD11b, CDLy6G) and Fig. 4C shows macrophages (CD45, CD11b, F4/80). Fig. 4D shows flow plots representing the average cell frequencies from PBS, Etox and 2DG-treated animals. Studies were performed three times and data represent of two independent studies (n=7 for PBS, n=4 for Etox, n=3 for 2DG). To compare the effects of two drugs, one-way ANOVA test was performed with the mean SD. The level of significance as follows *p<0.05. SSC-A, side scatter A.
Fig. 5.
Fig. 5.
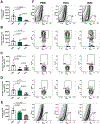
Comparison of T cell responses in the TGs of surviving mice on day 14 pi in Etox and 2DG treated animals and controls (2+ or greater eye lesions). Cells were isolated and stimulated with PMA/Iono for intracellular cytokine expression. Fig. 5A shows total CD4 T cell numbers, Fig. 5B shows Th1 cell numbers (CD4, IFNγ). Fig. 5C shows Th17 cell numbers (CD4, IL-17A). Fig. 5D shows Treg cell numbers (CD4, Foxp3). Fig. 5E shows total CD8 T cell numbers in treated and PBS controls. Fig. 5F flow plots representing the average cell frequencies from PBS, Etox and 2DG-treated animals. Studies were performed three times and data represent of two independent studies (n=7 for PBS, n=4 for Etox, n=3 for 2DG). To compare the effects of two drugs, one-way ANOVA test was performed with the mean SD. The level of significance as follows; *p<0.05, **p<0.01. SSC-A, side scatter A.
Fig. 6.
Fig. 6.
Therapeutic effects of Etox on ocular HSV disease severity and proinflammatory immune response in treated and untreated animals on day 14 pi. C57BL/6 mice (n=8) infected with HSV-1 RE (3×10⁴PFU) and treated daily with Etox (15 mg/kg) starting from day 6 PI. Controls received PBS only (n=8). Fig. 6A shows angiogenesis and Fig. 6B shows SK. Studies were performed three times and data collected from two independent studies. Fig. 6C shows total leukocyte cell numbers (CD45). Fig. 6D shows neutrophil (CD45, CD11b, CDLy6G) cell numbers and Fig. 6E shows macrophage (CD45, CD11b, F4/80) cell numbers. One half of the cornea samples were stimulated with PMA/Iono for intracellular cytokine expression. Fig. 6F shows total CD4 T cell numbers. Fig. 6G shows Th1 (CD4, IFNγ) cell numbers and Fig. 6H shows Th17 (CD4, IL-17A) cell numbers. Studies were performed three times and data represent of two independent studies (n=5 for PBS, n=3 for Etox). To compare eye lesions and proinflammatory response in treated and untreated groups, Mann-Whitney test was performed with the mean SD. The level of significance as follows; *p<0.05. SSC-A.

Similar articles

Cited by

References

    1. Pålsson-McDermott EM, O’Neill LAJ. Targeting immunometabolism as an anti-inflammatory strategy. Cell Res 2020;30:300–14. - PMC - PubMed
    1. McGettrick AF, O’Neill LAJ. How metabolism generates signals during innate immunity and inflammation. J Biol Chem 2013;288:22893–8. - PMC - PubMed
    1. Zhang D, Li J, Wang F, Hu J, Wang S, Sun Y. 2-Deoxy-D-glucose targeting of glucose metabolism in cancer cells as a potential therapy. Cancer Lett 2014;355:176–83. - PubMed
    1. Varanasi SK, Donohoe D, Jaggi U, Rouse BT. Manipulating Glucose Metabolism during Different Stages of Viral Pathogenesis Can Have either Detrimental or Beneficial Effects. J Immunol 2017;199:1748–61. - PMC - PubMed
    1. Berber E, Sumbria D, Newkirk KM, Rouse BT. Inhibiting glucose metabolism results in herpes simplex encephalitis. J Immunol 2021;207:1824–35. - PMC - PubMed

Publication types