. 2023 May 26;224(2):iyad073.
doi: 10.1093/genetics/iyad073.

Expression of retrotransposons contributes to aging in Drosophila

Affiliations

Expression of retrotransposons contributes to aging in Drosophila

Blair K Schneider et al. Genetics. .

Abstract

Retrotransposons are a class of transposable elements capable of self-replication and insertion into new genomic locations. Across species, the mobilization of retrotransposons in somatic cells has been suggested to contribute to the cell and tissue functional decline that occurs during aging. Retrotransposons are broadly expressed across cell types, and de novo insertions have been observed to correlate with tumorigenesis. However, the extent to which new retrotransposon insertions occur during normal aging and their effect on cellular and animal function remains understudied. Here, we use a single nucleus whole genome sequencing approach in Drosophila to directly test whether transposon insertions increase with age in somatic cells. Analyses of nuclei from thoraces and indirect flight muscles using a newly developed pipeline, Retrofind, revealed no significant increase in the number of transposon insertions with age. Despite this, reducing the expression of two different retrotransposons, 412 and Roo, extended lifespan, but did not alter indicators of health such as stress resistance. This suggests a key role for transposon expression and not insertion in regulating longevity. Transcriptomic analyses revealed similar changes to gene expression in 412 and Roo knockdown flies and highlighted changes to genes involved in proteolysis and immune function as potential contributors to the observed changes in longevity. Combined, our data show a clear link between retrotransposon expression and aging.

Keywords: 412; Retrofind; Roo; aging; lifespan extension; retrotransposon.


Conflict of interest statement

Conflicts of interest J.V. is a co-founder of Singulomics Inc., and MutaGentech Inc. The other authors declare no conflict of interest.

Figures

Fig. 1.
Fig. 1.
Single cell WGS of young (day 5) and old (day 50) Drosophila thoraces. a) A schematic of the workflow of the isolation of single nuclei and how new TE insertions were detected. The typical w1118 wild type strain lifespan is also displayed. Flies in this image were created with BioRender.com b) The number of new TE insertions in the w1118 strain from the bulk WGS in comparison to the sequenced reference strain (dm6) using both the pipeline from Siudeja et al (Siudeja et al. 2021) and Retrofind. Five hundred five insertions were called by both pipelines, which we deem high confidence insertions. This was created using (Oliveros 2007–2015). c) The distribution of the genomic locations where the high confidence w1118 strain TE insertions fall. d) The number of known TE insertions (strain/background insertions) that were able to be detected within each nuclear sample represented as a percentage of the insertions detected in the sample out of total strain insertions. Each dot represents a nucleus. e) The number of nuclei with new TE insertions represented as a stacked bar graph comparing young and old samples. No new insertions (black), 1 new insertion (gray), 2 new insertions (light gray). New insertions are defined as insertions not previously called within the strain or other nuclei. Unpaired t-test. ns P = 0.1809. f) The distribution of genomic locations where the 15 new TE insertions within individual nuclei fall.
Fig. 2.
Fig. 2.
Single cell WGS of young (day 5) and old (day 60) Drosophila IFMs. a) A schematic of the workflow of the isolation of single nuclei and how new TE insertions were detected from IFMs. Flies in this image were created with BioRender.com. b) The number of nuclei with new TE insertions represented as a stacked bar graph comparing young and old samples. No new insertions (black), 1 new insertion (gray), 2 new insertions (light gray), 3 new insertions (white), 4 new insertions (tan). New insertions are defined as insertions not previously called within the strain or other nuclei. Unpaired t-test. ns P > 0.9999. c) The distribution of genomic locations where the new TE insertions within individual IFM nuclei fall.
Fig. 3.
Fig. 3.
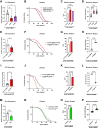
Lifespan of ubiquitous shRNA and CRISPRi knockdown and CRISPRa overexpression of the retrotransposons, 412 and Roo. a) qPCR using SYBR green showing levels of 412 mRNA relative to Rp49 (Rpl32) from adult flies expressing a control shRNA transgene under the control of Act5C-Gal4 compared to the 412 shRNA knockdowns (Act5C > shRNA). The experiment was performed in five biological replicates. An unpaired t-test with Bonferroni correction was used. (412#1) **P = 0.0018. (412#2) *P = 0.0219. b) Survival of the 412 shRNA lines compared to control shRNA driven ubiquitously by Act5C (Act > shRNA). Dunnett test. ****P < 0.0001. c) Median lifespan of the 412 shRNAs compared to control shRNA driven ubiquitously by Act5C (Act > shRNA). Gehan–Breslow–Wilcoxon test. ****P < 0.0001. d) Maximum lifespan of the 412 shRNAs compared to control shRNA driven ubiquitously by Act5C (Act > shRNA). Permutation test (95th percentile/top 5%) followed by two-sided t-test with correction for multiple comparisons. (412#1) ****P < 0.0001. (412#2) ***P = 0.0001. e) qPCR using SYBR green of 412gRNA CRISPRi compared to the control gRNA control (Act5C > dcas9-KRAB) relative to Rp49 (Rpl32). The experiment was performed in five biological replicates. An unpaired t-test with Bonferroni correction was used. *P = 0.0269. f) Survival of the CRISPRi driven ubiquitously by Act5C (Act > dcas9KRAB) with the 412gRNA compared to control gRNA. Dunnett test. ****P < 0.0001. g) Median lifespan of the CRISPRi driven ubiquitously by Act5C (Act > dcas9KRAB) with the 412gRNA compared to control gRNA. Gehan–Breslow–Wilcoxon test. ****P < 0.0001. h) Maximum lifespan of the CRISPRi driven ubiquitously by Act5C (Act > dcas9KRAB) with the 412gRNA compared to control gRNA. Permutation test (95th percentile) followed by two-sided t-test with correction for multiple comparisons. ****P < 0.0001. i) qPCR using SYBR green of 412gRNA CRISPRa compared to the control gRNA control (Act5C > dcas9-VPR) relative to Rp49 (Rpl32). The experiment was performed in five biological replicates. An unpaired t-test with Bonferroni correction was used. *P = 0.0400. j) Survival of the CRISPRa driven ubiquitously by Act5C (Act > dcas9VPR) with the 412gRNA compared to control gRNA. Dunnett test. ****P < 0.0001. k) Median lifespan of the CRISPRa driven ubiquitously by Act5C (Act > dcas9VPR) with the 412gRNA compared to control gRNA. Gehan–Breslow–Wilcoxon test. ****P < 0.0001. l) Maximum lifespan of the CRISPRa driven ubiquitously by Act5C (Act > dcas9VPR) with the 412gRNA compared to control gRNA. Permutation test (95th percentile) followed by two-sided t-test with correction for multiple comparisons. ****P < 0.0001. m) qPcR using SYBR green of the Roo mRNA KD compared to the control shRNA control (Act5C > shRNA) relative to Rp49 (Rpl32). The experiment was performed in six biological replicates. An unpaired t-test with Bonferroni correction was used. **P = 0.0022. n) Survival of the Roo shRNA compared to control shRNA driven ubiquitously by Act5C (Act > shRNA). Dunnett test. ****P < 0.0001 o) Median lifespan of the Roo shRNA compared to control shRNA driven ubiquitously by Act5C (Act > shRNA). Gehan–Breslow–Wilcoxon test. ****P < 0.0001. p) Maximum lifespan of the Roo shRNA compared to control shRNA driven ubiquitously by Act5C (Act > shRNA). Permutation test (95th percentile) followed by two-sided t-test with correction for multiple comparisons. ****P < 0.0001.
Fig. 4.
Fig. 4.
Stress resistance assays of 412 and roo knockdown animals. a) Act5c > shRNA day 18 measurement of locomotion via negative geotaxis assay. The percentages of flies in each third of the vial are displayed. Chi-square test for trend. *(412#1) P = 0.0428. ns (412#2) P = 0.1434. ns (Roo) P = 0.1934. b) Act5c > shRNA day 40 response to oxidative stress by feeding paraquat and measuring survival. Dunnett test. ****(412#1) P < 0.0001. ns (412#2) P = 0.0702. ns (Roo) P > 0.9999. c) Act5c > shRNA day 20 response to endoplasmic reticulum (ER) stress by feeding tunicamycin and measuring survival. Dunnett test. *(412#1) P = 0.0451. *(412#2) P = 0.0401. ns (Roo) P = 0.6156. d) Act5c > shRNA day 40 response to starvation by only giving the flies access to water and measuring survival. Dunnett test. *(412#1) P = 0.0298. **(412#2) P = 0.0037. ns (Roo) P = 0.4790. e) Act5c > shRNA day 20 response to cold stress by keeping flies at 4 degrees Celsius and measuring survival after 48-hours recovery. Each dot is a vial or replicate of approximately 20 flies. One-way ANOVA. ns (412#1) P = 0.0703. * (412#2) P = 0.0461. ns (Roo) P = 0.6592. f) Act5c > shRNA day 20 response to heat stress by keeping flies at 37 degrees Celsius and measuring survival after 48-hours recovery. Each dot is a replicate of approximately 20 flies. One-way ANOVA. * (412#1) P = 0.0498. ns (412#2) P = 0.9645. ns (Roo) P = 0.3978. g) Act5c > shRNA day 25 measurement of fecundity. Data is displayed as average number of eggs laid per day over 5 days. Each dot represents a day for the number of flies in one vial. One-way ANOVA. ns (412#1) P = 0.9925. ns (412#2) P = 0.7231. ns (Roo) P = 0.1803. h) Act5c > shRNA day 25 measurement of fertility. Fertility index is calculated as number of progeny divided by number of eggs laid. Data is displayed as an average fertility index over 5 days. Each dot represents a day for the number of flies listed. One-way ANOVA. ns (412#1) P > 0.9999. ns (412#2) P = 0.5881. ns (Roo) P = 0.9887.
Fig. 5.
Fig. 5.
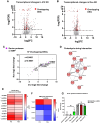
Transcriptomic analysis of 412 and Roo knockdown animals. a) Volcano plot of DEGs from whole thorax of Act5c > 412#1 shRNA knockdown animals compared to control shRNA animals. Genes with a FDR < 0.05 are highlighted in black and above the dashed line. Genes that are differentially expressed in both 412 and Roo knockdown animals (overlapping genes) are highlighted in red. b) Volcano plot of DEGs from whole thorax of Act5c > Roo shRNA knockdown animals compared to control shRNA animals. Genes with a FDR < 0.05 are highlighted in black and above the dashed line. Genes that are differentially expressed in both 412 and Roo knockdown animals (overlapping genes) are highlighted in red. c) Correlation of Log2FoldChange (Log2FC) of the overlapping DEGs between 412 and Roo knockdown animals. r = 0.9461. Deming regression. P < 0.0001. Serine proteases and AMPs that are also DEGS are enlarged and highlighted in purple. d) Gene interaction clustering performed on the overlapping DEGs using String with single nodes removed and 1 cluster used. There is a serine protease cluster of genes interacting. e) Heatmap of log2fold change (Log2FC) from RNA-Seq data across samples of the Jonah (Jon) genes. The * marked genes are significantly differentially expressed in both 412 and Roo knockdown thoraces. All other genes are significantly differentially expressed in just 412 knockdown thoraces. f) Heatmap of log2fold change (Log2FC) across samples of the AMPs. The * marked genes are significantly differentially expressed in both 412 and Roo knockdown thoraces. All other genes are significantly differentially expressed in just 412 knockdown thoraces. g) Act5c > shRNA day 20 response to gram positive bacterial infection (Bacillus subtils) and sham infection (PBS) measuring survival after 48-hours. Each dot is a replicate of approximately 20 flies. One-way ANOVA bacterial infection. ns (412) P = 0.7186. ns (Roo) P = 0.1074. One-way ANOVA sham infection. ns (412) P = 0.8145. ns (Roo) P = 0.5828. Unpaired t-test bacterial vs sham infection. ****(Control) P < 0.0001 ****(412) P < 0.0001. **(Roo) P = 0.0042.

Similar articles

Cited by

References

    1. Agianian B, Krzic U, Qiu F, Linke WA, Leonard K, Bullard B. A troponin switch that regulates muscle contraction by stretch instead of calcium. EMBO J. 2004;23(4):772–779. doi:10.1038/sj.emboj.7600097. - DOI - PMC - PubMed
    1. Akam ME, Carlson JR. The detection of jonah gene transcripts in Drosophila by in situ hybridization. EMBO J. 1985;4(1):155–161. doi:10.1002/j.1460-2075.1985.tb02330.x. - DOI - PMC - PubMed
    1. Akbari OS, Bellen HJ, Bier E, Bullock SL, Burt A, Church GM, Cook KR, Duchek P, Edwards OR, Esvelt KM, et al. Biosafety. Safeguarding gene drive experiments in the laboratory. Science. 2015;349(6251):927–929. doi:10.1126/science.aac7932. - DOI - PMC - PubMed
    1. Bao W, Kojima KK, Kohany O. Repbase update, a database of repetitive elements in eukaryotic genomes. Mob DNA. 2015;6(1):11. doi:10.1186/s13100-015-0041-9. - DOI - PMC - PubMed
    1. Broughton SJ, Piper MD, Ikeya T, Bass TM, Jacobson J, Driege Y, Martinez P, Hafen E, Withers DJ, Leevers SJ, et al. Longer lifespan, altered metabolism, and stress resistance in Drosophila from ablation of cells making insulin-like ligands. Proc Natl Acad Sci U S A. 2005;102(8):3105–3110. doi:10.1073/pnas.0405775102. - DOI - PMC - PubMed

Publication types