. 2023 May 1;129(5):1259-1277.
doi: 10.1152/jn.00404.2022. Epub 2023 Apr 19.

Simulations of active zone structure and function at mammalian NMJs predict that loss of calcium channels alone is not sufficient to replicate LEMS effects

Affiliations

Simulations of active zone structure and function at mammalian NMJs predict that loss of calcium channels alone is not sufficient to replicate LEMS effects

Scott P Ginebaugh et al. J Neurophysiol. .

Abstract

Lambert-Eaton myasthenic syndrome (LEMS) is an autoimmune-mediated neuromuscular disease thought to be caused by autoantibodies against P/Q-type voltage-gated calcium channels (VGCCs), which attack and reduce the number of VGCCs within transmitter release sites (active zones; AZs) at the neuromuscular junction (NMJ), resulting in neuromuscular weakness. However, patients with LEMS also have antibodies to other neuronal proteins, and about 15% of patients with LEMS are seronegative for antibodies against VGCCs. We hypothesized that a reduction in the number of P/Q-type VGCCs alone is not sufficient to explain LEMS effects on transmitter release. Here, we used a computational model to study a variety of LEMS-mediated effects on AZ organization and transmitter release constrained by electron microscopic, pharmacological, immunohistochemical, voltage imaging, and electrophysiological observations. We show that models of healthy AZs can be modified to predict the transmitter release and short-term facilitation characteristics of LEMS and that in addition to a decrease in the number of AZ VGCCs, disruption in the organization of AZ proteins, a reduction in AZ number, a reduction in the amount of synaptotagmin, and the compensatory expression of L-type channels outside the remaining AZs are important contributors to LEMS-mediated effects on transmitter release. Furthermore, our models predict that antibody-mediated removal of synaptotagmin in combination with disruption in AZ organization alone could mimic LEMS effects without the removal of VGCCs (a seronegative model). Overall, our results suggest that LEMS pathophysiology may be caused by a collection of pathological alterations to AZs at the NMJ, rather than by a simple loss of VGCCs.NEW & NOTEWORTHY We used a computational model of the active zone (AZ) in the mammalian neuromuscular junction to investigate Lambert-Eaton myasthenic syndrome (LEMS) pathophysiology. This model suggests that disruptions in presynaptic active zone organization and protein content (particularly synaptotagmin), beyond the simple removal of presynaptic calcium channels, play an important role in LEMS pathophysiology.

Keywords: Lambert-Eaton myasthenic syndrome; MCell modeling; active zone; neuromuscular junction.


Conflict of interest statement

No conflicts of interest, financial or otherwise, are declared by the authors.

Figures

None
Graphical abstract
Figure 1.
Figure 1.
AP waveforms and voltage-gated calcium channel (VGCC) kinetics used in the MCell models. A: the normalized average of AP waveforms recorded from mouse neuromuscular junctions (NMJs) (black) and the computational AP waveform used in MCell simulations (magenta). B: the normalized average of AP waveforms recorded from mouse NMJs in the presence of 1.5 μM 3,4-diaminopyridine (3,4-DAP) (black) and the computational AP waveform used to simulate 3,4-DAP in MCell (green). C: a comparison of the computational AP waveforms used in control (magenta) and 3,4-DAP (green) simulations. D: the Markov-chain ion channel gating scheme used to determine the behavior of VGCCs in our simulation. Average AP waveforms in A and B are from Ginebaugh et al. (34).
Figure 2.
Figure 2.
Diagrams of the healthy mouse active zone (AZ) MCell model. A: visualization of the overall geometry of the health mouse AZ MCell model. Six AZs are modeled, and each AZ consists of voltage-gated calcium channels (VGCCs) (small black dots) and two docked synaptic vesicles (black spheres). B: a diagram of the calcium sensors on the underside of each synaptic vesicle. Each vesicle has six synaptotagmin-1 and synaptotagmin-2 (syt1/2)-like sensors, consisting of five calcium ion binding sites each. A syt1/2-like sensor is activated when at least two of its five sites are bound to calcium. Each vesicle also has 18 syt7-sensors, positioned in a single annulus around the outside of the syt1/2-like sensors. Each syt-7 like sensors only contain one calcium-binding site and are activated when the site is bound by a calcium ion. Adapted from Laghaei et al. (17). C: a schematic of a single AZ, showing the positions for transmembrane proteins based on freeze-fracture data (black and white circles). The schematic shows two docked synaptic vesicles (gray circles) with a row of two VGCCs placed on each side (black circles). The white circles are unidentified AZ proteins that do not contribute to the model output.
Figure 3.
Figure 3.
Validation of our healthy mouse active zone (AZ) MCell model. A: plot of tetanic potentiation at 50 Hz. Our MCell model of the healthy mouse AZs (red circles) closely matched experimental results (open circles). The tetanic potentiation seen in Lambert-Eaton myasthenic syndrome (LEMS)-model mice (blue squares) is added for comparison. Experimental results for both LEMS and control tetanic potentiation were adapted from Tarr et al. (26). B: plot of the short-term plasticity measured during a pair of action potentials expressed as the ratio of the magnitude of transmitter release after the second pulse divided by the magnitude after the first pulse (paired pulse ratio) as the interstimulus interval is changed from 10 to 90 ms. The outputs from the MCell model (gray circles) and the experimental data (black squares) both predict little change in transmitter release over differing interstimulus interval. Experimental data are adapted from Laghaei et al. (17). C: the predicted latency of vesicle release following a single presynaptic AP is plotted based on our MCell model (open bars) in comparison with the time course of release measured at the mouse neuromuscular junction (NMJ) (64) (gray bars). D: plot of changes in transmitter release magnitude in our MCell model as the extracellular calcium concentration was varied. The log-log best fit line for the data is shown with a calcium release ratio (CRR; slope of the line) of 3.08 and an R2 value of 0.999.
Figure 4.
Figure 4.
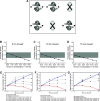
The effects on transmitter release magnitude and short-term plasticity after simply removing presynaptic voltage-gated calcium channels (VGCCs). A: MCell model diagram depicting six active zones (AZs) that contain docked synaptic vesicles (black spheres), VGCCs (open dots), and the random removal of nine VGCCs (X). B: plot of transmitter release (normalized to the control healthy model) predicted by the MCell model as various numbers of VGCCs are removed. The gray bar indicates the range of transmitter release reduction observed in the mouse passive transfer model of Lambert-Eaton myasthenic syndrome (LEMS) adapted from Refs. , , , , and . C: plot of tetanic potentiation at 50 Hz in healthy control experimental results (open circles), LEMS passive transfer model mice (blue squares), our MCell model of the healthy mouse AZs (red circles), and after removing 9, 16, 18, and 20 VGCCs from our model of 6 AZs that contains a total of 24 VGCCs (dotted lines). Experimental results for both LEMS and control tetanic potentiation were adapted from Tarr et al. (26). D: experimental recording of short-term synaptic plasticity (tetanic potentiation) from healthy control neuromuscular junctions (NMJs) (open circles) and after blocking 40%–60% of transmitter release magnitude using 25 nm ω-Agatoxin IVA (open squares).
Figure 5.
Figure 5.
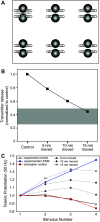
The effects on transmitter release magnitude and short-term plasticity after simply moving presynaptic voltage-gated calcium channels (VGCCs) away from docked synaptic vesicles. A: MCell model diagram depicting six active zones (AZs) that contain docked synaptic vesicles (black spheres), VGCCs (open dots), and the movement of all VGCCs away from synaptic vesicles by 5, 10, and 15 nm. B: plot of transmitter release (normalized to the control healthy model) predicted by the MCell models shown in A as VGCCs are moved 5, 10, or 15 nm away from docked synaptic vesicles. The gray bar indicates the range of transmitter release reduction observed in the mouse passive transfer model of Lambert-Eaton myasthenic syndrome (LEMS) adapted from Refs. , , , , and . C: plot of tetanic potentiation at 50 Hz in healthy control experimental results (open circles), LEMS passive transfer model mice (blue squares), our MCell model of the healthy mouse AZs (red circles), and after moving VGCCs 5, 10, or 15 nm within our model of six AZs that contains a total of 24 VGCCs (dotted lines). Experimental results for both LEMS and control tetanic potentiation were adapted from Tarr et al. (26).
Figure 6.
Figure 6.
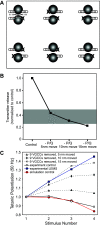
The effects on transmitter release magnitude and short-term plasticity after a combination of moving presynaptic voltage-gated calcium channels (VGCCs) away from docked synaptic vesicles and randomly removing 9 of 24 VGCCs from the six active zone (AZ) model. A: MCell model diagram depicting six AZs that contain docked synaptic vesicles (black spheres), VGCCs (open dots), and the movement of all VGCCs away from synaptic vesicles by 5, 10, and 15 nm, coupled with the random removal of nine VGCCs (X). B: plot of transmitter release (normalized to the control healthy model) predicted by the MCell models shown in A. The gray bar indicates the range of transmitter release reduction observed in the mouse passive transfer model of Lambert-Eaton myasthenic syndrome (LEMS) adapted from Refs. , , , , and . C: plot of tetanic potentiation at 50 Hz in healthy control experimental results (open circles), LEMS passive transfer model mice (blue squares), our MCell model of the healthy mouse AZs (red circles), and after moving VGCCs 5, 10, or 15 nm and randomly removing nine VGCCs within our model of six AZs that contains a total of 24 VGCCs (dotted lines). Experimental results for both LEMS and control tetanic potentiation were adapted from Tarr et al. (26).
Figure 7.
Figure 7.
The effects on transmitter release magnitude and short-term plasticity after a combination of moving presynaptic voltage-gated calcium channels (VGCCs) away from docked synaptic vesicles, removing two active zones (AZs), randomly removing 6 of 16 remaining P/Q-type VGCCs, and adding 2 L-type VGCCs outside the remaining AZs within our model. A: MCell model diagram depicting four AZs (after removing 2; large “X”) that contain docked synaptic vesicles (black spheres), VGCCs (open dots), and the movement of all VGCCs away from synaptic vesicles by 5, 10, and 15 nm, coupled with the random removal of 6 VGCCs (X), and the addition of 2 L-type VGCCs (black dots) outside of the remaining AZs. B: plot of total transmitter release from the entire nerve terminal segment containing four disease model AZs (normalized to the control healthy model nerve terminal segment that contains 6 healthy AZs) predicted by the MCell models shown in A. The gray bar indicates the range of transmitter release reduction observed in the mouse passive transfer model of Lambert-Eaton myasthenic syndrome (LEMS) adapted from Refs. , , , , and . C: plot of tetanic potentiation at 50 Hz in healthy control experimental results (open circles), LEMS passive transfer model mice (blue squares), our MCell model of the healthy mouse AZs (red circles), and after moving VGCCs 5, 10, or 15 nm, randomly removing six VGCCs from the remaining four AZs, and the addition of L-type VGCCs outside the AZ area (dotted lines). Experimental results for both LEMS and control tetanic potentiation were adapted from Tarr et al. (26).
Figure 8.
Figure 8.
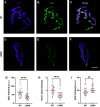
Synaptotagmin 2 (syt2) immunoreactivity in control mouse neuromuscular junctions (NMJs) and in Lambert-Eaton myasthenic syndrome (LEMS) passive transfer model mouse NMJs. Sample staining of control NMJ showing bungarotoxin (BTX) (A), syt2 (B), and the merge (C). Sample staining of LEMS NMJ showing BTX (D), syt2 (E), and the merge (F). G: comparison of syt2 intensity between control and LEMS shows a significant reduction in LEMS NMJs. H: comparison of normalized syt2 intensity between control and LEMS NMJs also shows a significant reduction in LEMS NMJs. All data points are normalized to the average syt2 intensity of the control NMJs stained on the same day. I: comparison of syt2 intensity outside the boundary of the BTX stain shows a significant increase in LEMS NMJs in a 10 pixel perimeter, which is equal to a 690 nm perimeter around BTX stained NMJs. Data in G, H, and I are means ± SE; **P < 0.01, ****P < 0.0001. Scale bar in F is 10 µm and applies to A–F.
Figure 9.
Figure 9.
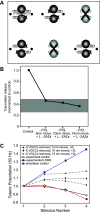
The effects on transmitter release magnitude and short-term plasticity of sequentially removing synaptotagmin-1/2 (syt1/2) calcium sensor proteins from the bottom of the docked synaptic vesicles in our six active zone (AZ) model. A: MCell model diagram depicting the removal of two syt1/2 proteins from the bottom of a synaptic vesicle (X) in our model. B: MCell model diagram depicting six AZs that contain docked synaptic vesicles (black spheres), voltage-gated calcium channels (VGCCs) (open dots), and the removal of two syt1/2 proteins (X) from each docked synaptic vesicle. C: plot of transmitter release (normalized to the control healthy model) predicted by the MCell models shown in B. The gray bar indicates the range of transmitter release reduction observed in the mouse passive transfer model of Lambert-Eaton myasthenic syndrome (LEMS) adapted from Refs. , , , , and . D: plot of tetanic potentiation at 50 Hz in healthy control experimental results (open circles), LEMS passive transfer model mice (blue squares), our MCell model of the healthy mouse AZs (red circles), and after removing various numbers of syt1/2 proteins from docked synaptic vesicles (dotted lines). Experimental results for both LEMS and control tetanic potentiation were adapted from Tarr et al. (26).
Figure 10.
Figure 10.
The effect on transmitter release magnitude and short-term plasticity of simultaneously removing synaptotagmin-1/2 (syt1/2) proteins and moving voltage-gated calcium channels (VGCCs) in our six active zone (AZ) model. A: MCell model diagram depicting six AZs that contain docked synaptic vesicles (black spheres), VGCCs (open dots), the removal of two syt1/2 proteins (X) from each docked synaptic vesicle, and the movement of VGCCs away from docked synaptic vesicles. B–D: plots of transmitter release (normalized to the control healthy model) predicted by the movement of VGCCs 5, 10, or 15 nm away from docked synaptic vesicles in combination with removing various numbers of syt1/2 proteins from docked synaptic vesicles. The gray bar indicates the range of transmitter release reduction observed in the mouse passive transfer model of Lambert-Eaton myasthenic syndrome (LEMS) adapted from Refs. , , , , and . E–G: plots of tetanic potentiation at 50 Hz in healthy control experimental results (open circles), LEMS passive transfer model mice (blue squares), our MCell model of the healthy mouse AZs (red circles), and after moving VGCCs 5, 10, or 15 nm and removing various numbers of syt1/2 proteins from docked synaptic vesicles (dotted lines). The effects of removing 1–3 syt1/2 proteins are shown as removing additional syt1/2 proteins resulted in tetanic potentiation that far exceeded the experimental LEMS results (blue squares). Experimental results for both LEMS and control tetanic potentiation were adapted from Tarr et al. (26).
Figure 11.
Figure 11.
The effects on transmitter release magnitude and short-term plasticity in a Lambert-Eaton myasthenic syndrome (LEMS) model that incorporates all of the hypothesized changes to the neuromuscular junction (NMJ) active zones (AZs). A: MCell model diagram depicting the removal of 2 AZs (large “X”), removing 6/16 P/Q-type voltage-gated calcium channels (VGCCs) (medium “X”) from the remaining AZs, moving the remaining P/Q-type VGCCs away from docked synaptic vesicles (5, 10, or 15 nm; open circles), removing various numbers of synaptotagmin-1/2 (syt1/2) proteins from the bottom of the docked synaptic vesicles (small “X”), and adding 2 L-type VGCCs outside of the remaining AZs (black dots). B–D: plot of transmitter release from the entire nerve terminal segment containing four disease model AZs (normalized to the control healthy model nerve terminal segment containing 6 healthy AZs) predicted by the movement of VGCCs 5, 10, or 15 nm away from docked synaptic vesicles in combination with the other changes described in A. The gray bar indicates the range of transmitter release reduction observed in the mouse passive transfer model of LEMS adapted from Refs. , , , , . E–G: plot of tetanic potentiation at 50 Hz in healthy control experimental results (open circles), Lambert-Eaton myasthenic syndrome (LEMS) passive transfer model mice (blue squares), our MCell model of the healthy mouse AZs (red circles), and after moving VGCCs 5, 10, 15 nm and the other LEMS-induced changes described in A (dotted lines). The effects of removing greater than three syt1/2 proteins are shown because removing additional syt1/2 proteins resulted in tetanic potentiation that far exceeded the experimental LEMS results (blue squares). Experimental results for both LEMS and control tetanic potentiation were adapted from Tarr et al. (26).

Similar articles

References

    1. Oh SJ, Hatanaka Y, Claussen GC, Sher E. Electrophysiological differences in seropositive and seronegative Lambert-Eaton myasthenic syndrome. Muscle Nerve 35: 178–183, 2007. doi:10.1002/mus.20672. - DOI - PubMed
    1. Tarr TB, Malick W, Liang M, Valdomir G, Frasso M, Lacomis D, Reddel SW, Garcia-Ocano A, Wipf P, Meriney SD. Evaluation of a novel calcium channel agonist for therapeutic potential in Lambert-Eaton myasthenic syndrome. J Neurosci 33: 10559–10567, 2013. doi:10.1523/JNEUROSCI.4629-12.2013. - DOI - PMC - PubMed
    1. Benatar M, Blaes F, Johnston I, Wilson K, Vincent A, Beeson D, Lang B. Presynaptic neuronal antigens expressed by a small cell lung carcinoma cell line. J Neuroimmunol 113: 153–162, 2001. doi:10.1016/s0165-5728(00)00431-8. - DOI - PubMed
    1. Takamori M. Lambert-Eaton myasthenic syndrome: search for alternative autoimmune targets and possible compensatory mechanisms based on presynaptic calcium homeostasis. J Neuroimmunol 201–202: 145–152, 2008. doi:10.1016/j.jneuroim.2008.04.040. - DOI - PubMed
    1. Kesner VG, Oh SJ, Dimachkie MM, Barohn RJ. Lambert-Eaton myasthenic syndrome. Neurol Clin 36: 379–394, 2018. doi:10.1016/j.ncl.2018.01.008. - DOI - PMC - PubMed

Publication types

LinkOut - more resources