

Optimized OPEP Force Field for Simulation of Crowded Protein Solutions
- PMID: 37071827
- PMCID: PMC10150358
- DOI: 10.1021/acs.jpcb.3c00253
Optimized OPEP Force Field for Simulation of Crowded Protein Solutions
Abstract
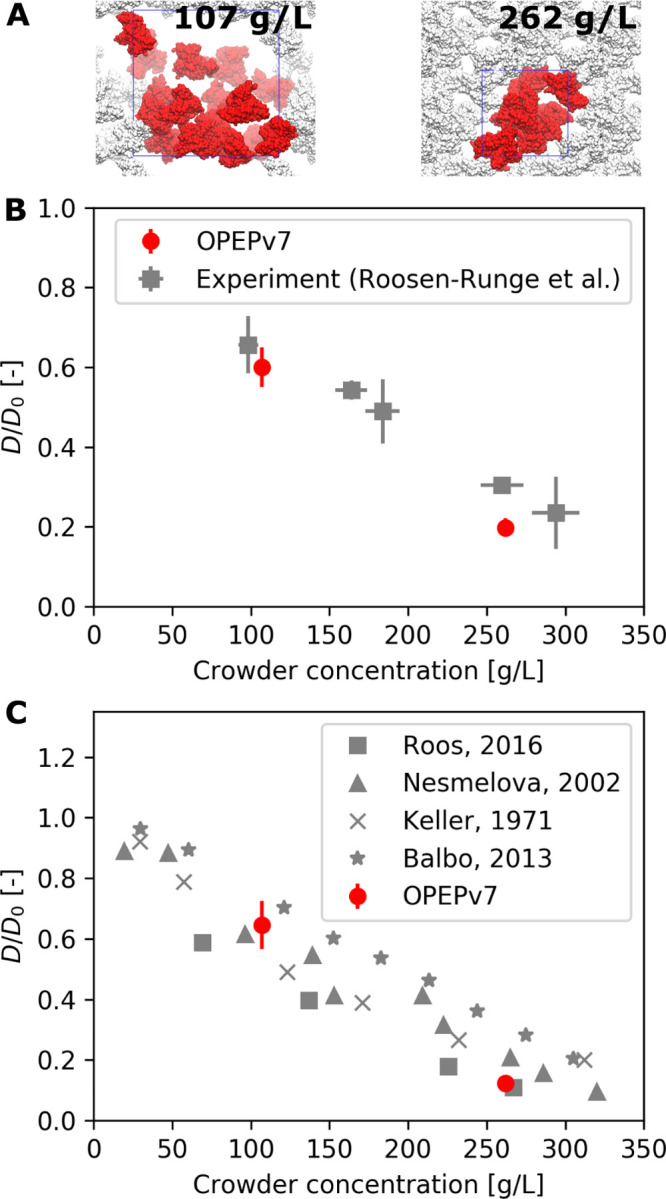
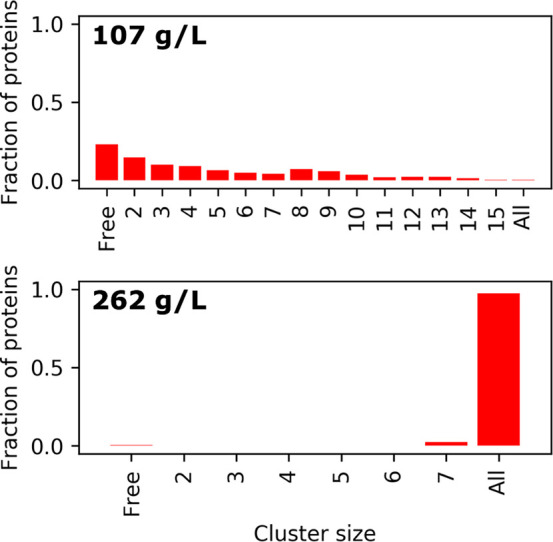
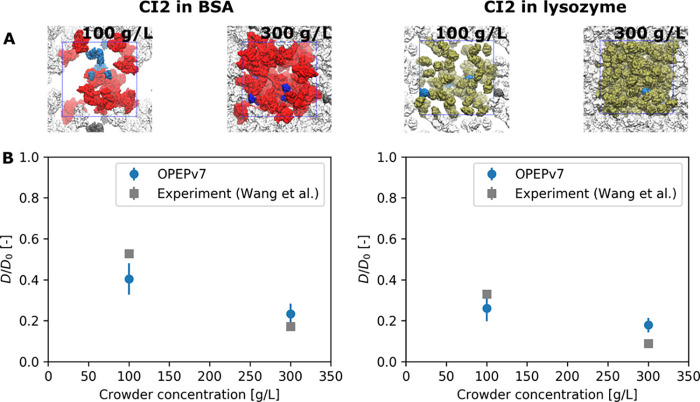
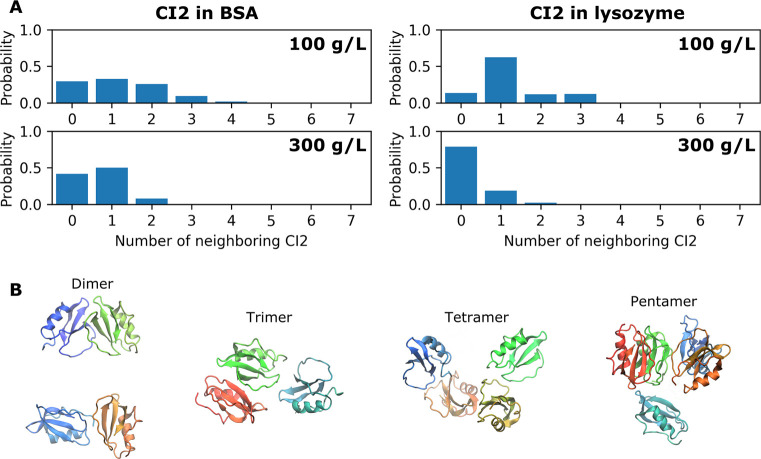
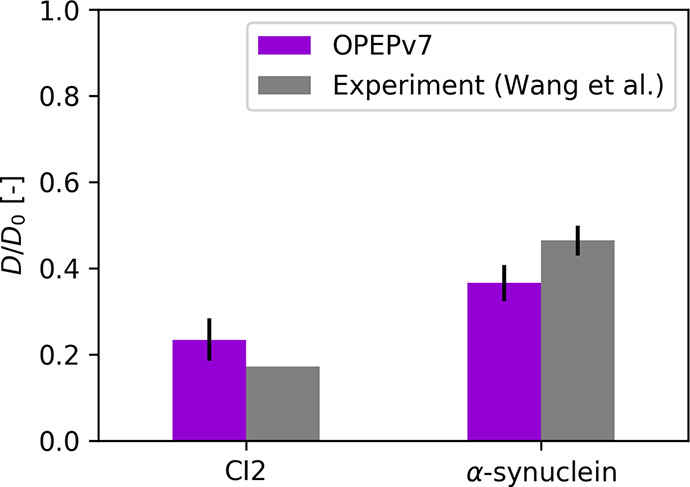
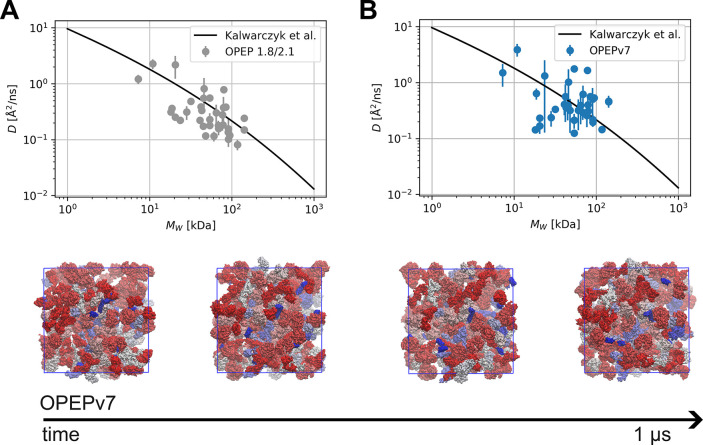
Macromolecular crowding has profound effects on the mobility of proteins, with strong implications on the rates of intracellular processes. To describe the dynamics of crowded environments, detailed molecular models are needed, capturing the structures and interactions arising in the crowded system. In this work, we present OPEPv7, which is a coarse-grained force field at amino-acid resolution, suited for rigid-body simulations of the structure and dynamics of crowded solutions formed by globular proteins. Using the OPEP protein model as a starting point, we have refined the intermolecular interactions to match the experimentally observed dynamical slowdown caused by crowding. The resulting force field successfully reproduces the diffusion slowdown in homogeneous and heterogeneous protein solutions at different crowding conditions. Coupled with the lattice Boltzmann technique, it allows the study of dynamical phenomena in protein assemblies and opens the way for the in silico rheology of protein solutions.
Conflict of interest statement
The authors declare no competing financial interest.
Figures
Similar articles
-
Diffusion of proteins in crowded solutions studied by docking-based modeling.J Chem Phys. 2024 Sep 7;161(9):095101. doi: 10.1063/5.0220545. J Chem Phys. 2024. PMID: 39225532 Free PMC article.
-
Macromolecular crowding: chemistry and physics meet biology (Ascona, Switzerland, 10-14 June 2012).Phys Biol. 2013 Aug;10(4):040301. doi: 10.1088/1478-3975/10/4/040301. Epub 2013 Aug 2. Phys Biol. 2013. PMID: 23912807
-
Structure, energetics and dynamics in crowded amino acid solutions: a molecular dynamics study.Phys Chem Chem Phys. 2023 Feb 15;25(7):5430-5442. doi: 10.1039/d2cp04238j. Phys Chem Chem Phys. 2023. PMID: 36744506
-
Protein Aggregation and Molecular Crowding: Perspectives From Multiscale Simulations.Int Rev Cell Mol Biol. 2017;329:49-77. doi: 10.1016/bs.ircmb.2016.08.009. Epub 2016 Oct 22. Int Rev Cell Mol Biol. 2017. PMID: 28109331 Review.
-
Formation of protein complexes in crowded environments--from in vitro to in vivo.FEBS Lett. 2013 Apr 17;587(8):1046-52. doi: 10.1016/j.febslet.2013.01.007. Epub 2013 Jan 18. FEBS Lett. 2013. PMID: 23337873 Free PMC article. Review.
Cited by
-
Probing Electrostatic and Hydrophobic Associative Interactions in Cells.J Phys Chem B. 2024 Nov 7;128(44):10861-10869. doi: 10.1021/acs.jpcb.4c05990. Epub 2024 Oct 30. J Phys Chem B. 2024. PMID: 39473385 Free PMC article.
-
Computational Approaches to Predict Protein-Protein Interactions in Crowded Cellular Environments.Chem Rev. 2024 Apr 10;124(7):3932-3977. doi: 10.1021/acs.chemrev.3c00550. Epub 2024 Mar 27. Chem Rev. 2024. PMID: 38535831 Free PMC article. Review.
-
Diffusion of proteins in crowded solutions studied by docking-based modeling.J Chem Phys. 2024 Sep 7;161(9):095101. doi: 10.1063/5.0220545. J Chem Phys. 2024. PMID: 39225532 Free PMC article.
References
Publication types
MeSH terms
Substances
LinkOut - more resources
Full Text Sources
