. 2023 Oct 13;213(3):339-356.
doi: 10.1093/cei/uxad042.

Secretory-IgA binding to intestinal microbiota attenuates inflammatory reactions as the intestinal barrier of preterm infants matures

Affiliations

Secretory-IgA binding to intestinal microbiota attenuates inflammatory reactions as the intestinal barrier of preterm infants matures

Sarah M Mahdally et al. Clin Exp Immunol. .

Abstract

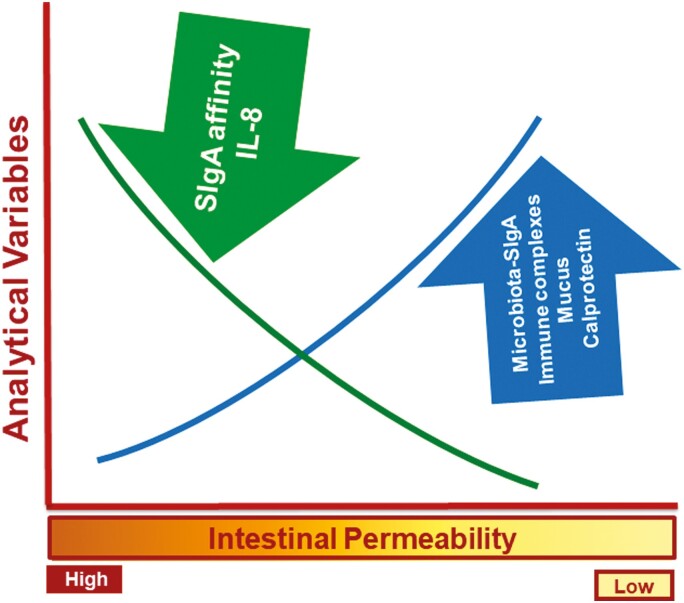
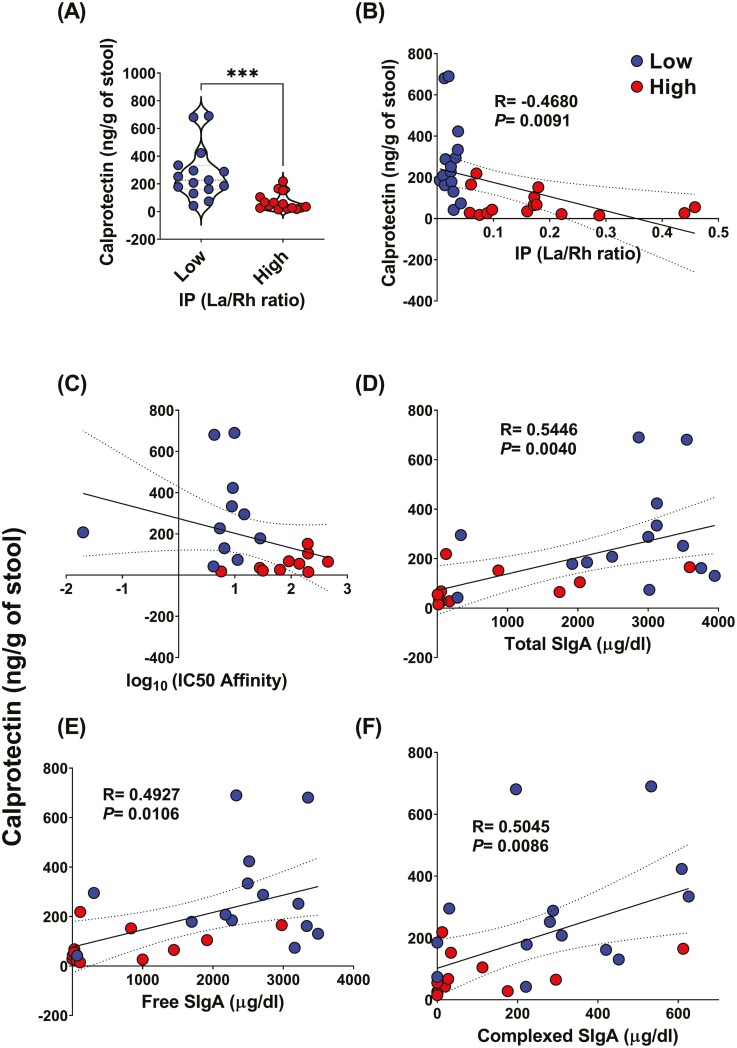
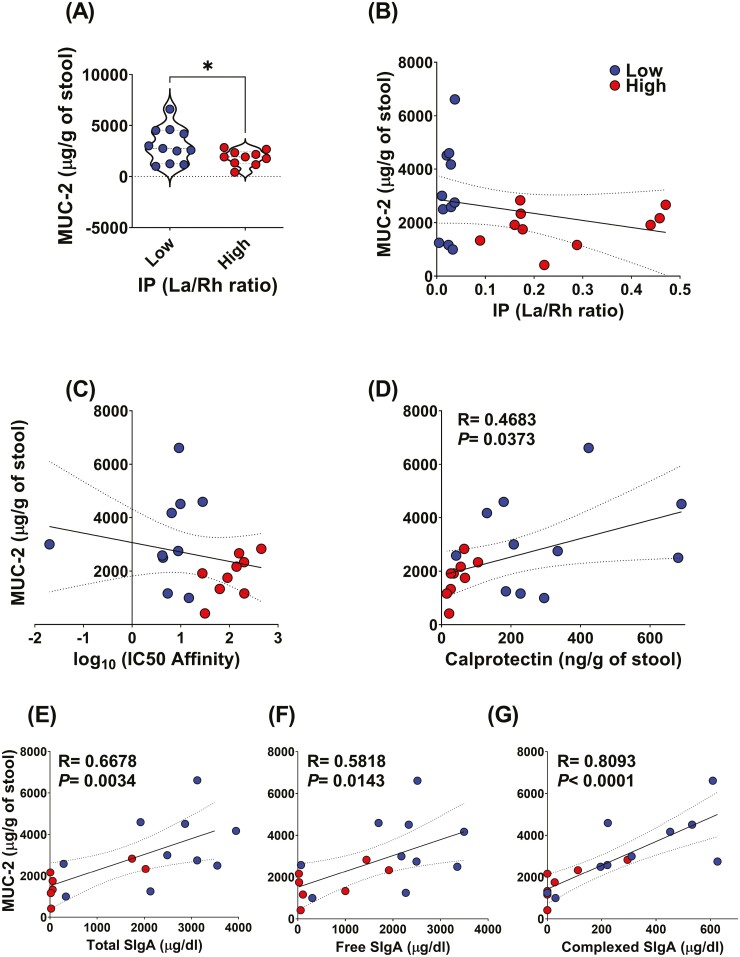
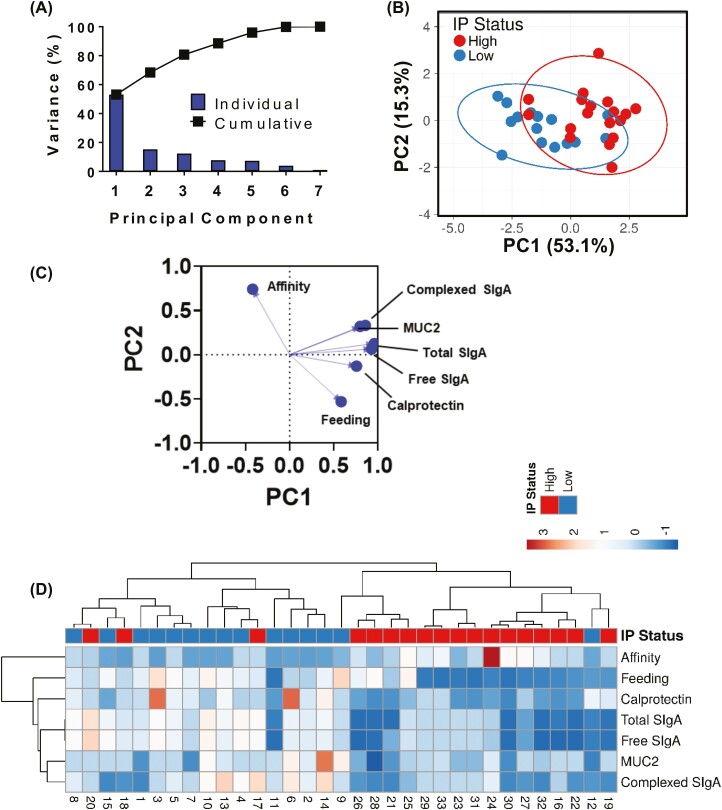
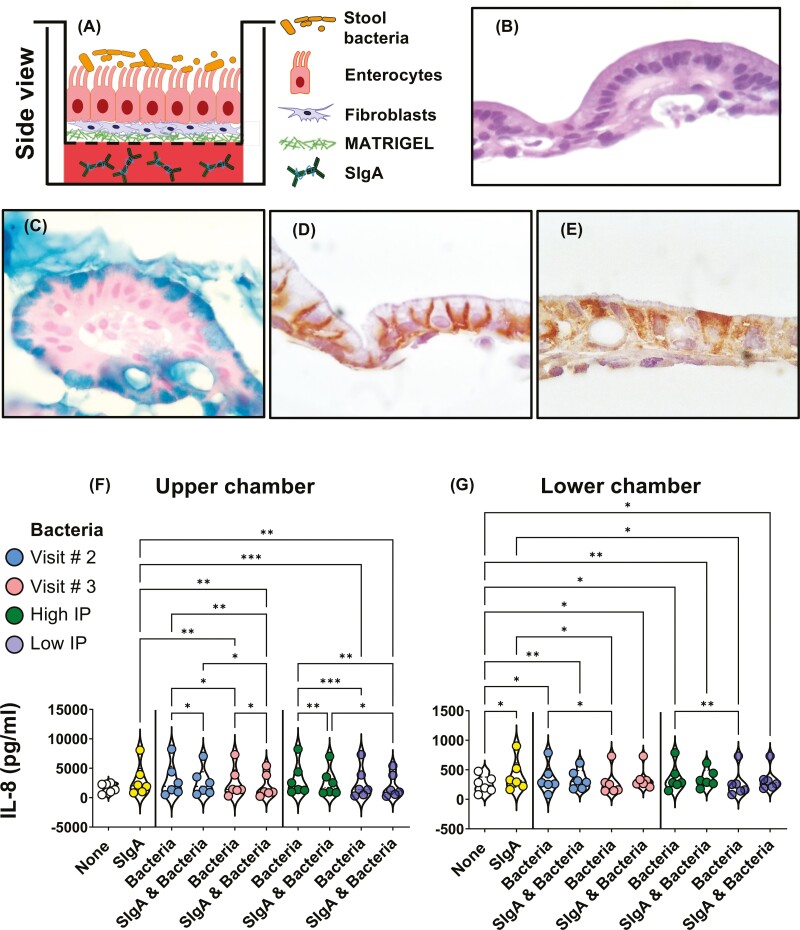
Previous work has shown that Secretory-IgA (SIgA) binding to the intestinal microbiota is variable and may regulate host inflammatory bowel responses. Nevertheless, the impact of the SIgA functional binding to the microbiota remains largely unknown in preterm infants whose immature epithelial barriers make them particularly susceptible to inflammation. Here, we investigated SIgA binding to intestinal microbiota isolated from stools of preterm infants <33 weeks gestation with various levels of intestinal permeability. We found that SIgA binding to intestinal microbiota attenuates inflammatory reactions in preterm infants. We also observed a significant correlation between SIgA affinity to the microbiota and the infant's intestinal barrier maturation. Still, SIgA affinity was not associated with developing host defenses, such as the production of mucus and inflammatory calprotectin protein, but it depended on the microbiota shifts as the intestinal barrier matures. In conclusion, we reported an association between the SIgA functional binding to the microbiota and the maturity of the preterm infant's intestinal barrier, indicating that the pattern of SIgA coating is altered as the intestinal barrier matures.

Trial registration: ClinicalTrials.gov NCT01756040.

Keywords: Secretory immunoglobulin A; human; intestinal permeability; intestine; microbiota.


Conflict of interest statement

The authors declare no conflict of interest.

Figures

None
Graphical abstract
Figure 1.
Figure 1.
Flow diagram depicting the experimental design. Stool samples were used either (A) directly in ex vivo experiments (i.e. fecal waters) to detect calprotectin, SIgA, and mucus in the supernatants by ELISA, or to evaluate SIgA mean fluorescence intensity (MFI) per bacteria by flow cytometry, or (B) cultured anaerobically for use in in vitro experiments. For in vitro experiments, bacteria were cultured on Columbia agar supplemented with 5% sheep blood. After 72 hours of incubation, bacteria were harvested, loaded with BacLight Red, and stained with serially diluted SIgA from colostrum, followed by staining with FITC-conjugated anti-human IgA polyclonal Abs, α-chain specific, and affinity measured by flow cytometry.
Figure 2.
Figure 2.
Ex vivo detection of microbiota-SIgA complexes in stools from preterm infants with different IP. (A) Gating strategy for Microbiota-SIgA complex analyses & background level on an unstained sample and (B) ex vivo analyses of Microbiota-SIgA immune complexes in stools of infants measured by flow cytometry using BAC-Light and goat FITC anti-human IgA polyclonal antibodies. Numbers inside the boxes correspond to the % positive cells followed by median fluorescence intensity (MFI) in parenthesis. Numbers outside of the boxes represent the IP of 5 different infants. Correlation between SIgA MFI measured by flow cytometry and (C) IP evaluated by the “gold-standard” Lactulose/Rhamnose (La/Rh ratio) Absorption Test, (D) cumulative breastmilk intake, and (E) levels of microbiota-SIgA immune complexes detected in the stools by flow cytometry. Two-sided Pearson correlation coefficient tests were used to measure the association between the variables. Data are representative of 15 specimens from 11 preterm infants (7 contributing 1 observation, and 4 contributing 2 observations from different visits). Trendlines (solid lines), the correlation coefficient “R” and “P” values are shown. P values of <0.05 were considered statistically significant. Dashed lines represent 95% confidence intervals. (F) Gating strategy for dim and bright subsets based on the expression of SIgA. Stool bacteria from (G) multiple or (H) unique preterm and expressing dim SIgA were gated in forward versus side scatter (FSC vs. SSC) to identify the shift in bacterial size and/or morphology.
Figure 3.
Figure 3.
In vitro detection of SIgA affinity and association with IP. Anaerobic cultures were used to grow microbiota from stools of preterm infants. After 72 hours of incubation, bacteria were harvested, loaded with BacLight Red, and stained with serially diluted SIgA from colostrum, followed by staining with FITC-conjugated anti-human IgA polyclonal Abs, α-chain specific, and affinity measured by flow cytometry. Affinity calculations were based on the equation: logEC50-((LOG10((Bmax-Kd)/(Kd-Bmin))/Hillslope)). (A) Data is representative of 1 individual with 2 time points, visit 2 (filled square, IP = 0.172) and visit 3 (open triangle, IP = 0.047). (B) SIgA affinity toward microbiota in stool samples from preterm infants with low IP (filled circle, La/Rh ratios <0.05) and high IP (filled circle, La/Rh ratios >0.05). A two-tailed nested-t-test was used for comparisons among the two groups. (C) Correlation between IP evaluated by the “gold-standard” Lactulose/Rhamnose (La/Rh ratio) Absorption Test and SIgA affinity. A two-sided Pearson correlation coefficient test was used to measure the association between the variables. Data are representative of 26 specimens from 17 babies (9 contributing 1 observation, 7 contributing 2 observations, and 1 contributing 3 observations from different visits). Trendlines (solid lines), show the correlation coefficient “R” and “P” values. P values of <0.05 were considered statistically significant. Dashed lines represent 95% confidence intervals.
Figure 4.
Figure 4.
Ex vivo detection of the total, free, and microbiota complexed SIgA. Fecal water was prepared by successive washes, centrifugation, and filtration of the bacteria from stool samples. ELISA assays were used to measure concentrations of (A) total, (B) free, and (C) microbiota complexed SIgA in fecal waters from preterms with low IP (filled circle, La/Rh ratios <0.05) and high IP (filled circle, La/Rh ratios >0.05). Microbiota complexed SIgA was calculated as the difference between total SIgA and free SIgA obtained after 0.2 mm filtration of fecal waters. A two-tailed nested-t-test was used for comparisons among the two groups. Correlations between the levels of (D) total, (E) free, and (F) microbiota complexed SIgA and IP. Data are representative of 28 specimens from 21 babies (14 contributing 1 observation, and 7 contributing 2 observations from different visits). Correlations between the levels of (G) total, (H) free, and (I) microbiota-complexed SIgA and SIgA affinity. Data are representative of 19 specimens from 14 babies (9 contributing 1 observation, and 5 contributing 2 observations from different visits). Two-sided Pearson correlation coefficient tests were used to measure the associations between the variables. Each dot represents the average of 2 replicates. Trendlines (solid lines), and correlation coefficients “R” and “P” values are shown. P-value of <0.05 was considered statistically significant. Dashed lines represent 95% confidence intervals.
Figure 5.
Figure 5.
Calprotectin levels are inversely correlated with IP. Ex vivo detection of calprotectin in fecal waters. Fecal waters were prepared by successive washes, centrifugation, and filtration out of the bacteria from the stool samples as described in Methods section. (A) ELISA assays were used to measure calprotectin levels in fecal waters from preterm infants with low IP (filled circle, La/Rh ratios <0.05) and high IP (filled circle, La/Rh ratios >0.05). A two-tailed nested-t-test was used for comparisons among the two groups. (B) Correlation between calprotectin levels and intestinal permeability evaluated by the “gold-standard” Lactulose/Rhamnose (La/Rh ratio) Absorption Test. Two-sided paired Student’s t-tests were used for comparisons between two groups. Data are representative of 30 specimens from 22 babies (15 contributing 1 observation, 6 contributing 2 observations, and 1 contributing 3 observations from different visits). (C) Correlation between calprotectin levels and SIgA affinity. Data are representative of 21 specimens from 15 babies (10 contributing 1 observation, 4 contributing 2 observations, and 1 contributing 3 observations from different visits). Correlations between calprotectin levels and either (D) total, (E) free, or (F) complexed SIgA measured by ELISA. Data are representative of 26 specimens from 21 babies (16 contributing 1 observation, and 5 contributing 2 observations from different visits). Two-sided Pearson correlation coefficient tests were used to measure associations between variables. Each dot represents the average of 2 replicates. Trendlines (solid lines), and correlation coefficients “R” and “P” values are shown. P-value of <0.05 was considered statistically significant. Dashed lines represent 95% confidence intervals.
Figure 6.
Figure 6.
Mucus production (MUC-2) increases in stool samples from preterms with lower IP. Ex vivo detection of mucus in the fecal water. Fecal waters were prepared by successive washes, centrifugation, and filtration out of the bacteria from the stool samples as described in Methods section. (A) MUC-2 ELISA assays were used to measure concentrations of mucus in fecal waters from preterms with low IP (filled circle, La/Rh ratios <0.05) and high IP (filled circle, La/Rh ratios >0.05) evaluated by the “gold-standard” Lactulose/Rhamnose (La/Rh ratio) Absorption Test. A two-tailed nested-t-test was used for comparisons among the two groups. (B) Correlations between MUC-2 levels and IP. Data are representative of 21 specimens from 14 babies (8 contributing 1 observation, 5 contributing 2 observations, and 1 contributing 3 observations from different visits). (C) Correlation between MUC-2 levels and SIgA affinity. Data are representative of 19 specimens from 13 babies (8 contributing 1 observation, 4 contributing 2 observations, and 1 contributing 3 observations from different visits). (D) Correlations between MUC-2 levels and calprotectin measured by ELISA. Data are representative of 20 specimens from 13 babies (7 contributing 1 observation, 5 contributing 2 observations, and 1 contributing 3 observations from different visits). Correlations between MUC-2 levels and either (E) total, (F) free, or (G) complexed SIgA measured by ELISA. Data are representative of 17 specimens from 12 babies (7 contributing 1 observation, and 5 contributing 2 observations from different visits). Two-sided Pearson correlation coefficient tests were used to measure associations between the variables. Each dot represents the average of 2 replicates. Trendlines (solid lines), the correlation coefficient “R” and “P” values are shown. P values of < 0.05 were considered statistically significant. Dashed lines represent 95% confidence intervals.
Figure 7.
Figure 7.
Principal Component Analysis (PCA) variances. (A) Variances are plotted for each component (bars) and cumulatively (line). (B) Score plot was based on the first (53.1%) and second (15.3%) components and used to measure the ability of PCA to differentiate preterm infants with low IP (La/Rh ratios < 0.05) and high IP (La/Rh ratios > 0.05). IP were evaluated by the “gold-standard” Lactulose/Rhamnose (La/Rh ratio) Absorption Test. Each dot represents the expression profile of one specimen, where each PC summarizes the variance of 33 specimens (corresponding to 25 infants). Prediction ellipses are such that with a probability of 0.95, a new observation from the same group will fall inside the ellipse. (C) Loading plot shows how strongly each variable influences a principal component. (D) Heatmap. Rows are centered; unit variance scaling is applied to rows. Imputation is used for missing value estimations. Both rows and columns are clustered using correlation distance and average linkage (7 rows, 33 columns).
Figure 8.
Figure 8.
Establishment of a human neonatal organoid of intestinal ileum mucosa (organoid) and IL-8 production. (A) Model cartoon. Tissues from a 14-day-organoid were stained with (B) hematoxylin and eosin (H&E) to visualize cell morphology or (C) Alcian blue for detection of mucus (×40 magnification). (D) The presence of tight junctions was detected by immunochemical staining using an anti-claudin-3 polyclonal rabbit antiserum. (E) Immunochemical staining was also used to detect the expression of disaccharidases (i.e., sucrase-isomaltase, SI) using anti-SI polyclonal antibodies (×100 magnification). Organoids were exposed to only media (None), SIgA, or bacteria either alone or in conjunction with SIgA as indicated in the x-axis legend. After 5 hours, supernatants from upper (F) or lower chambers (G) were collected and used to detect IL-8 by ELISA. Mixed-effects analysis with Geisser-Greenhouse correction and matched values were used to perform multiple comparisons. Data are representative of 14 specimens from 7 babies (2 contributing 1 observation, and 6 contributing 2 observations from different visits). Each dot represents the average of 2 replicates from 3 independent experiments.

Similar articles

Cited by

References

    1. Falk PG, Hooper LV, Midtvedt T, Gordon J I.. Creating and maintaining the gastrointestinal ecosystem: what we know and need to know from gnotobiology. Microbiol Mol Biol Rev 1998, 62, 1157–70. doi:10.1128/MMBR.62.4.1157-1170.1998 - DOI - PMC - PubMed
    1. Mackie RI, Sghir A, Gaskins HR.. Developmental microbial ecology of the neonatal gastrointestinal tract. Am J Clin Nutr 1999, 69, 1035S1035s–1045S. doi:10.1093/ajcn/69.5.1035s - DOI - PubMed
    1. Chung H, Pamp SJ, Hill JA, Surana NK, Edelman SM, Troy EB, et al. . Gut immune maturation depends on colonization with a host-specific microbiota. Cell 2012, 149, 1578–93. doi:10.1016/j.cell.2012.04.037 - DOI - PMC - PubMed
    1. Hunter CJ, Upperman JS, Ford HR, Camerini V.. Understanding the susceptibility of the premature infant to necrotizing enterocolitis (NEC). Pediatr Res 2008, 63, 117–23. doi:10.1203/PDR.0b013e31815ed64c - DOI - PubMed
    1. Yu Y, Lu L, Sun J, Petrof EO, Claud EC.. Preterm infant gut microbiota affects intestinal epithelial development in a humanized microbiome gnotobiotic mouse model. Am J Physiol Gastrointest Liver Physiol 2016, 311, G521–32. doi:10.1152/ajpgi.00022.2016 - DOI - PMC - PubMed

Publication types

Substances

Associated data