

DNA Damage Inducer Mitoxantrone Amplifies Synergistic Mild-Photothermal Chemotherapy for TNBC via Decreasing Heat Shock Protein 70 Expression
- PMID: 37066748
- PMCID: PMC10238214
- DOI: 10.1002/advs.202206707
DNA Damage Inducer Mitoxantrone Amplifies Synergistic Mild-Photothermal Chemotherapy for TNBC via Decreasing Heat Shock Protein 70 Expression
Abstract
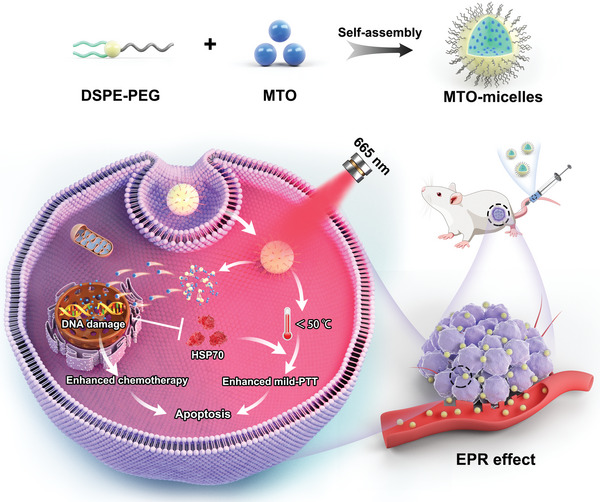
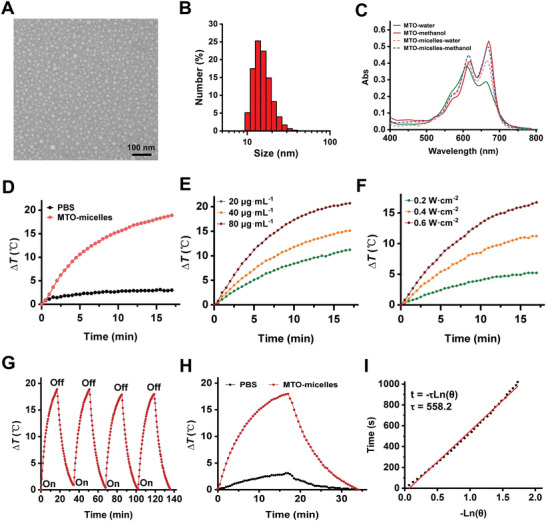
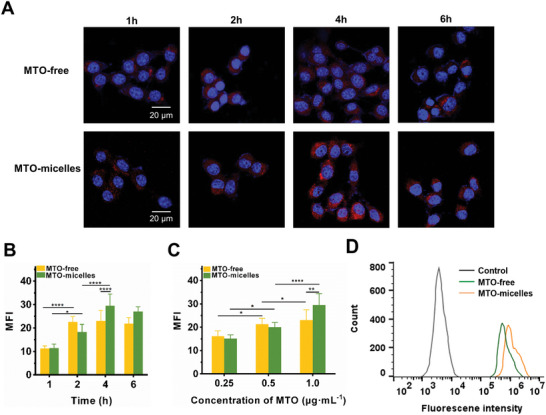
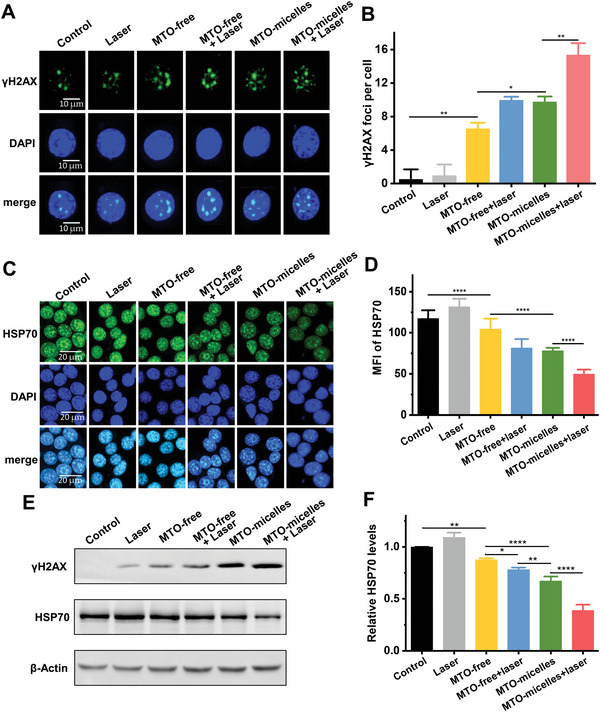
Patients with triple-negative breast cancer (TNBC) have the worst clinical outcomes when compared to other subtypes of breast cancer. Nanotechnology-assisted photothermal therapy (PTT) opens new opportunities for precise cancer treatment. However, thermoresistance caused by PTT, as well as uncertainty in the physiological metabolism of existing phototherapeutic nanoformulations, severely limit their clinical applications. Herein, based on the clinically chemotherapeutic drug mitoxantrone (MTO), a multifunctional nanoplatform (MTO-micelles) is developed to realize mutually synergistic mild-photothermal chemotherapy. MTO with excellent near-infrared absorption (≈669 nm) can function not only as a chemotherapeutic agent but also as a photothermal transduction agent with elevated photothermal conversion efficacy (ƞ = 54.62%). MTO-micelles can accumulate at the tumor site through the enhanced permeability and retention effect. Following local near-infrared irradiation, mild hyperthermia (<50 °C) assists MTO in binding tumor cell DNA, resulting in chemotherapeutic sensitization. In addition, downregulation of heat shock protein 70 (HSP70) expression due to enhanced DNA damage can in turn weaken tumor thermoresistance, boosting the efficacy of mild PTT. Both in vitro and in vivo studies indicate that MTO-micelles possess excellent synergetic tumor inhibition effects. Therefore, the mild-photothermal chemotherapy strategy based on MTO-micelles has a promising prospect in the clinical transformation of TNBC treatment.
Keywords: DNA damage; chemotherapy; heat shock protein; mild-photothermal therapy; mitoxantrone; polymeric micelle; triple-negative breast cancer (TNBC).
© 2023 The Authors. Advanced Science published by Wiley-VCH GmbH.
Conflict of interest statement
The authors declare no conflict of interest.
Figures
Similar articles
-
Treatment of triple negative breast cancer by near infrared light triggered mild-temperature photothermal therapy combined with oxygen-independent cytotoxic free radicals.Acta Biomater. 2022 Aug;148:218-229. doi: 10.1016/j.actbio.2022.06.011. Epub 2022 Jun 12. Acta Biomater. 2022. PMID: 35705171
-
Mitoxantrone as photothermal agents for ultrasound/fluorescence imaging-guided chemo-phototherapy enhanced by intratumoral H2O2-Induced CO.Biomaterials. 2020 Sep;252:120111. doi: 10.1016/j.biomaterials.2020.120111. Epub 2020 May 11. Biomaterials. 2020. PMID: 32422493
-
γ-Fe2 O3 Loading Mitoxantrone and Glucose Oxidase for pH-Responsive Chemo/Chemodynamic/Photothermal Synergistic Cancer Therapy.Adv Healthc Mater. 2022 Jun;11(11):e2102632. doi: 10.1002/adhm.202102632. Epub 2022 Feb 15. Adv Healthc Mater. 2022. PMID: 35107866
-
Recent Advances of Nanotechnology in the Diagnosis and Therapy of Triple- Negative Breast Cancer (TNBC).Curr Pharm Biotechnol. 2022;23(13):1581-1595. doi: 10.2174/1389201023666211230113658. Curr Pharm Biotechnol. 2022. PMID: 34967294 Review.
-
Gold Nanoparticles in Triple-Negative Breast Cancer Therapeutics.Curr Med Chem. 2023;30(3):316-334. doi: 10.2174/0929867328666210902141257. Curr Med Chem. 2023. PMID: 34477507 Review.
Cited by
-
A metal-organic nanoframework for efficient colorectal cancer immunotherapy by the cGAS-STING pathway activation and immune checkpoint blockade.J Nanobiotechnology. 2024 Sep 30;22(1):592. doi: 10.1186/s12951-024-02836-3. J Nanobiotechnology. 2024. PMID: 39343911 Free PMC article.
-
A nanocarrier system based on CQDs for efficient mitoxantrone drug delivery.Heliyon. 2024 May 23;10(11):e31674. doi: 10.1016/j.heliyon.2024.e31674. eCollection 2024 Jun 15. Heliyon. 2024. PMID: 38841446 Free PMC article.
-
Near-infrared-responsive Prussian blue nanocages loaded with 5-fluorouracil for combined chemotherapy and photothermal therapy in tumor treatment.RSC Adv. 2024 Aug 9;14(34):24942-24951. doi: 10.1039/d4ra04609a. eCollection 2024 Aug 5. RSC Adv. 2024. PMID: 39131498 Free PMC article.
-
Molecular mechanism of oroxyli semen against triple-negative breast cancer verified by bioinformatics and in vitro experiments.Medicine (Baltimore). 2023 Sep 15;102(37):e34835. doi: 10.1097/MD.0000000000034835. Medicine (Baltimore). 2023. PMID: 37713894 Free PMC article.
-
pH-Responsive Charge-Reversal Smart Nanoparticles for Co-Delivery of Mitoxantrone and Copper Ions to Enhance Breast Cancer Chemo-Chemodynamic Combination Therapy.Int J Nanomedicine. 2024 Nov 7;19:11445-11462. doi: 10.2147/IJN.S479125. eCollection 2024. Int J Nanomedicine. 2024. PMID: 39530107 Free PMC article.
References
-
- Siegel R. L., Miller K. D., Fuchs H. E., Jemal A., CA‐Cancer J. Clin. 2022, 72, 7. - PubMed
-
- Harbeck N., Penault‐Llorca F., Cortes J., Gnant M., Houssami N., Poortmans P., Ruddy K., Tsang J., Cardoso F., Nat. Rev. Dis. Primers 2019, 5, 66. - PubMed
-
- Foulkes W. D., Smith I. E., Reis‐Filho J. S., N. Engl. J. Med. 2010, 363, 1938. - PubMed
-
- Gluz O., Nitz U. A., Harbeck N., Ting E., Kates R., Herr A., Lindemann W., Jackisch C., Berdel W. E., Kirchner H., Metzner B., Werner F., Schütt G., Frick M., Poremba C., Diallo‐Danebrock R., Mohrmann S., Ann. Oncol. 2008, 19, 861. - PubMed
Publication types
MeSH terms
Substances
Grants and funding
- 2021YFA1201000/National Key Research & Development Program of China
- 2018YFE0117800/National Key Research & Development Program of China
- 82102204/National Natural Science Foundation of China
- 32030060/National Natural Science Foundation of China (NSFC) key project
- 51861135103/NSFC international collaboration key project
LinkOut - more resources
Full Text Sources