. 2023 May 22;58(10):866-884.e8.
doi: 10.1016/j.devcel.2023.03.014. Epub 2023 Apr 12.

ATG5 provides host protection acting as a switch in the atg8ylation cascade between autophagy and secretion

Affiliations

ATG5 provides host protection acting as a switch in the atg8ylation cascade between autophagy and secretion

Fulong Wang et al. Dev Cell. .

Abstract

ATG5 is a part of the E3 ligase directing lipidation of ATG8 proteins, a process central to membrane atg8ylation and canonical autophagy. Loss of Atg5 in myeloid cells causes early mortality in murine models of tuberculosis. This in vivo phenotype is specific to ATG5. Here, we show using human cell lines that absence of ATG5, but not of other ATGs directing canonical autophagy, promotes lysosomal exocytosis and secretion of extracellular vesicles and, in murine Atg5fl/fl LysM-Cre neutrophils, their excessive degranulation. This is due to lysosomal disrepair in ATG5 knockout cells and the sequestration by an alternative conjugation complex, ATG12-ATG3, of ESCRT protein ALIX, which acts in membrane repair and exosome secretion. These findings reveal a previously undescribed function of ATG5 in its host-protective role in murine experimental models of tuberculosis and emphasize the significance of the branching aspects of the atg8ylation conjugation cascade beyond the canonical autophagy.

Keywords: ATG5; ESCRT; SARS-CoV-2; atg8ylation; autophagy; coronavirus; exosomes; lysosome; neutrophils; tuberculosis.


Conflict of interest statement

Declaration of interests The authors declare no competing interests.

Figures
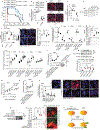
Figure 1.
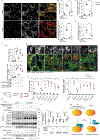
Figure 1.. Loss of ATG5 but not of other ATGs renders lysosomes excessively susceptible to damage
A, Survival curves (mice) post aerosol challenge with Mtb (Erdman; initial lung deposition of 305 CFU). Log-rank (Montel-Cox) test. B, Quantification and C, representative images of LysoTracker Red (LTR) puncta in bone marrow derived macrophage (BMMs) isolated from Atg5fl/fl LysM-Cre, Atg5fl/fl LysM-Cre+, Atg7fl/fl LysM-Cre, Atg7fl/fl LysM-Cre+ mice treated with 2 mM of LLOMe for 1 h using High Content Microscopy (HCM). Data, means ± SE (n≥4); unpaired t-test. Each data point represents independent biological replicates with BMMs from different animals. D, HCM quantification of LTR in BMMs subjected to CRISPR inactivation of Atg5 gene (Atg5BMM-CRISPR-KO) compared to Atg5BMM-WT control guide RNA treated cells. Data, means ± SE (n=3); unpaired t-test. E, Immunoblots, Huh7 and mutant cells. F, HCM quantification and G, representative image of LTR puncta in Huh7ATG5-WT and Huh7ATG5-KO cells treated with 1 mM LLOMe for 30 min. Data, means ± SE (n=5); two-way ANOVA with Tukey’s multiple comparisons. Inset, ratio of LTR puncta in Huh7ATG5-WT and Huh7ATG5-KO cells treated:untreated with LLOMe. H, HCM quantification of LAMP2 puncta in Huh7ATG5-WT and Huh7ATG5-KO cells treated with 1 mM LLOMe for 30 min. Data, means ± SE (n=3); two-way ANOVA with Tukey’s multiple comparisons. I, HCM quantification of LTR puncta in HeLa (2 mM LLOMe, 30 min), A549 and U2OS (1 mM LLOMe, 30 min) and mutant cells. Data, means ± SE (n=5); unpaired t-test. J, HCM quantification of LTR puncta in Huh7 and mutant (1 mM LLOMe, 30 min). Data, means ± SE (n=4); one-way ANOVA with Tukey’s multiple comparisons. K, HCM quantification of Gal3 puncta in cell lines and under conditions as in panel I. Data, means ± SE (n=6); two-way ANOVA with Tukey’s multiple comparisons. L, HCM quantification of Gal3 puncta in BMMs from Atg5fl/fl LysM-Cre and Atg5fl/fl LysM-Cre+ mice treated with 2 mM LLOMe for 1 h. Data, means ± SE (n=4); two-way ANOVA with Tukey’s multiple comparisons. Each point represents independent biological replicate from BMMs derived from bone marrows of different animals. M, Immunoblot (top) and HCM quantification (bottom) of Gal3 puncta in PaTu-8902WT and PaTu-8902ATG5-KO cells treated or not with 1.5 mM LLOMe for 30 min. Data, means ± SE (n=3); two-way ANOVA with Tukey’s multiple comparisons. N, HCM quantification of Gal3 puncta in HeLaATG5-WT and HeLaATG5-KO cells treated with silica. Data, means ± SE (n=6); unpaired t-test. O, HCM quantification of Gal3 puncta in A549ATG5-WTand A549ATG5-KO cells overexpressing mCherry or mCherry-ORF3aSARS-CoV-2. Data, means ± SE (n=5); two-way ANOVA with Tukey’s multiple comparisons. P, HCM quantification and representative image of Gal3 puncta in Huh7 and mutant cells (1 mM LLOMe, 30 min). Data, means ± SE (n=4); One-way ANOVA with Tukey’s multiple comparisons. Q, Immunoblot of Huh7WT and Huh7ATG5-KO cells overexpressing or not overexpressing mCherry-ATG5WT or mCherry-ATG5K130R. R, HCM quantification and S, representative image of Gal3 puncta in HeLaATG5-WT and HeLaATG5-KO cells control or transfected with mCherry-ATG5WT or mCherry-ATG5K130R (2 mM LLOMe, 30 min). Data, means ± SE (n=3); unpaired t-test. T, Summary of the findings in Figure 1. In all HCM graphs, each individual data point represents independent biological replicate, with values based on 49–64 fields/well, >500 primary objects (cells) per well, 5 wells per sample (used only for sampling error) with bars denoting the mean for the biological replicates and standard errors of the mean. Statistical significance symbols in all panels, †p≥0.05, *p<0.05, **p<0.01.
Figure 2.
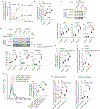
Figure 2.. ATG5 is required for recruitment of ESCRTs to repair damaged lysosomes
A, Representative confocal images of ALIX and LAMP1 staining in Huh7ATG5-WT and Huh7ATG5-KO cells treated with 1 mM LLOMe for 30 min. Scale bars, 10 μm. B&C, HCM quantification of ALIX puncta and ALIX-LAMP1 overlap in Huh7ATG5-WT and Huh7ATG5-KO cells treated with or without 1 mM LLOMe for 30 min. Data, means ± SE (n=4); two-way ANOVA with Tukey’s multiple comparisons. D&E, HCM quantification of CHMP4B-LAMP2 overlap and CHMP4B-LAMP2 overlap in Huh7ATG5-WT and Huh7ATG5-KO cells treated as panel B. Data, means ± SE (n=3); two-way ANOVA with Tukey’s multiple comparisons. F, HCM quantification of ALIX puncta and ALIX-LAMP1 overlap in HeLaATG5-WT and HeLaATG5-KO cells transfected with mCherry, mCherry-ATG5WT, or mCherry-ATG5K130R followed by treatment with or without 2 mM LLOMe for 30 min. Data, means ± SE (n=3); unpaired t-test. G, Representative confocal images and H&I, quantification (HCM) of ALIX puncta and ALIX-LAMP1 overlap in Huh7 and mutant cells treated as in panel B. Data, means ± SE (n=3); unpaired t-test. Scale bars, 10 μm. J, Schematic description, K, Immunoblot, and L, quantification of lysosome ESCRT components by anti-HA immunoprecipitation (LysoIP; TMEM192–3xHA) from HeLaATG5-WT and HeLaATG5-KO cells treated as in panel F. Long exp (long exposure) and Short exp (short exposure) correspond to the same blot. Data, means ± SE (n=3); two-way ANOVA with Tukey’s multiple comparisons. M, Summary of the findings in Figure 2. All HCM graphs represent independent biological replicates as in detailed in Figure 1. Statistical significance symbols in all panels, †p≥0.05, *p<0.05, **p<0.01.
Figure 3
Figure 3. Proximity biotinylation proteomics of ATG5 interactors
. A, (i) Stable FlpIn-HeLaAPEX2-ATG5-WT or FlpIn-HeLaAPEX2-ATG5-K130R cells were (ii) incubated with or without 2 mM LLOMe in full medium supplemented with 2 μg/mL tetracycline for 30 min. Biotinylated proteins were captured by HA beads and subjected to DIA MS. (iii), conjugation-independent or conjugation-dependent interactors of ATG5 were determined by relative fold change of FlpIn-HeLaAPEX2-ATG5-K130R and FlpIn-HeLaAPEX2-ATG5-WT cells treated with LLOMe compared with FlpIn-HeLaAPEX2-ATG5-WT cells without LLOMe incubation. B, Volcano plot of mass spec result of FlpIn-HeLaAPEX2-ATG5-WT incubated with or without LLOMe. C, GO terms, pathway enrichment analysis of conjugation-independent proteins.
Figure 4.
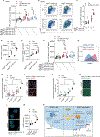
Figure 4.. Lysosomal damage induces extracellular vesicle release and neutrophil degranulation
A, Representative graph of concentration (y-axis), size distribution (x-axis) and B, quantification of EVPs from supernatant of HeLa cells treated with or without 2 mM LLOMe for 1 h using nanoparticle tracking analysis (NTA). Data, means ± SE (n=3); unpaired t-test. C, Representative tracing of concentration, size distribution and D, quantification of EVPs from supernatants of HeLa cells expressing mCherry or mCherry-ORF3a (transient transfection for 24 h) using NTA. Data, means ± SE (n=3); unpaired t-test. E, Quantification of CD63+ extracellular vesicles from supernatant of HeLa cells treated as in panel A using AMNIS. Data, means ± SE (n=3); unpaired t-test. F, Quantification of CD63+ extracellular vesicles from supernatant of HeLa cells transfected with mCherry or mCherry-ORF3a for 42 h using AMNIS. Data, means ± SE (n=3); unpaired t-test. G, Quantification of CD63+ extracellular vesicles from supernatants of BMMs treated as in panel A using AMNIS. Data, means ± SE (n=3); unpaired t-test. H, Quantification of EVPs from supernatant of BMNs (murine bone marrow derived neutrophils) treated with or without 1 mM LLOMe for 1 h using NTA. Data, means ± SE (n=3); unpaired t-test. I, Quantification of CD63+ extracellular vesicles extracted from supernatant of BMNs treated as in panel H using AMNIS. Data, means ± SE (n=3); unpaired t-test. J, Representative flow cytometry and K, quantification of % CD11bHigh Ly6G+ BMNs treated with 1 mM LLOMe for 30 min, or 10μg/ml dihydrocytochalasin B for 5 min followed by 10 μM fMLF for 15 min. Data, means ± SE (n=5); one-way ANOVA with Tukey’s multiple comparisons. L, Mean fluorescence intensity (MFI) of CD11b on BMNs treated as in panel J. Data, means ± SE (n=5); one-way ANOVA with Tukey’s multiple comparisons. M, Quantification of elastase activity in supernatant of BMNs treated as in panel J. Data, means ± SE (n=3); one-way ANOVA with Tukey’s multiple comparisons. In all panels, each data point represents independent biological replicate. For BMM and BMN experiments, each point represents independent biological replicates from different animals. Statistical significance symbols in all panels, †p≥0.05, *p<0.05, **p<0.01.
Figure 5.
Figure 5.. ATG5 knockout enhances EV release in response to lysosomal damage
A, Flow cytometry quantification of CD63+ EVs extracted from supernatant of HeLaATG5-WT and HeLaATG5-KO cells incubated with indicated concentration of LLOMe for 1 h. Data, means ± SE (n=3); two-way ANOVA with Tukey’s multiple comparisons. B, Quantification of EVPs extracted from supernatant of HeLaATG5-WT and HeLaATG5-KO cells treated with or without 2 mM LLOMe for 1 h using NTA. Data, means ± SE (n=3); two-way ANOVA with Tukey’s multiple comparisons. C, Immunoblot and quantification of exosomal markers in EVs isolated from supernatant of HeLaATG5-WT and HeLaATG5-KO cells incubated with 1 mM LLOMe for 1 h. Data, means ± SE (n=3); two-way ANOVA with Tukey’s multiple comparisons. D, Immunoblot and quantification of exosomal markers in EVs isolated from supernatant of HeLaATG5-WT and HeLaATG5-KO cells transfected with mCherry or mCherry-ORF3a for 42 h. Data, means ± SE (n=3); two-way ANOVA with Tukey’s multiple comparisons. E, Quantification (NTA) of EVPs from supernatant as in panel D. Data, means ± SE (n=4); two-way ANOVA with Tukey’s multiple comparisons. F, Flow cytometry quantification of CD63+ EVs extracted from supernatant as in panel D. Data, means ± SE (n=3); two-way ANOVA with Tukey’s multiple comparisons. G, Representative graph of concentration, size distribution and quantification (NTA) of EVPs from supernatant of BMNs from Atg5fl/fl LysM-Cre and Atg5fl/fl LysM-Cre+ mice incubated with or without 0.5 mM LLOMe for 1 h. Data, means ± SE (n=3); two-way ANOVA with Tukey’s multiple comparisons. H, Flow cytometry quantification of CD63+ EVs from supernatant as in panel G. Data, means ± SE (n=5); two-way ANOVA with Tukey’s multiple comparisons. I, Flow cytometry quantification of CD63+ EVs from supernatant of Atg5fl/fl LysM-Cre and Atg5fl/fl LysM-Cre+ BMMs incubated with or without 2 mM LLOMe for 1 h. Data, means ± SE (n=3); two-way ANOVA with Tukey’s multiple comparisons. For BMM and BMN experiments, each point represents independent biological replicates from different. Statistical significance symbols in all panels, †p≥0.05, *p<0.05, **p<0.01.
Figure 6.
Figure 6.. ATG5 knockout enhances PMN degranulation in response to lysosomal damage
A, MFI of CD11b on BMNs incubated with 0.5 mM LLOMe for 30 min, or 10μg/ml dihydrocytochalasin B for 5 min followed by 1 μM fMLF for 15 min. Data, means ± SE (n=4–6); two-way ANOVA with Tukey’s multiple comparisons. B, Representative flow cytometry of BMNs and C, quantification of % CD11bHigh Ly6G+ BMNs from Atg5fl/fl LysM-Cre and Atg5fl/fl LysM-Cre+ mice incubated with or without 0.5 mM LLOMe for 30 min. Data, means ± SE (n=5–6); two-way ANOVA with Tukey’s multiple comparisons. D, MFI of FPR1 on BMNs treated as in panel C. Data, means ± SE (n=3); two-way ANOVA with Tukey’s multiple comparisons. E, Quantification of elastase activity in supernatant of BMNs from Atg5fl/fl LysM-Cre and Atg5fl/fl LysM-Cre+ mice treated as in panel C. Data, means ± SE (n=4–6); two-way ANOVA with Tukey’s multiple comparisons. F, MFI of LAMP2 on Atg5fl/fl LysM-Cre and Atg5fl/fl LysM-Cre+ BMNs treated as in panel A. Data, means ± SE (n=3); two-way ANOVA with Tukey’s multiple comparisons. G, Representative flow cytometry of LAMP2 intensity from Atg5fl/fl LysM-Cre and Atg5fl/fl LysM-Cre+ treated as in panel A. H, HCM quantification and I, representative images of plasma membrane LAMP2 puncta on Huh7WT, Huh7ATG3-KO, Huh7ATG7-KO, and Huh7ATG5KO cells treated with or without 1 mM LLOMe for 30 min. Data, means ± SE (n=3); two-way ANOVA with Tukey’s multiple comparisons. J, HCM quantification and K, representative images of plasma membrane LAMP1 puncta on Huh7 and mutant cells treated with or without 1 mM LLOMe for 30 min. Data, means ± SE (n=3); two-way ANOVA with Tukey’s multiple comparisons. L, Representative confocal images and M, quantification of plasma membrane LAMP1 puncta on HeLaATG5-WT, and HeLaATG5-KO cells treated with or without 2 mM LLOMe for 30 min. Scale bars, 10 μm. Data, means ± SE (n=4); two-way ANOVA with Tukey’s multiple comparisons. Fluorescence intensity was calculated based on ≥20 fields (with a total ≥100 cells) per biological replicate. N. Summary of data in Figure 6. GO (middle panel), ATG5 interactors identified in proteomic analyses. All HCM graphs represent independent biological replicates as in detailed in Figure 1. For BMMs and BMNs experiments, each point represents independent biological replicates with BMNs from different animals. Statistical significance symbols in all panels, †p≥0.05, *p<0.05, **p<0.01.
Figure 7.
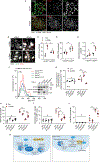
Figure 7.. Alternative conjugation contributes to lysosomal vulnerability and exocytic processes
A, Representative confocal images of Huh7ATG5-WT and Huh7ATG5-KO cells incubated with 1 mM LLOMe for 30 min. Scale bars, 5 μm. B-E, Representative images (B) and quantifications of ALIX puncta (C), ATG3 puncta (D), and ATG3-ALIX overlap area (E) in Huh7ATG5-WT and Huh7ATG5-KO cells treated as panel A. Data, means ± SE (n=3); two-way ANOVA with Tukey’s multiple comparisons. F, Representative graphs and G, quantification of EVPs from supernatant of HeLa and mutant cells treated with 2 mM LLOMe for 30 min. Data, means ± SE (n=3); two-way ANOVA with Tukey’s multiple comparisons. Inset: Immunoblot of HeLa and mutant cells. H-J, HCM quantification of ALIX puncta (H), ALIX-LAMP1 overlap area (I), and Gal3 puncta (J) in Huh7 and mutant cells treated as in panel A. Data, means ± SE (n≥3); two-way ANOVA with Tukey’s multiple comparisons. K, Summary of the mechanistic findings in Figure 7. All HCM graphs represent independent biological replicates as in detailed in Figure 1. Statistical significance symbols in all panels, †p≥0.05, *p<0.05, **p<0.01.

Similar articles

Cited by

References

    1. Mizushima N, Levine B, Cuervo AM, and Klionsky DJ (2008). Autophagy fights disease through cellular self-digestion. Nature 451, 1069–1075. - PMC - PubMed
    1. Morishita H, and Mizushima N (2019). Diverse Cellular Roles of Autophagy. Annu Rev Cell Dev Biol 35, 453–475. 10.1146/annurev-cellbio-100818-125300. - DOI - PubMed
    1. Levine B, and Kroemer G (2019). Biological Functions of Autophagy Genes: A Disease Perspective. Cell 176, 11–42. 10.1016/j.cell.2018.09.048. - DOI - PMC - PubMed
    1. Galluzzi L, and Green DR (2019). Autophagy-Independent Functions of the Autophagy Machinery. Cell 177, 1682–1699. 10.1016/j.cell.2019.05.026. - DOI - PMC - PubMed
    1. Deretic V, and Lazarou M (2022). A guide to membrane atg8ylation and autophagy with reflections on immunity. J Cell Biol 221. 10.1083/jcb.202203083. - DOI - PMC - PubMed

Publication types

Substances