. 2023 Apr 6;15(7):2689-2704.
doi: 10.18632/aging.204639. Epub 2023 Apr 6.

Long noncoding RNA POU6F2-AS2 contributes to the aggressiveness of nonsmall-cell lung cancer via microRNA-125b-5p-mediated E2F3 upregulation

Affiliations

Long noncoding RNA POU6F2-AS2 contributes to the aggressiveness of nonsmall-cell lung cancer via microRNA-125b-5p-mediated E2F3 upregulation

Haitao Yang et al. Aging (Albany NY). .

Abstract

The role of the majority of long noncoding RNAs (lncRNAs) in the progression of nonsmall-cell lung cancer (NSCLC) remains elusive, despite their potential value, thus warranting in-depth studies. For example, detailed functions of the lncRNA POU6F2 antisense RNA 2 (POU6F2-AS2) in NSCLC are unknown. Herein, we investigated the expression status of POU6F2-AS2 in NSCLC. Furthermore, we systematically delineated the biological roles of POU6F2-AS2 in NSCLC alongside its downstream molecular events. We measured the expression levels of POU6F2-AS2 using quantitative real-time polymerase chain reaction and performed a series of functional experiments to address its regulatory effects in NSCLC cells. Using bioinformatic platforms, RNA immunoprecipitation, luciferase reporter assays, and rescue experiments, we investigated the potential mechanisms of POU6F2-AS2 in NSCLC. Subsequently, we confirmed the remarkable overexpression of POU6F2-AS2 in NSCLC using The Cancer Genome Atlas database and our own cohort. Functionally, inhibiting POU6F2-AS2 decreased NSCLC cell proliferation, colony formation, and motility, whereas POU6F2-AS2 overexpression exhibited contrasting effects. Mechanistically, POU6F2-AS2 acts as an endogenous decoy for microRNA-125b-5p (miR-125b-5p) in NSCLC that causes the overexpression of the E2F transcription factor 3 (E2F3). Moreover, suppressing miR-125b-5p or increasing E2F3 expression levels sufficiently recovered the anticarcinostatic activities in NSCLC induced by POU6F2-AS2 silencing. Thus, POU6F2-AS2 aggravates the oncogenicity of NSCLC by targeting the miR-125b-5p/E2F3 axis. Our findings suggest that POU6F2-AS2 is a novel therapeutic target for NSCLC.

Keywords: E2F transcription factor 3; NSCLC progression; POU6F2 antisense RNA 2; microRNA.


Conflict of interest statement

CONFLICTS OF INTEREST: The authors declare that the research was conducted in the absence of any commercial or financial relationships that could be construed as potential conflicts of interest.

Figures

Figure 1
Figure 1
POU6F2-AS2 is overexpressed in NSCLC. (A) POU6F2-AS2 ranks the 2nd overexpressed lncRNA in LUSC. (B) POU6F2-AS2 level in LUAD and LUSC from TCGA database. **P < 0.001 vs. normal group. (C) POU6F2-AS2 level in NSCLC tissues compared with normal tissues from our own cohort. **P < 0.001 vs. normal group. (D) POU6F2-AS2 level in NSCLC cell lines. **P < 0.001 vs. BEAS2-2B.
Figure 2
Figure 2
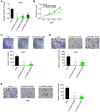
Disturbing POU6F2-AS2 expression hampers the malignant phenotype of NSCLC cells. (A) The knockdown efficiency of si-POU6F2-AS2 in H460 cells was uncovered by qRT-PCR. ***P < 0.001 vs. si-NC group. (B and C) The proliferation and colony-forming of POU6F2-AS2-silenced H460 cells. **P < 0.001 vs. si-NC group. (D and E) The motility of H460 cells after POU6F2-AS2 downregulation. **P < 0.001 vs. si-NC group.
Figure 3
Figure 3
POU6F2-AS2 upregulation promotes the aggressiveness of NSCLC cells. (A) The transfection efficiency of pc-POU6F2-AS2 in SK-MES-1 cells. **P < 0.001 vs. pcDNA3.1 group. (B and C) The proliferation and colony formation of POU6F2-AS2-overexpressed SK-MES-1 cells. *P < 0.01 vs. pcDNA3.1 group. **P < 0.001 vs. pcDNA3.1 group. (D and E) The motility of SK-MES-1 cells after POU6F2-AS2 upregulation. **P < 0.001 vs. pcDNA3.1 group.
Figure 4
Figure 4
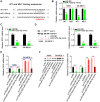
POU6F2-AS2 executes as a miR-125b-5p sponge in NSCLC. (A) The location of POU6F2-AS2 predicted by lncLocator. (B) The detection of the POU6F2-AS2’s subcellular location by nuclear–cytoplasmic fractionation assay. (C) Expression of miR-125b-5p and miR-223-3p in LUAD and LUSC samples from TCGA database. *P < 0.01 and **P < 0.001 vs. normal group. (D) Expression of the aforementioned candidates in NSCLC cells after disturbing POU6F2-AS2 level. **P < 0.001 vs. si-NC group. (E) The binding sequences between POU6F2-AS2 and miR-125b-5p. (F) Luciferase activity induced by WT-POU6F2-AS2 or MUT-POU6F2-AS2 was examined in NSCLC after miR-NC or miR-125b-5p mimic transfection. **P < 0.001 vs. miR-NC group. (G) RIP experiment corroborated the interaction between POU6F2-AS2 and miR-125b-5p. **P < 0.001 vs. IgG group.
Figure 5
Figure 5
miR-125b-5p exerts anti-tumor actions in NSCLC cells. (A) The efficiency of miR-125b-5p mimic in NSCLC cells. **P < 0.001 vs. miR-NC group. (B and C) The proliferation and colony-forming of NSCLC cells after miR-125b-5p overexpression. **P < 0.001 vs. miR-NC group. (D and E) The motility of NSCLC cells after being transfected with miR-NC or miR-125b-5p mimic. **P < 0.001 vs. miR-NC group.
Figure 6
Figure 6
E2F3, a target of miR-125b-5p, is controlled by POU6F2-AS2 in NSCLC cells. (A) miR-125b-5p possessed binding sequences within E2F3. (B) Luciferase activity induced by WT-E2F3 or MUT-E2F3 was examined in NSCLC after miR-125b-5p upregulation. **P < 0.001 vs. miR-NC group. (C and D) MTDH mRNA and protein levels in miR-125b-5p overexpressed-NSCLC cells. **P < 0.001 vs. miR-NC group. (E and F) H460 cells were transfected with si-NC, si-POU6F2-AS2, si-POU6F2-AS2+NC inhibitor, or si-POU6F2-AS2+miR-125b-5p inhibitor. SK-MES-1 cells were transfected with pcDNA3.1, pc-POU6F2-AS2, pc-POU6F2-AS2+miR-NC, or pc-POU6F2-AS2+miR-125b-5p mimic. After transfection, the quantification of E2F3 levels was conducted. **P < 0.001 vs. si-NC and pcDNA3.1 groups. ##P < 0.001 vs. si-POU6F2-AS2+NC inhibitor and pc-POU6F2-AS2+miR-NC groups.
Figure 7
Figure 7
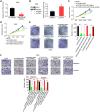
miR-125b-5p inhibition or E2F3 upregulation reverses the repressing effects of si-POU6F2-AS2 in NSCLC cells. (A) The interference efficiency of miR-125b-5p inhibitor in H460 cells. **P < 0.001 vs. NC inhibitor group. (B) The transfection efficiency of pc-E2F3 in H460 cells by western blotting. **P < 0.001 vs. pcDNA3.1 group. (CE) H460 cells were transfected with si-NC, si-POU6F2-AS2, si-POU6F2-AS2+NC inhibitor, si-POU6F2-AS2+miR-125b-5p inhibitor, si-POU6F2-AS2+pcDNA3.1, or si-POU6F2-AS2+pc-E2F3. The capacities of proliferative and colony formation were, respectively, measured by CCK-8 and colony formation assays. (F) Transwell migration and invasion assays of the motility of H460 cells treated as abovementioned. **P < 0.001 vs. si-NC group; ##P < 0.001 vs. si-POU6F2-AS2+NC inhibitor group; &&P < 0.001 vs. si-POU6F2-AS2+pc-E2F3 group.
Figure 8
Figure 8
miR-125b-5p overexpression or E2F3 knockdown counteracts the actions triggered by pc-POU6F2-AS2 in NSCLC cells. (A) E2F3 level in SK-MES-1 cells after pc-E2F3 or pcDNA3.1 transfection. **P < 0.001 vs. si-NC group. (B and C) POU6F2-AS2-overexpressed SK-MES-1 cells were treated with miR-125b-5p mimic or pc-E2F3. The assessment of cell proliferation and colony formation was implemented applying CCK-8 and colony formation assays, respectively. *P < 0.01 and **P < 0.001 vs. pcDNA3.1 group. ##P < 0.001 vs. pc-POU6F2-AS2+miR-NC and pc-POU6F2-AS2+si-NC groups. (D) Transwell migration and invasion assays were operated to measure cell motility in abovementioned cells. **P < 0.001 vs. si-NC group. ##P < 0.001 vs. pc-POU6F2-AS2+miR-NC group. &&P < 0.001 vs. pc-POU6F2-AS2+si-NC group.
Figure 9
Figure 9
POU6F2-AS2 downregulation represses tumor growth in vivo. (A) The representative image of xenografted tumor tissues. (B and C) The growth curves and weight of xenografted tumor tissues. **P < 0.001 vs. sh-NC group. (D) miR-125b-5p and POU6F2-AS2 levels in xenografted tumor tissues. **P < 0.001 vs. sh-NC group. (E) E2F3 protein level in xenografted tumor tissues. **P < 0.001 vs. sh-NC group.

Similar articles

Cited by

References

    1. Siegel RL, Miller KD, Fuchs HE, Jemal A. Cancer Statistics, 2021. CA Cancer J Clin. 2021; 71:7–33. 10.3322/caac.21654 - DOI - PubMed
    1. Bray F, Ferlay J, Soerjomataram I, Siegel RL, Torre LA, Jemal A. Global cancer statistics 2018: GLOBOCAN estimates of incidence and mortality worldwide for 36 cancers in 185 countries. CA Cancer J Clin. 2018; 68:394–424. 10.3322/caac.21492 - DOI - PubMed
    1. Sun J, Wu S, Jin Z, Ren S, Cho WC, Zhu C, Shen J. Lymph node micrometastasis in non-small cell lung cancer. Biomed Pharmacother. 2022; 149:112817. 10.1016/j.biopha.2022.112817 - DOI - PubMed
    1. Bade BC, Dela Cruz CS. Lung Cancer 2020: Epidemiology, Etiology, and Prevention. Clin Chest Med. 2020; 41:1–24. 10.1016/j.ccm.2019.10.001 - DOI - PubMed
    1. Duma N, Santana-Davila R, Molina JR. Non-Small Cell Lung Cancer: Epidemiology, Screening, Diagnosis, and Treatment. Mayo Clin Proc. 2019; 94:1623–40. 10.1016/j.mayocp.2019.01.013 - DOI - PubMed

Publication types

MeSH terms