. 2023 Apr 4;24(7):6754.
doi: 10.3390/ijms24076754.

NAGS, CPS1, and SLC25A13 (Citrin) at the Crossroads of Arginine and Pyrimidines Metabolism in Tumor Cells

Affiliations

NAGS, CPS1, and SLC25A13 (Citrin) at the Crossroads of Arginine and Pyrimidines Metabolism in Tumor Cells

Melissa Owusu-Ansah et al. Int J Mol Sci. .

Abstract

Urea cycle enzymes and transporters collectively convert ammonia into urea in the liver. Aberrant overexpression of carbamylphosphate synthetase 1 (CPS1) and SLC25A13 (citrin) genes has been associated with faster proliferation of tumor cells due to metabolic reprogramming that increases the activity of the CAD complex and pyrimidine biosynthesis. N-acetylglutamate (NAG), produced by NAG synthase (NAGS), is an essential activator of CPS1. Although NAGS is expressed in lung cancer derived cell lines, expression of the NAGS gene and its product was not evaluated in tumors with aberrant expression of CPS1 and citrin. We used data mining approaches to identify tumor types that exhibit aberrant overexpression of NAGS, CPS1, and citrin genes, and evaluated factors that may contribute to increased expression of the three genes and their products in tumors. Median expression of NAGS, CPS1, and citrin mRNA was higher in glioblastoma multiforme (GBM), glioma, and stomach adenocarcinoma (STAD) samples compared to the matched normal tissue. Median expression of CPS1 and citrin mRNA was higher in the lung adenocarcinoma (LUAD) sample while expression of NAGS mRNA did not differ. High NAGS expression was associated with an unfavorable outcome in patients with glioblastoma and GBM. Low NAGS expression was associated with an unfavorable outcome in patients with LUAD. Patterns of DNase hypersensitive sites and histone modifications in the upstream regulatory regions of NAGS, CPS1, and citrin genes were similar in liver tissue, lung tissue, and A549 lung adenocarcinoma cells despite different expression levels of the three genes in the liver and lung. Citrin gene copy numbers correlated with its mRNA expression in glioblastoma, GBM, LUAD, and STAD samples. There was little overlap between NAGS, CPS1, and citrin sequence variants found in patients with respective deficiencies, tumor samples, and individuals without known rare genetic diseases. The correlation between NAGS, CPS1, and citrin mRNA expression in the individual glioblastoma, GBM, LUAD, and STAD samples was very weak. These results suggest that the increased cytoplasmic supply of either carbamylphosphate, produced by CPS1, or aspartate may be sufficient to promote tumorigenesis, as well as the need for an alternative explanation of CPS1 activity in the absence of NAGS expression and NAG.

Keywords: CAD complex; N-acetylglutamate synthase; carbamylphosphate synthetase 1; citrin; pyrimidine biosynthesis; tumor; tumorigenesis; urea cycle.


Conflict of interest statement

Ljubica Caldovic’s work was supported by the Recordati Rare Diseases, Inc. that manufactures and sells NCG as Carbaglu® (carglumic acid), which is used for the treatment of NAGS deficiency. Other manuscript authors declare no conflict of interest.

Figures

Figure 3
Figure 3
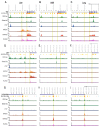
Epigenetic regulation of NAGS (AC), CPS1 (DF), and citrin (GI) in the liver tissue (A,D,G), A549 cell line (B,E,H), and lung tissue (C,F,I). Chromatin accessibility (ATAC-Seq and DNase-Seq shown in light and dark green, respectively), CTCF binding (blue), acetylation of histone H3 lysine 27 (H3K27ac, shown in light orange), tri-methylation of histone H3 lysine 4 (H3K4me3, shown in dark orange), and binding of the 2A subunit of RNA polymerase II (POLR2A, shown in magenta) are shown for the following genomic regions: whole NAGS gene, approx. 10.5 kb of the upstream regulatory region and 1 kb downstream of the NAGS (chr17: 43,994,000–44,010,000); first exon of the CPS1 gene, approx. 35 kb of the upstream regulatory region and approx. 10 kb of the first CPS1 intron (chr2: 210,522,000–210,567,000); first and second exons of the citrin gene, first intron of the citrin gene, and approx. 25 kb of the upstream regulatory region (chr7: 96,296,000–96,348,000). Predicted cCREs: promoters–red, proximal enhancers–orange, distal enhancers–yellow, chromatin insulators–blue.
Figure 4
Figure 4
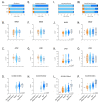
Copy number variation and NAGS, CPS1, and citrin mRNA expression. Fraction of glioblastoma (A), glioblastoma multiforme (E), lung adenocarcinoma (I) and stomach adenocarcinoma (M) samples with deep deletions, shallow deletions, two copies, gain and amplification of NAGS, CPS1, and citrin genes. Relationship between copy number and NAGS (B,F,J,N), CPS1 (C,G,K,O) and citrin (D,H,L,P) mRNA expression. Brown–deep deletion, orange–shallow deletion, light blue–diploid, medium blue–gain, dark blue–amplification of the genomic regions of interest.
Figure 6
Figure 6
NAGS, CPS1, and citrin missense variants in urea cycle patients, tumors, and individuals without rare genetic disorders. (A) Venn diagrams showing overlap between NAGS, CPS1, or citrin missense variants found in patients with respective deficiencies, tumors, and gnomAD. (BD) REVEL scores of NAGS (B), CPS1 (C) and citrin (D) missense variants found in patients (blue), tumors (green), and gnomAD (orange). Yellow–REVEL scores that indicate damaging effect of missense variants on protein function; gray–REVEL scores indicating that missense variants are tolerated and do not affect protein function. (EG) Fraction of sequence variants with REVEL scores indicating strength of evidence for either damaging or benign effect of missense variant on NAGS (E), CPS1 (F) and citrin (G) function in patients with respective deficiencies, tumor samples, and gnomAD. Brown–strong evidence for damaging effect on protein function; orange–moderate evidence for damaging effect on protein function; light orange–supporting evidence for damaging effect on protein function; gray–uncertain effect on protein function; light blue–supporting evidence for benign effect on protein function; dark blue–moderate evidence for benign effect on protein function.
Figure 1
Figure 1
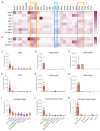
Expression of urea cycle genes in tumors and normal tissues. Fold-change of the median mRNA expression of all eight urea cycle genes (A) and NAGS, CPS1 and citrin mRNA (B) in tumor samples and the matched normal tissues. Depending on the tumor type, the number of tumor samples considered here was between 36 and 1100. Orange boxes—tumors that overexpress NAGS, CPS1, and citrin. Blue box—lung adenocarcinoma overexpressing citrin. Urea cycle gene symbols: NAGS–N-acetylglutamate synthase; CPS1–carbamylphosphate synthetase; OTC–ornithine transcarbamylase; ASS1–argininosuccinate synthetase 1; ASL–argininosuccinate lyase; ARG1–arginase 1; ORNT–ornithine transporter encoded by the SLC25A15 gene; SLC25A13–glutamate/aspartate transporter, also known as citrin. Abundance of NAGS (C), CPS1 (F) and citrin (I) mRNA in the liver, small intestine, stomach, esophagus, brain, and lung tissues in GTEx project. TPM–Transcripts per kilobase per million reads. Abundance of NAGS (D), CPS1 (G) and citrin (J) proteins in the liver, small intestine, stomach, esophagus, brain, and lung tissues in the GTEx project. Abundance of NAGS (E), CPS1 (H) and citrin (K) in the liver, small intestine, stomach, esophagus, brain, and lung tissues reported in ProteomicsDB. iBAQ–total intensity of precursor peptide ions divided by the number of theoretically observable peptides of the protein. Tumor type symbols: BLCA–bladder urothelial carcinoma; BRCA–breast invasive carcinoma; CESC–cervical and endocervical cancers; COAD–colon adenocarcinoma; COADRED–colorectal adenocarcinoma; GBM–glioblastoma multiforme; GBMLGG–glioma; HNSC–head and neck squamous cell carcinoma; KICH–kidney chromophobe; KIPAN–pan-kidney cohort (KICH + KIRC + KIRP); KIRC–kidney renal clear cell carcinoma; KIRP–kidney renal papillary cell carcinoma; LIHC–liver hepatocellular carcinoma; LUAD–lung adenocarcinoma; LUSC–lung small cell carcinoma; PPAD–pancreatic adenocarcinoma; PCPG–pheochromocytoma and paraganglioma; PRAD–prostate adenocarcinoma; READ–rectum adenocarcinoma; SARC–sarcoma; SKCM–skin cutaneous melanoma; STAD–stomach adenocarcinoma; STES–stomach and esophageal carcinoma; THCA–thyroid carcinoma; THYM–thymoma; UCEC–uterine corpus endometrial carcinoma.
Figure 2
Figure 2
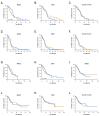
Association between expression of NAGS, CPS1, and citrin mRNA in tumors and patient outcomes. Kaplan–Meier curves showing survival of patients with glioblastoma (AC), glioblastoma multiforme (DF), lung adenocarcinoma (GI) and stomach adenocarcinoma (JL), exhibiting highest and lowest levels of NAGS, CPS1, and citrin mRNA expression. Orange–tumors in the highest quartile of mRNA expression; blue–tumors in the lowest quartile of mRNA expression.
Figure 5
Figure 5
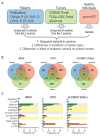
NAGS, CPS1, and citrin single nucleotide variants and small indels in urea cycle patients, tumors, and individuals without rare genetic diseases. (A) Strategy used to collect and analyze sequence variants found in the three groups of samples. (B) Venn diagrams showing overlap between NAGS, CPS1, or citrin sequence variants found in patients with respective deficiencies, tumors and gnomAD. (C) Distribution of NAGS, CPS1, and citrin variant types and their functional effects in patients (blue), tumors (green) and gnomAD (orange).
Figure 7
Figure 7
Correlation between NAGS and CPS1 mRNA expression (top), NAGS and citrin mRNA expression (middle), and citrin and CPS1 mRNA expression (bottom) in individual glioblastoma, glioblastoma multiforme, lung adenocarcinoma, and stomach glioblastoma samples. Spearman correlation coefficient was calculated to infer the relationship between mRNA expression levels in individual tumor samples.
Figure 8
Figure 8
Correlation between citrin and CPS1 protein abundance in individual glioblastoma (left) and lung adenocarcinoma (right) samples. Spearman correlation coefficient was calculated to infer the relationship between protein abundance in individual tumor samples.

Similar articles

Cited by

References

    1. Jin G., Reitman Z.J., Duncan C.G., Spasojevic I., Gooden D.M., Rasheed B.A., Yang R., Lopez G.Y., He Y., McLendon R.E., et al. Disruption of wild-type IDH1 suppresses D-2-hydroxyglutarate production in IDH1-mutated gliomas. Cancer Res. 2013;73:496–501. doi: 10.1158/0008-5472.CAN-12-2852. - DOI - PMC - PubMed
    1. Jin G., Pirozzi C.J., Chen L.H., Lopez G.Y., Duncan C.G., Feng J., Spasojevic I., Bigner D.D., He Y., Yan H. Mutant IDH1 is required for IDH1 mutated tumor cell growth. Oncotarget. 2012;3:774–782. doi: 10.18632/oncotarget.577. - DOI - PMC - PubMed
    1. Sonoda Y., Kumabe T., Nakamura T., Saito R., Kanamori M., Yamashita Y., Suzuki H., Tominaga T. Analysis of IDH1 and IDH2 mutations in Japanese glioma patients. Cancer Sci. 2009;100:1996–1998. doi: 10.1111/j.1349-7006.2009.01270.x. - DOI - PMC - PubMed
    1. Hartmann C., Meyer J., Balss J., Capper D., Mueller W., Christians A., Felsberg J., Wolter M., Mawrin C., Wick W., et al. Type and frequency of IDH1 and IDH2 mutations are related to astrocytic and oligodendroglial differentiation and age: A study of 1010 diffuse gliomas. Acta Neuropathol. 2009;118:469–474. doi: 10.1007/s00401-009-0561-9. - DOI - PubMed
    1. Yan H., Parsons D.W., Jin G., McLendon R., Rasheed B.A., Yuan W., Kos I., Batinic-Haberle I., Jones S., Riggins G.J., et al. IDH1 and IDH2 mutations in gliomas. N. Engl. J. Med. 2009;360:765–773. doi: 10.1056/NEJMoa0808710. - DOI - PMC - PubMed

LinkOut - more resources