. 2023 Jul 3;222(7):e202206061.
doi: 10.1083/jcb.202206061. Epub 2023 Apr 12.

SIR telomere silencing depends on nuclear envelope lipids and modulates sensitivity to a lysolipid

Affiliations

SIR telomere silencing depends on nuclear envelope lipids and modulates sensitivity to a lysolipid

Maria Laura Sosa Ponce et al. J Cell Biol. .

Abstract

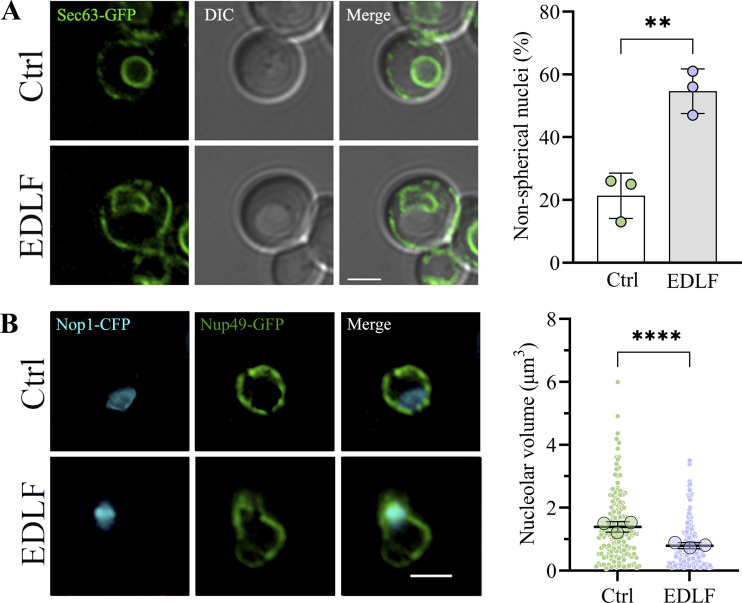
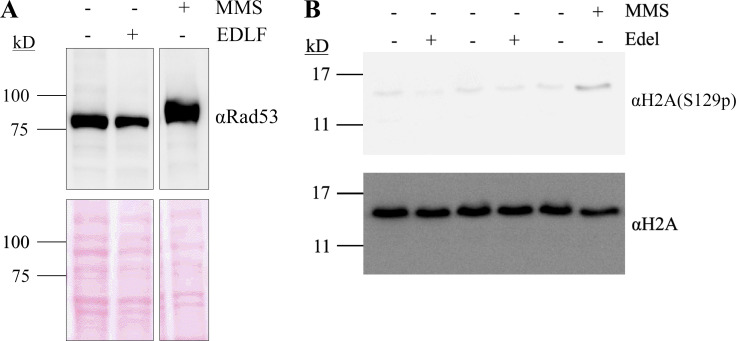
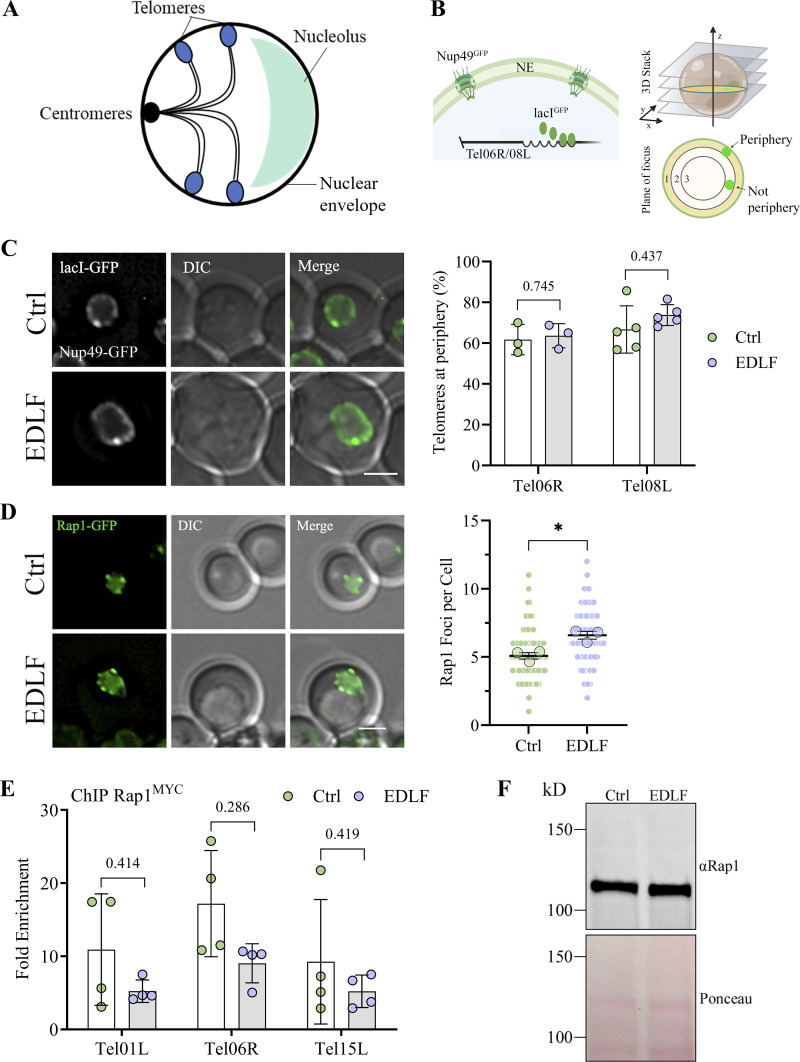
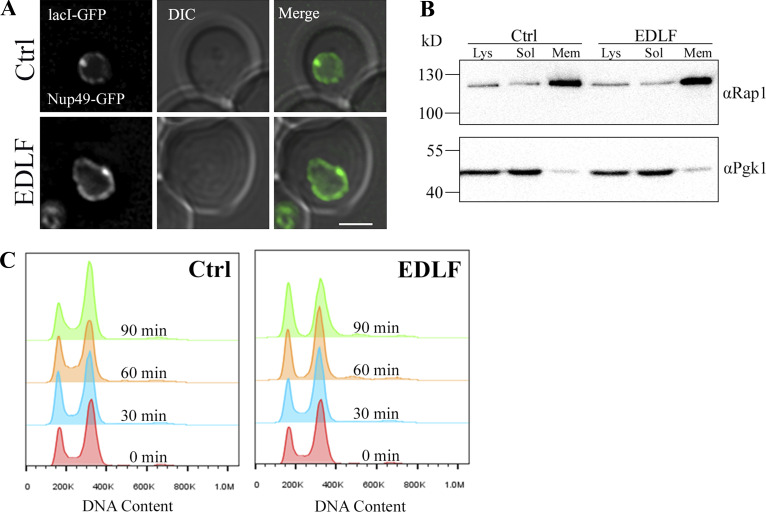
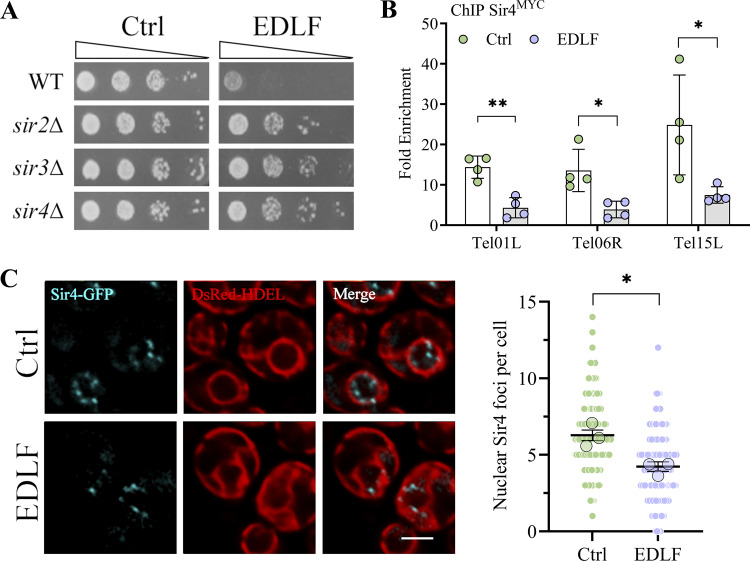
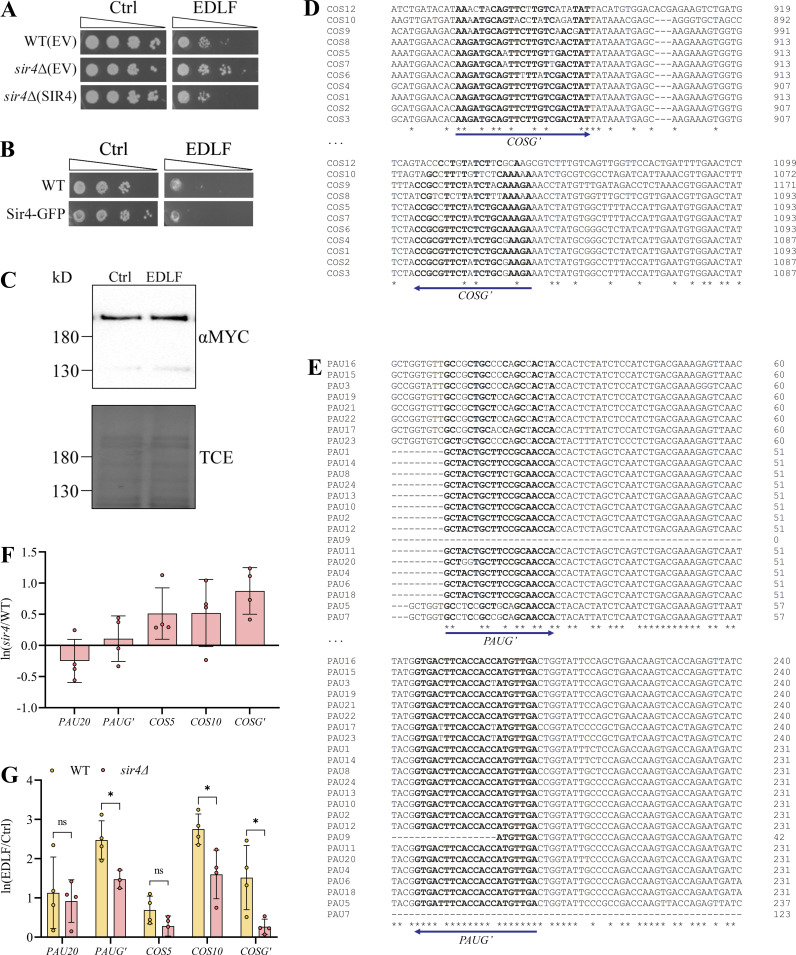
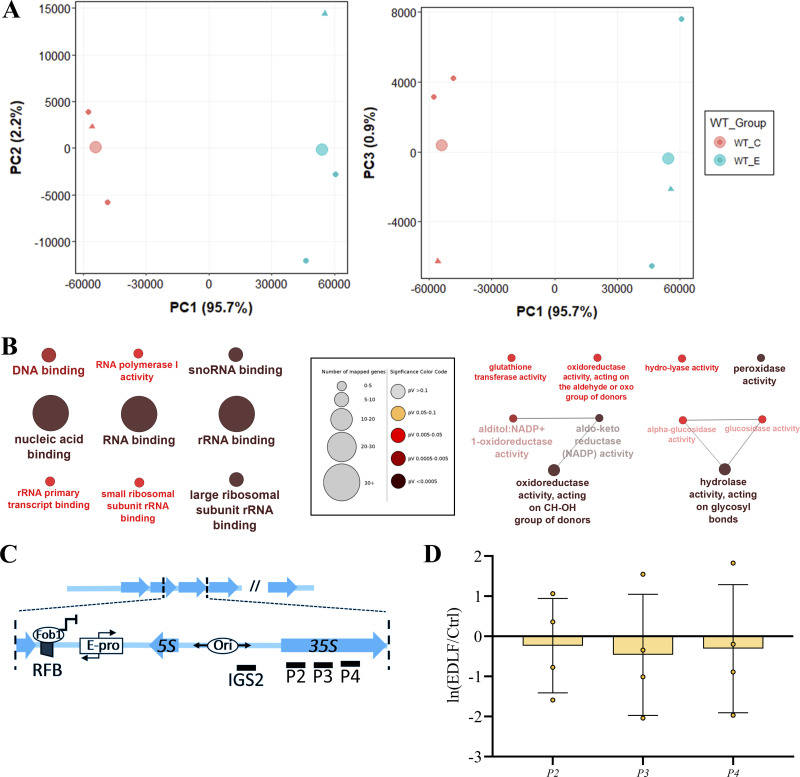
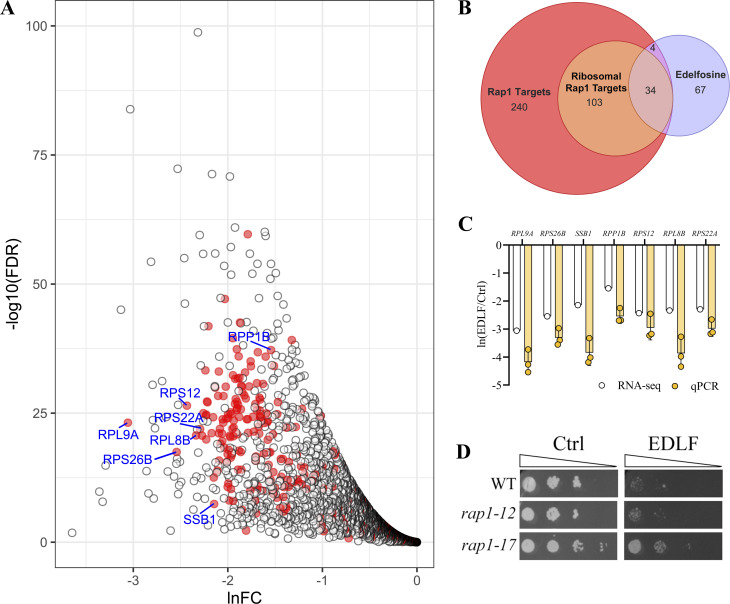
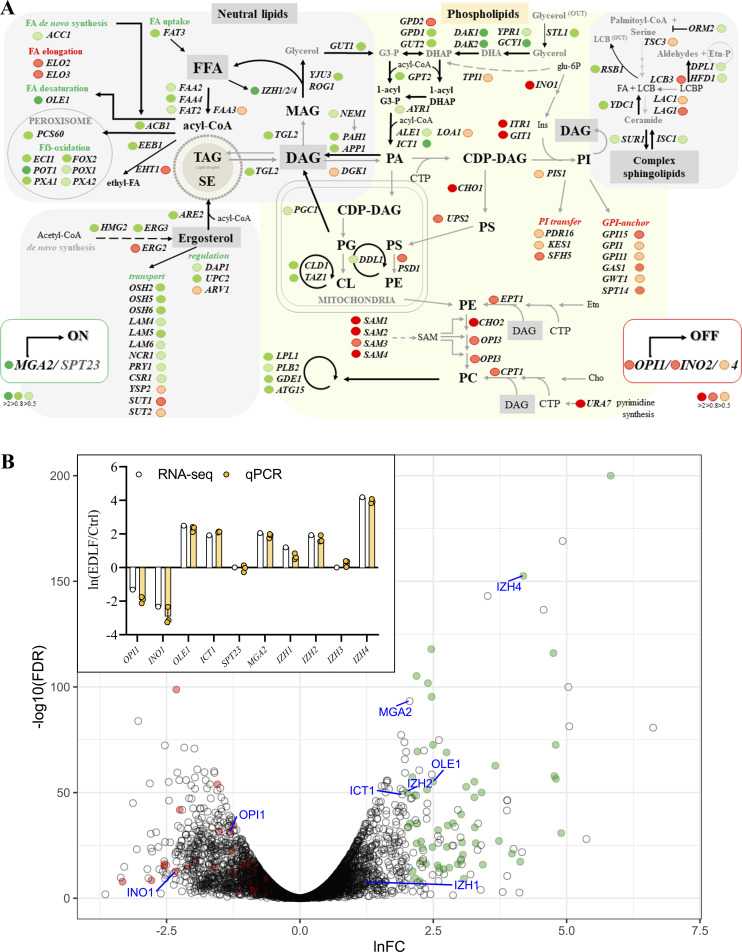
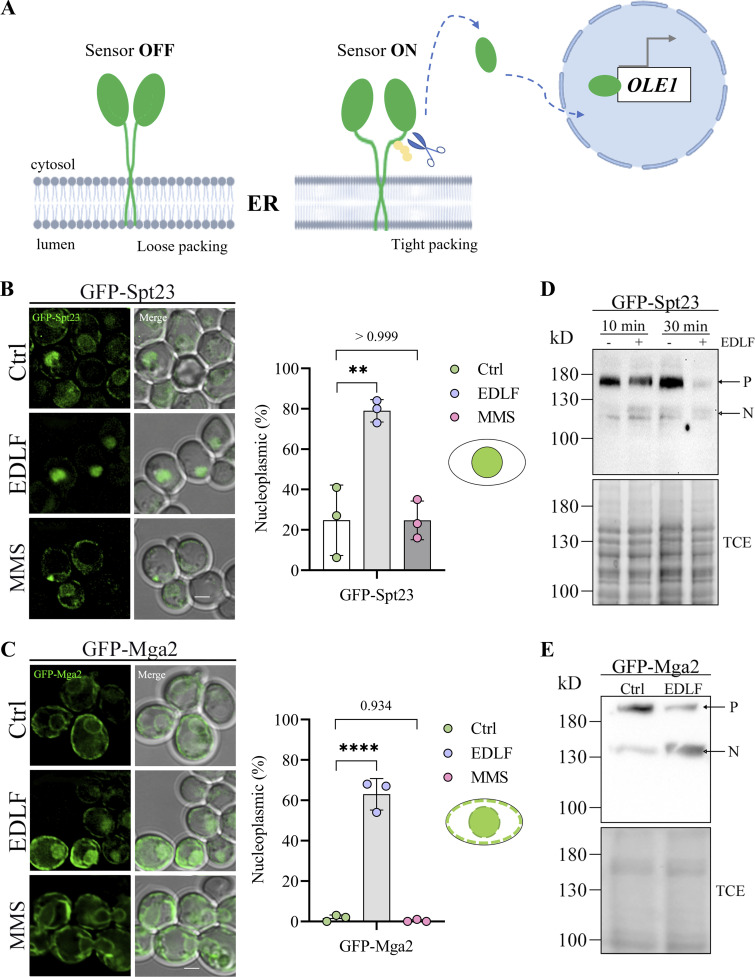
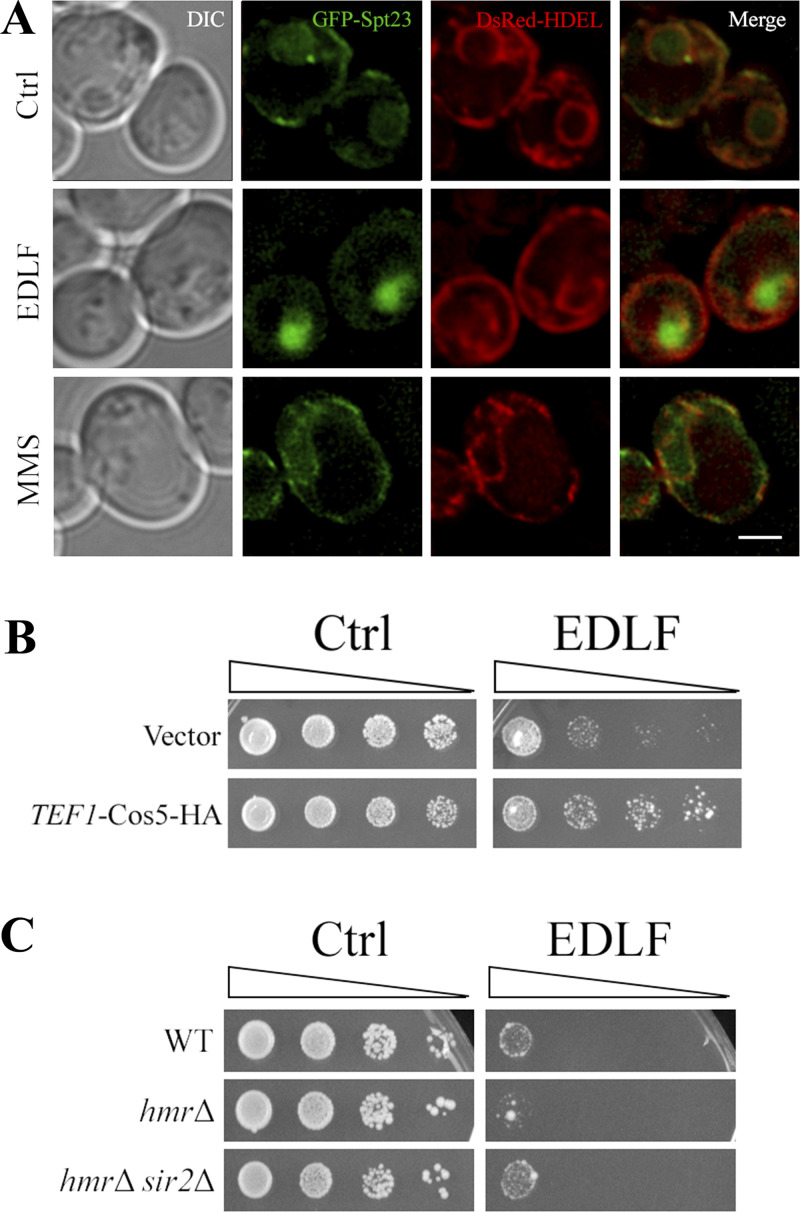
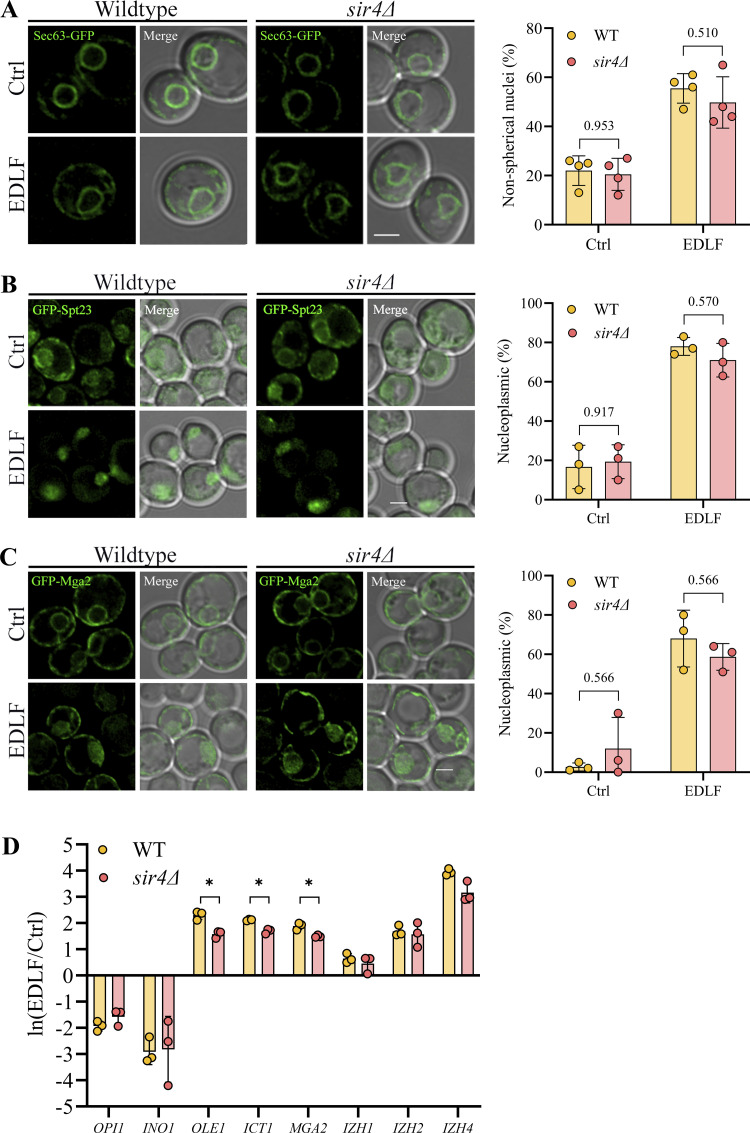
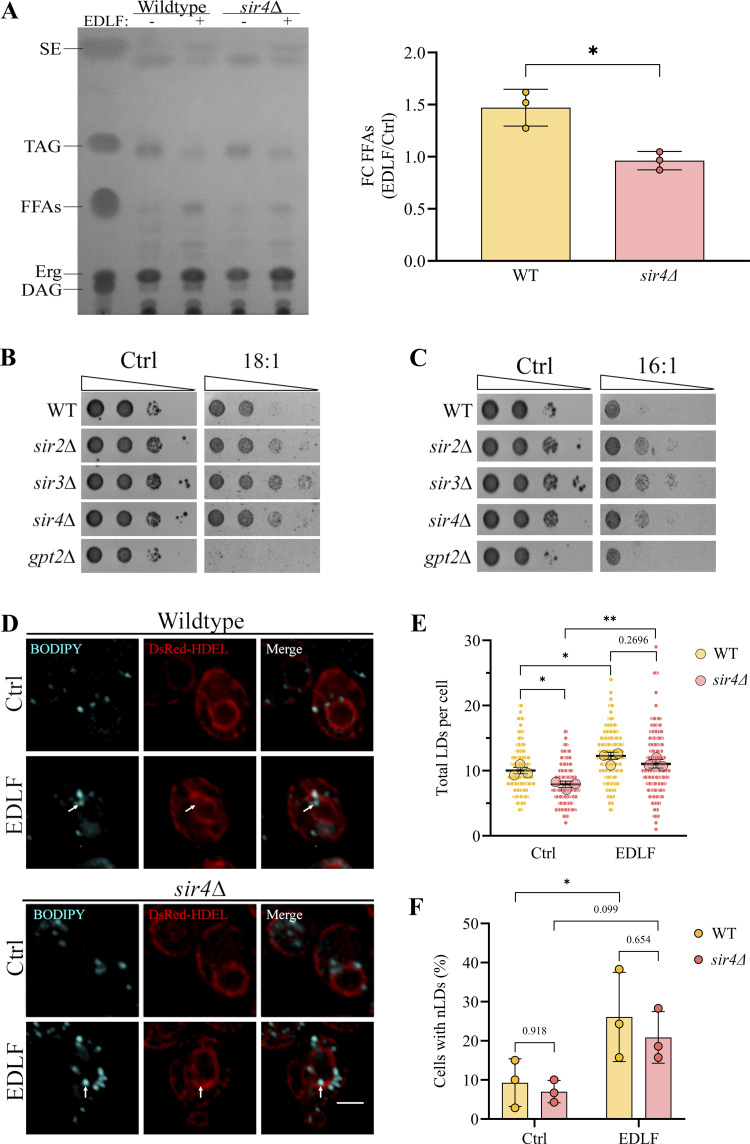
The nuclear envelope (NE) is important in maintaining genome organization. The role of lipids in communication between the NE and telomere regulation was investigated, including how changes in lipid composition impact gene expression and overall nuclear architecture. Yeast was treated with the non-metabolizable lysophosphatidylcholine analog edelfosine, known to accumulate at the perinuclear ER. Edelfosine induced NE deformation and disrupted telomere clustering but not anchoring. Additionally, the association of Sir4 at telomeres decreased. RNA-seq analysis showed altered expression of Sir-dependent genes located at sub-telomeric (0-10 kb) regions, consistent with Sir4 dispersion. Transcriptomic analysis revealed that two lipid metabolic circuits were activated in response to edelfosine, one mediated by the membrane sensing transcription factors, Spt23/Mga2, and the other by a transcriptional repressor, Opi1. Activation of these transcriptional programs resulted in higher levels of unsaturated fatty acids and the formation of nuclear lipid droplets. Interestingly, cells lacking Sir proteins displayed resistance to unsaturated-fatty acids and edelfosine, and this phenotype was connected to Rap1.


Conflict of interest statement

Disclosures: The authors declare no competing interests exist.

Figures

Figure 1.
Figure 1.
The metabolically stable lysophosphatidylcholine analogue edelfosine alters nuclear envelope morphology and nuclear architecture. (A) Representative images of wild-type (W303) cells expressing the ER marker Sec63GFP from a centromeric plasmid. Cells were imaged using live fluorescence microscopy after growth in SD-Leu+Ade and 90 min in the presence of edelfosine or the vehicle. Quantification of cells displaying abnormal nuclear membrane morphology is shown beside the microscopy images. Circles represent the percentage of cells displaying abnormal nuclear morphology in each experiment (two-sided Fisher’s exact test gave a P value <0.0001 for each experiment [n = 100 cells per treatment]). Bars represent the mean of the three independent experiments ± SD. ** indicates a P value <0.01 as determined by two-tailed unpaired t test (N = 3). (B) Representative images of wild-type (W303) cells expressing the Nop1CFP nucleolar marker expressed from a centromeric plasmid in cells with Nup49GFP (nuclear envelope marker) endogenously tagged. Cells were imaged using live fluorescence microscopy after growth in SD-Ura+Ade and 90 min in the presence of edelfosine or the vehicle. The distribution of values from the quantification of nucleolar volume of cells (described in Materials and methods) is shown beside the microscopy images. Values cumulative from three independent experiments (n = 163 Ctrl, 190 EDLF) are shown as small circles, with the means of each experiment shown as large circles. Bars represent the mean with 95% confidence interval from the pooled values. **** indicates a P value <0.0001 as determined by two-tailed nested t test (N = 3). For all panels: Ctrl = vehicle; EDLF = edelfosine; scale bars represent 2 µm.
Figure S1.
Figure S1.
Edelfosine does not elicit a DNA damage response. (A) Anti-Rad53 Western blot of whole cell lysates from cells (W303) treated with edelfosine, vehicle or 0.01% MMS for 60 min. Bottom panel shows protein loading by Red Ponceau. (B) Anti-phospho-Ser129-H2A and anti-total H2A blot of whole cell lysate from cells expressing Sir4-13MYC or Heh1-13MYC treated with edelfosine, the vehicle or 0.01% MMS for 60 min. Source data are available for this figure: SourceData FS1.
Figure 2.
Figure 2.
Altered nuclear envelope shape disrupts telomere clustering but not tethering. (A) Schematic showing the Rabl conformation of yeast nuclei, where centromeres, telomeres and the nucleolus are tethered to the NE, and telomeres are clustered into 3–5 foci per cell that can be visualized by Rap1. (B) Schematic explaining the GFP constructs allowing for analysis of telomere tethering (created with BioRender.com). LacO repeats (6–10 kb) are incorporated into either Tel06R or Tel08L which are then bound by lacIGFP conjugates. The large amount of lacO sites produces a bright focal point at the location of the tagged telomere, which stands out against the nuclear membrane delineated by Nup49GFP. (C) Representative images of cells expressing the Tel08L constructs described in B that were imaged using live fluorescence microscopy after 90 min in edelfosine or the vehicle. Quantification of cells showing the telomere at the periphery for both Tel06R and Tel08L is shown beside the microscopy images. Circles represent the percentage of cells displaying telomere localization at the NE in each experiment (two-sided Fisher’s exact test gave the P values 0.2545, 0.8884, and 0.5461 for each Tel06R experiment [n > 80 cells per treatment], and the P values 0.0710, 0.1873, 0.3210, 0.6050, and 0.7854 for each Tel08L experiment [n > 45 cells per treatment]). The bar represents the mean of the experiments ± SD. Differences between control and edelfosine treatments were found to be non-significant by unpaired t tests with Holm-Šídák correction for multiple comparisons (N = 3 for Tel06R, N = 5 for Tel08L). (D) Representative images of wild-type (W303) cells expressing Rap1GFP imaged by live fluorescence microscopy after 90 min in edelfosine or the vehicle. The distribution of values from the quantification of the number of Rap1 foci per cell is shown beside the microscopy images. Values cumulative from three independent experiments (n = 180 per treatment) are shown as small circles, with the means of each experiment shown as large circles. Bars represent the mean with 95% confidence interval from the pooled values. * indicates a P value <0.05 as determined by two-tailed nested t test (N = 3). (E) ChIP-qPCR of Rap1MYC after 60 min in edelfosine or control. The fold enrichment at three native sub-telomeres (Tel01L, Tel06R, and Tel15L) is shown, normalized to a late replicating region on Chromosome V (469104–469177). Bars represent mean ± SD for four independent experiments while circles represent individual experiments. Differences between control and edelfosine treatments were found to be non-significant by unpaired t tests with Holm-Šídák correction for multiple comparisons and Welch’s correction for unequal variance (N = 4). (F) Western blot of endogenous Rap1 in cells expressing 8HIS-Smt3 after 60 min with edelfosine or control. Bottom panel shows protein loading by red ponceau. For all panels: Ctrl = vehicle; EDLF = edelfosine; scale bars represent 2 µm. Source data are available for this figure: SourceData F2.
Figure S2.
Figure S2.
Telomere interactions with the nuclear membrane are preserved in edelfosine. (A) Representative cells expressing the Tel06R constructs quantified in Fig. 2 B were imaged using live fluorescence microscopy after 90 min in edelfosine or the vehicle. Scale bar represents 2 µm. (B) Membrane and soluble fractions were collected from BY4741 cells expressing Spt23-TAP treated with 20 μM edelfosine or vehicle for 60 min as described in Materials and methods, then blotted for detection of endogenous Rap1 and Pgk1. (C) Cell cycle analysis of wild-type cells (W303) treated with edelfosine or vehicle for the indicated times. For all panels: Ctrl = vehicle; EDLF = edelfosine. Source data are available for this figure: SourceData FS2.
Figure 3.
Figure 3.
The SIR complex is susceptible to lipid alterations at the NE. (A) Wild-type (W303) cells or the indicated SIR complex mutants were serial diluted onto synthetic solid media containing 25 μM edelfosine or vehicle and incubated at 30°C for 2 d. (B) ChIP-qPCR of Sir4MYC after 60 min in edelfosine or the vehicle. The fold enrichment at three native sub-telomeres (Tel01L, Tel06R, and Tel15L) is shown, normalized to a late replicating region on Chromosome V (469104–469177). Bars represent mean ± SD for four independent experiments while circles represent individual experiments. * indicates P value <0.05; ** indicates P value <0.01 as determined by unpaired t tests with Holm-Šídák correction for multiple comparisons. (C) Representative images of cells expressing Sir4GFP and the ER marker DsRedHDEL (both endogenously tagged) visualized by live fluorescence microscopy after 90 min with edelfosine or vehicle. Scale bar represents 2 µm. The distribution of values from the quantification of the number of Sir4 foci per cell is shown beside the microscopy images. Values cumulative from three independent experiments (n = 180 cells per treatment) are shown as small circles, with the means of each experiment shown as large circles. Bars represent the mean with 95% confidence interval from the pooled values. * indicates a P value <0.05 as determined by two-tailed nested t test (N = 3). For all panels: Ctrl = vehicle; EDLF = edelfosine.
Figure S3.
Figure S3.
Treatment with edelfosine induces expression of the SIR-dependent COS and PAU sub-telomeric gene families. (A) Growth of wild-type (W303) or sir4∆ cells expressing SIR4 from a centromeric plasmid or the empty vector (EV) on SD-Leu+Ade plates containing 20 μM edelfosine or vehicle. Plates were incubated at 30°C and imaged after 3 d of growth. (B) Growth of wild-type (W303) or endogenously tagged SIR4-GFP cells on synthetic solid medium containing 20 μM edelfosine or vehicle. Plates were incubated at 30°C and imaged after 2 d of growth. (C) Western blot of Sir4MYC after 60 min with edelfosine or control. Bottom panel shows protein loading by TCE. (D and E) Sequence alignment of the highly similar COS (D) and PAU (E) family genes at the regions amplified by qPCR. Bold letters indicate binding sites for the general primers. (F and G) qPCR of the indicated genes in sir4Δ cells relative to wild type, expressed as ln(mutant/WT) (F) or in wild-type and sir4Δ cells treated for 60 min (G) with edelfosine or vehicle expressed as ln(EDLF/Ctrl). Bars represent mean ± SD for three independent experiments while circles represent individual experiments. * indicates P value <0.05 as determined by unpaired t tests with Holm-Šídák correction for multiple comparisons. For all panels: Ctrl = vehicle; EDLF = edelfosine. Source data are available for this figure: SourceData FS3.
Figure S4.
Figure S4.
Genetic background and gene ontology analysis of RNA-seq hits. (A) Scatter plots of the first three principal component analysis scores for the transcriptional landscape of each sample submitted for RNA-seq. W303 samples are represented as circles while BY4741 samples are represented as triangles. Large circles indicate the mean PC score for each treatment. Red is Ctrl, and blue is EDLF. (B) Molecular function GO terms enriched in genes downregulated (left) and upregulated (right) in edelfosine more than ln(1.5-fold). Legend demonstrating correlation of size and color with the number of genes per term and the significance score, respectively, is in the middle. (C) Schematic of rDNA repeats showing regions amplified by qPCR primers. (D) qPCR of 35S rDNA targets (P2-4) in WT cells treated for 60 min with edelfosine or vehicle expressed as ln(EDLF/Ctrl) and normalized to IGS2. Bars represent mean ± SD for three independent experiments while circles represent individual experiments. For all panels: Ctrl = vehicle; EDLF = edelfosine.
Figure 4.
Figure 4.
Ribosomal protein targets of Rap1 are repressed in edelfosine. (A) Volcano plot of genes downregulated in response to edelfosine as identified by RNA-seq transcriptome analysis. Targets of Rap1 are colored red. Genes confirmed by qPCR are labeled. (B) Venn diagram showing the overlap between genes strongly downregulated in edelfosine (<−2 ln(FC)) and genes known to be bound by Rap1 (Lieb et al., 2001), including ribosomal protein genes. (C) qPCR of genes identified in A compared to their RNA-seq values. Bars represent mean ± SD for three independent experiments while circles represent individual experiments. (D) The isogenic wild type (KM014) or the indicated Rap1 mutants were serial diluted onto defined solid medium containing 20 μM edelfosine (EDLF) or vehicle (Ctrl) and incubated at 30°C for 2 d. The first dilution of rap1-17 cells was A600 ∼1, while the other two strains were A600 ∼0.1, which was experimentally determined to normalize strain growth on control plates.
Figure 5.
Figure 5.
Lipid circuits activated in response to edelfosine. (A) Lipid transport and metabolic pathway map highlighting upregulated (green dots) and downregulated (red dots) genes detected by RNA-seq. Color code reflects the fold change as indicated in the figure. (B) Volcano plot of transcripts changed in response to edelfosine as identified by the RNA-seq transcriptome analysis. Targets of Opi1/Ino2/4 are colored red. Targets of Spt23 are colored green. Genes confirmed by qPCR (inset) are labeled. For the inset, bars represent mean ± SD for three independent experiments while circles represent individual experiments.
Figure 6.
Figure 6.
Spt23 and Mga2 sense changes in the membrane lipid environment induced by edelfosine. (A) Schematic illustrating the off-on states of the membrane packing sensors Mga2 and Spt23 and the release of the transcription factor N-end in response to changes in membrane environment (created with BioRender.com, adapted from Ballweg et al., 2020). (B and C) Representative images of GFPSpt23 expressed from a centromeric plasmid under the constitutive GPD promoter in spt23Δ cells (B) or GFPMga2 expressed from a centromeric plasmid under the constitutive GPD promoter in mga2Δ cells (C) were imaged after growth in SD-Leu+Ade and 30 min in the presence of edelfosine, the vehicle, or 0.1% methyl methane sulfonate (MMS). Quantification of cells displaying nucleoplasmic signal is shown beside the microscopy images. Nuclear localization was confirmed using the ER marker DsRedHDEL (Fig. S5). Circles represent the percentage of cells displaying nucleoplasmic signal in each experiment (Chi-square test gave a P value <0.0001 for each experiment [n > 65 cells per treatment]). The bar represents the mean of the three experiments ± SD. ** indicates a P value <0.01 and **** indicates a P value <0.0001 as determined by standard one-way ANOVA with Tukey’s multiple comparisons test (N = 3). Schematics illustrate what was classified as nucleoplasmic signal for B and C. (D and E) Western blot of lysates from cells (W303) expressing GFPSpt23 (D) or GFPMga2 (E) from centromeric plasmids under the constitutive GPD promoter treated with edelfosine for the indicated times (D) or for 60 min (E) Bottom panels show protein loading visualized by TCE. P indicates precursor species (148.2 kD for Spt23, 153.9 kD for Mga2), while N indicates nucleoplasmic species (∼90 kD + EGFP). For all panels: Ctrl = vehicle; EDLF = edelfosine; scale bars represent 2 µm. Source data are available for this figure: SourceData F6.
Figure S5.
Figure S5.
Transcriptional basis of edelfosine resistance is complex. (A) Representative images of wild-type (W303) cells expressing GFPSpt23 from a centromeric plasmid under the constitutive GPD promoter and DsRedHDEL that were imaged after growth in SD-Leu+Ade and 60 min in the presence of edelfosine (EDLF), the vehicle (Ctrl), or 0.1% methyl methane sulfonate (MMS). (B) Growth of wild-type (W303) cells overexpressing Cos5 or an empty vector on SD-URA solid medium containing 15 μM edelfosine or vehicle. Plates were incubated at 30°C and imaged after 3 d of growth. (C) Growth of wild-type (W303), hmr∆, and hmr∆ sir2∆ strains on synthetic solid medium containing 20 μM edelfosine or vehicle. Plates were incubated at 30°C and imaged after 3 d of growth.
Figure 7.
Figure 7.
NE deformation and Spt23/Mga2 activation are independent of Sir4. (A) Representative images of wild-type and sir4Δ cells expressing the ER marker Sec63GFP from a centromeric plasmid. Cells were imaged using live fluorescence microscopy after growth in SD-Leu+Ade and 90 min in the presence of edelfosine or control. Quantification of non-round nuclei is shown beside the microscopy images. (B and C) Representative images of GFPSpt23 (B) or GFPMga2 (C) expressed from a centromeric plasmid under the constitutive GPD promoter in wild-type or sir4Δ cells imaged after growth in SD-Leu+Ade and 30 min in the presence of edelfosine or the vehicle. Quantification of nucleoplasmic signal is shown beside microscopy images. For all microscopy quantifications (A, B, and C), circles represent the percentage of cells displaying the indicated phenotype in each experiment (n = 100 cells per treatment), while the bar represents the mean of all independent experiments ± SD. Differences between wild-type and sir4∆ were found to be non-significant in both control and edelfosine treatments as determined by two-way ANOVA with Šídák’s multiple comparisons test (N = 4 for NE, N = 3 for Spt23 and Mga2). (D) qPCR of Spt23 and Opi1 targets in wild-type and sir4Δ cells treated for 60 min with edelfosine or vehicle expressed as ln(EDLF/Ctrl). Bars represent mean ± SD for three independent experiments while circles represent individual experiments. * indicates P value <0.05 as determined by unpaired t tests with Holm-Šídák correction for multiple comparisons. For all panels: Ctrl = vehicle; EDLF = edelfosine; scale bars represent 2 µm.
Figure 8.
Figure 8.
Lipotoxicity response in SIR mutants. (A) Wild-type or sir4Δ cells were treated with edelfosine or the vehicle for 60 min, and lipid extractions were performed as described in Materials and Methods. Neutral lipids were separated using thin layer chromatography with a solvent system composed of 80:20:1 petroleum ether/diethyl ether/acetic acid. Diacylglycerol (DAG); ergosterol (Erg); free fatty acids (FFA); triacylglycerol (TAG); and sterol esters (SE). FFA was quantified as described in Materials and methods. The fold-change of total FFA in edelfosine vs. control is reported. Circles represent the fold-change for each experiment, while the bar represents the mean of the three experiments ± SD. * indicates a P value <0.05 as determined by two-tailed unpaired t test (N = 3). (B and C) Wild-type (W303) cells or the indicated mutants were serial diluted onto synthetic solid media containing 4 mM oleic acid (B) or 1.18 mM palmitoleic acid (C) or control plates containing glucose and vehicle (1% DMSO). Cells were serially diluted 1:5 beginning with A600 ∼1. Plates were incubated at 30°C and imaged after 3 d of growth. (D) Representative images of wild-type (BY4741) or sir4Δ cells expressing DsRedHDEL treated with edelfosine or the vehicle for 90 min and stained with BODIPY to visualize lipid droplets (LDs) as described in Materials and methods. Scale bar represents 2 µm. (E) The distribution of values from the quantification of the average number of LDs per cell. Values cumulative from three independent experiments (n > 145 cells per treatment) are shown as small circles, with the means of each experiment shown as large circles. Bars represent the mean with 95% confidence interval from the pooled values. * indicates a P-value <0.05 and ** indicates a P values <0.01 as determined by nested one-way ANOVA with Šídák’s multiple comparisons test (N = 3). (F) Quantification of cells displaying nuclear lipid droplets (nLDs). Circles represent the percentage of cells displaying nLDs in each experiment (n > 45 cells per treatment). The bar represents the mean of the three experiments ± SD. * indicates a P value <0.05 as determined by two-way ANOVA with Šídák’s multiple comparisons test (N = 3). For all panels: Ctrl = vehicle; EDLF = edelfosine.

Similar articles

Cited by

References

    1. Ai, W., Bertram P.G., Tsang C.K., Chan T.F., and Zheng X.F.S.. 2002. Regulation of subtelomeric silencing during stress response. Mol. Cell. 10:1295–1305. 10.1016/S1097-2765(02)00695-0 - DOI - PubMed
    1. Alberti, S., Gitler A.D., and Lindquist S.. 2007. A suite of Gateway cloning vectors for high-throughput genetic analysis in Saccharomyces cerevisiae. Yeast. 24:913–919. 10.1002/yea.1502 - DOI - PMC - PubMed
    1. Ames, B.N. 1966. Assay of inorganic phosphate, total phosphate and phosphatases. Methods Enzymol. 8:115–118. 10.1016/0076-6879(66)08014-5 - DOI
    1. Aparicio, O.M., Billington B.L., and Gottschling D.E.. 1991. Modifiers of position effect are shared between telomeric and silent mating-type loci in S. cerevisiae. Cell. 66:1279–1287. 10.1016/0092-8674(91)90049-5 - DOI - PubMed
    1. Attard, G.S., Templer R.H., Smith W.S., Hunt A.N., and Jackowski S.. 2000. Modulation of CTP:phosphocholine cytidylyltransferase by membrane curvature elastic stress. Proc. Natl. Acad. Sci. USA. 97:9032–9036. 10.1073/pnas.160260697 - DOI - PMC - PubMed

Publication types

MeSH terms

Grants and funding