. 2023 May 9;56(5):944-958.e6.
doi: 10.1016/j.immuni.2023.03.006. Epub 2023 Apr 10.

Restraint of IFN-γ expression through a distal silencer CNS-28 for tissue homeostasis

Affiliations

Restraint of IFN-γ expression through a distal silencer CNS-28 for tissue homeostasis

Kairong Cui et al. Immunity. .

Abstract

Interferon-γ (IFN-γ) is a key cytokine in response to viral or intracellular bacterial infection in mammals. While a number of enhancers are described to promote IFN-γ responses, to the best of our knowledge, no silencers for the Ifng gene have been identified. By examining H3K4me1 histone modification in naive CD4+ T cells within Ifng locus, we identified a silencer (CNS-28) that restrains Ifng expression. Mechanistically, CNS-28 maintains Ifng silence by diminishing enhancer-promoter interactions within Ifng locus in a GATA3-dependent but T-bet-independent manner. Functionally, CNS-28 restrains Ifng transcription in NK cells, CD4+ cells, and CD8+ T cells during both innate and adaptive immune responses. Moreover, CNS-28 deficiency resulted in repressed type 2 responses due to elevated IFN-γ expression, shifting Th1 and Th2 paradigm. Thus, CNS-28 activity ensures immune cell quiescence by cooperating with other regulatory cis elements within the Ifng gene locus to minimize autoimmunity.

Keywords: IFN-gamma expression; chromatin interaction; distal enhancer; distal repressor of transcription; tissue homeostasis.


Conflict of interest statement

Declaration of interests The authors declare no competing interests.

Figures
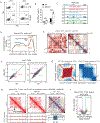
Fig 1.
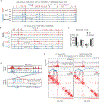
Fig 1.. Loss of Mll4 induces enhanced IFN-g expression and interaction frequencies within the Ifng domain.
(A) Naive CD4+ T cells from WT and Mll4 KO mice were stimulated under Th1 condition and harvested at 24 and 48 hours. Intracellular expression levels of IFN-γ produced in these cells were determined by flow cytometry. (B) Quantification of IFN-γ producing cells from multiple experiments as measured in (A) above. (C) Genome browser images of RNA-seq analysis of Ifng expression in WT and Mll4 KO CD4+ T cells under Th1 condition. The RNA-seq data were generated in this study. (D) Distribution of interacting paired-end tags (PETs) frequencies against genomic distances of Hi-C data in wild-type and Mll4 KO naïve CD4+ T cells. Hi-C data were obtained from and down-sampled to 300 million for a fair comparison. Only PETs with distance longer than 1 kb were used to draw the density plot. (E) Examples of chromatin interaction changes measured by Hi-C after Mll4 KO in naïve CD4+ T cells. The changes of Hi-C interaction frequency were visualized by subtracting the number of PETs detected in KO cells from the number of PETs detected in WT cells. The blue color indicates decreased interaction frequencies, and the red color indicates increased interaction frequencies. Left panel shows the interaction difference heatmap for Chromosome 19 with 200 kb resolution, and arrows indicate a random selected region for zoom-in visualization as the right panel. The right panel shows the interaction changes in a 5 Mb genomic region with 25 kb resolution; the black rectangles mark the TADs called by Juicer with the WT Hi-C data. (F) Quantitation of Hi-C interaction changes for TADs comparing Mll4 KO and WT mice in naïve CD4+ T cells. The left panel shows relative changes regarding the TAD compactness, and the right panel shows changes of interaction densities within the TADs. Only PETs with a distance longer than 1 kb were used for the calculation. The numbers indicate the TADs with higher interacting densities in KO or WT cells. The TAD contains the Ifng locus was indicated. (G) Hi-C data aggregation analysis of highly interacting TADs in WT or Mll4 KO cells. WT or KO highly interacting domains were obtained by overlapping the consistently changed domains from compactness and interaction densities within TADs in (F). Only the top 200 changed TADs were used to draw the aggregation heatmaps. (H) Hi-C interaction frequencies of Ifng domain were increased in Mll4 KO naïve CD4+ T cells (middle panel) compared to WT cells (left panel). The changes of interaction frequency were visualized by subtracting the number of PETs detected in KO cells from the number of PETs detected in WT cells (right panel). The blue color indicates decreased interaction frequencies, and the red color indicates increased interaction frequencies. CTCF ChIP-seq profiles for WT and KO naïve CD4+ T cells were shown below the red heatmaps for corresponding cell types. Distribution of pixel level (5kb resolution) difference for the Ifng domain was shown below the red/blue heatmap. Two sided Wilcoxon signed-rank test P-value was shown for the statistical difference of interactions within the Ifng domain. CTCF ChIP-seq data were generated in this study. (I) Volcano plots of significantly changed CTCF peaks for the naïve CD4+ T cells affected by Mll4 KO. Mean values from three replicates were used to calculate fold changes (KO/WT) and Poisson P-values. Fold change > 2 (or < 0.5) and P-value smaller than 0.001 were set as the significant cutoffs. Numbers of total peaks, WT specific peaks and KO specific peaks were shown. Data are representative of at least two independent experiments (A, C-I) or pooled from two independent experiments (B). ***p < 0.001. (Two-way ANOVA with Tukey’s multiple comparison test, error bars represent SD).
Fig 2.
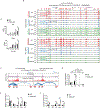
Fig 2.. Identification of the Ifng silencer CNS–28.
(A) Genome browser images of MLL4 and H3K4me1 ChIP-seq profiles in the Ifng domain. The ChIP-seq data were obtained from . Peaks were called and combined from H3K4me1 ChIP-seq data in WT naïve CD4+ and Th1 cells by cLoops2 and shown as the red blocks below the genes as putative cis-regulatory elements, annotated according to the relative distance to Ifng promoter, with – standing for upstream and + indicating downstream of Ifng TSS. The gray bar and arrow highlighted the absence of an H3K4me1 peak located at CNS-28 after the deletion of MLL4. The mean of normalized reads counts (to a total of 10 million reads) from two replicates of H3K4me1 ChIP-seq in the CNS-28 locus were used to calculate fold change (KO/WT) and Poisson P-value. (B) Genome browser images of GATA-3 and T-bet ChIP-seq binding profiles around Ifng in naïve CD4+ T cells and Th1 differentiated cells. Th1 GATA-3 ChIP-seq data annotated with SRR038548 was obtained from , Th1 T-bet ChIP-seq data annotated with SRR372732 was obtained from , and the other ChIP-seq data shown in this panel were generated in this study. (C) ChIP-qPCR analysis of GATA-3 binding to CNS–28, CNS–22, Ifng promoter and CNS+41 at the Ifng locus in WT and Mll4 KO naïve CD4+ T cells. (D) Histone modification mark H3K4me1 at CNS–34, CNS–28, CNS–22 and CNS+18–20 is conserved between human T lymphocyte cell line Jurkat and mouse CD4+ T cells, while binding of GATA-3 is only conserved at CNS–28. CNS–28 is not bound by T-bet in mice Th1 cells. Human IFNG gene is located in negative strand and mouse Ifng gene is located in positive strand. GATA-3 ChIP-seq data in naïve CD4+ cells and T-bet ChIP-seq data in Th1 cells were generated in this study and were also shown in panel B. Human ChIP-seq data were obtained from and with the annotation of GSM number from GEO in the figure. (E) The interaction matrix heatmaps from Hi-TrAC data around CNS–34, –28, –22, and Ifng promoter in WT and Mll4 KO naïve CD4+ T cells. CNS–22 was set as the viewpoint for the virtual 4C plots. The number of interacting reads for each chromatin loop is shown above the arches. The cLoops2 plot module generated the plots. Data are representative of at least two independent experiments (A-E). ***p < 0.001. NS: not statistically significant. (Two-way ANOVA with Tukey’s multiple comparison test, error bars represent SD).
Fig 3.
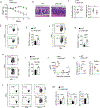
Fig 3.. Loss of CNS–28 results in tissue inflammation and enhanced IFN-γ production.
(A-B) Naive CD4+ T cells from WT and CNS–28Δ mice were stimulated under Th0, Th1, Th17 and pTreg conditions and harvested at 72 hours. Intracellular staining of indicated cytokines produced by different polarized T cells from WT and CNS–28Δ mice was analyzed by (A) flow cytometry and (B) Quantification. (C) Representative hematoxylin and eosin staining of liver, lung, kidney, small intestine (SI) and colon sections. Scale bar: liver, lung, 100 μm; kidney, SI, colon, 50 μm. (D) Quantification of histological analysis from Fig. 3C of mice aged 40 weeks old. 0–3 score: 0, no mononuclear infiltration; 3, high degree of mononuclear infiltration. (E) ELISA of IFN-γ in the serum in WT and CNS–28Δ mice at 8 or 40 weeks of age. (F-G) (F) Flow cytometry analysis and (G) quantification of CD4 and CD8 expression on CD45+ cells from spleen and peripheral lymph nodes (dLN) of WT and CNS–28Δ mice at 40 weeks of age. (H-I) (H) Flow cytometry and (I) quantification of CD44 and CD62L expression on CD4+ T cells from spleen and peripheral lymph nodes (dLN) of WT and CNS–28Δ mice at 40 weeks of age. Data are representative of at least two independent experiments (A, C-I) and pooled from two independent experiments (B). *p < 0.05, **p<0.01. NS: not statistically significant. (Student’s t-test, error bars represent SD).
Fig 4.
Fig 4.. CNS–28 represses interaction between CNS-22 and Ifng promoter.
(A) qPCR analysis of mRNA in WT and CNS–28Δ naïve CD4+ T cells stimulated for 12, 24, 48 and 72 h (horizontal axis) under Th1 conditions; results are presented relative to those of Gapdh. (B) Genome browser images of H3K4me1, H3K4me3 and H3K27ac ChIP-seq profiles in the Ifng domain. The ChIP-seq data were generated in this study. The mean of normalized reads counts (to a total of 10 million reads) from two replicates of ChIP-seq data in the CNS-28 locus were used to calculate fold changes (KO/WT) and Poisson P-values. (C) The chromatin interactions originating from CNS-22 detected by Hi-TrAC in WT and CNS–28Δ naïve CD4+ T cells. The high-quality unique PETs from Hi-TrAC libraries were down-sampled to 37 million for a fair comparison between WT and CNS–28Δ cells. CNS–22 was set as the viewpoint for the virtual 4C plots. The number of interacting PETs for each chromatin loop is shown above the arches. The cLoops2 plot module generated the plots. (D) 3C-qPCR analysis of interaction intensity between the Ifng promoter and other indicated elements in WT and CNS–28Δ Th1 cells. The cartoon above the data indicates the fixed anchor fragment (dashed black lines) and other Hpa I fragments used for the assay. (E-F) ChIP-qPCR analysis of the binding of (E) Rad21 or (F) T-bet to the Ifng locus in WT or CNS–28Δ Th1 cells, presented relative to input. Data are representative of at least two independent experiments (A-F). *p < 0.05, **p < 0.01, ***p<0.001, NS: not statistically significant. (Two-way ANOVA with Tukey’s multiple comparison test, error bars, SD).
Fig 5.
Fig 5.. CNS–28 is critical for type 1 responses during host defense and inflammation.
(A) Body weight of Rag2−/− mice transferred i.p. with CD4+CD25CD62L+ cells from WT or CNS–28Δ mice. (B) Hematoxylin and eosin staining of colonic tissue from the different groups as in (A) 10 weeks after colitis induction, scale bar, 50μm. (C) Left: Quantification of pathological changes in the colon of mice as in (A); Right: Colon lengths of Rag2−/− mice which had received the indicated cells for transfer as in (A), measured from the colocecal junction to the anal verge (D-E) (D)Flow cytometry analysis and (E) Quantification of IFN-γ expression by CD4+ T cells isolated from LP from indicated groups as in (A) 10 weeks after colitis induction. (F-I) Splenocytes from WT and CNS–28Δ mice were isolated and cultured in the presence of IL-12 and IL-2 for 6 h. IFN-γ expression in (F, G) CD8+ T cells or (H, I) NK1.1+ NK cells were measured by (F, H) flow cytometry or (G, I) Quantification. (J-M) Listeria were inoculated into WT and CNS–28Δ mice by oral gavage. The mice were sacrificed on day 14 for further tests. (J) IFN-γ level in serum was assessed by ELISA at indicated day. (K) Bacteria CFU was counted at day 7 after infection in liver and spleen. (L) Flow cytometry analysis and (M) Quantification of IFN-γ expression in CD4+, CD8+ T cells from spleen 7 days after infection and NK cells isolated from spleen 1 day after infection. Data are representative of at least two independent experiments (A, B, C-M) or pooled from two independent experiments (C). *p < 0.05, **p < 0.01 (Student’s t test, error bars represent SD).
Fig 6.
Fig 6.. Reduced type 2 responses by deletion of CNS–28.
(A-B) Naïve CD4+ T cells from WT and CNS–28Δ mice were stimulated under Th2 condition and harvested at 72 hours. Intracellular staining of indicated cytokines was measured by (A) flow cytometry and (B) Quantification. (C) Hematoxylin-and-eosin staining of lung-tissue sections of WT and CNS–28Δ mice, assessed after 10 days of HDM challenge. Scale bar, top row, 0.5 mm; bottom row, 100 μm. (D-E) ELISA of IgE in the (D) serum and (E) bronchoalveolar lavage (BAL) fluid of WT and CNS–28Δ mice 10 days after HDM challenge. (F) Frequency of inflammatory cells in the lung tissue of WT and CNS–28Δ mice, assessed at 10 days after HDM challenge. (G) Flow cytometry analysis and (H) Quantification of type 2 cytokines in CD4+ T cells isolated from the lung 10 days after HDM challenge. (I) Recovered cells from the lung 10 days after HDM challenge were restimulated by HDM. The levels of type 2 cytokines levels in medium were assessed by ELISA after 3 days of restimulation. Data are representative of at least two independent experiments (A-C, G-I) or pooled from two independent experiments (D-F). **p < 0.01, ***p < 0.001, NS: not statistically significant. (Student’s t test, error bars represent SD).
Fig 7.
Fig 7.. CNS–28 represses type 2 responses due to enhanced IFN-γ production.
(A) qPCR analysis of mRNA during differentiation of WT and CNS–28Δ naïve CD4+ T cells under Th2 conditions for 12, 24, 48 or 72 h (horizontal axis); results are presented relative to those of Gapdh. (B) ELISA assessment of IFN-γ in the culture medium in WT and CNS–28Δ differentiated Th2 cells. (C-D) Activated WT and CNS–28Δ naive CD4+ T cells were stimulated with combinations of IL-4 with anti-IFN-γ antibody for 3 days. Intracellular staining of type 2 cytokines was measured by (C) flow cytometry and (D) Quantification. Data are representative of at least two independent experiments (A-D). *p < 0.05, ***p < 0.01, NS: not statistically significant. (A, D, Two-way ANOVA with Tukey’s multiple comparison test; B, Student’s t test, error bars represent SD).

Comment in

Similar articles

Cited by

References

    1. Lazarevic V, Glimcher LH, and Lord GM (2013). T-bet: a bridge between innate and adaptive immunity. Nature reviews. Immunology 13, 777–789. 10.1038/nri3536. - DOI - PMC - PubMed
    1. Bustamante J, Boisson-Dupuis S, Abel L, and Casanova JL (2014). Mendelian susceptibility to mycobacterial disease: genetic, immunological, and clinical features of inborn errors of IFN-gamma immunity. Semin Immunol 26, 454–470. 10.1016/j.smim.2014.09.008. - DOI - PMC - PubMed
    1. Bluestone JA, Mackay CR, O’Shea JJ, and Stockinger B (2009). The functional plasticity of T cell subsets. Nature reviews. Immunology 9, 811–816. 10.1038/nri2654. - DOI - PMC - PubMed
    1. O’Shea JJ, and Paul WE (2010). Mechanisms underlying lineage commitment and plasticity of helper CD4+ T cells. Science 327, 1098–1102. 10.1126/science.1178334. - DOI - PMC - PubMed
    1. Filiano AJ, Xu Y, Tustison NJ, Marsh RL, Baker W, Smirnov I, Overall CC, Gadani SP, Turner SD, Weng Z, et al. (2016). Unexpected role of interferon-gamma in regulating neuronal connectivity and social behaviour. Nature 535, 425–429. 10.1038/nature18626. - DOI - PMC - PubMed

Publication types

Substances