. 2023 Apr 10;14(1):1999.
doi: 10.1038/s41467-023-37591-w.

Total escape of SARS-CoV-2 from dual monoclonal antibody therapy in an immunocompromised patient

Affiliations

Total escape of SARS-CoV-2 from dual monoclonal antibody therapy in an immunocompromised patient

Lena Jaki et al. Nat Commun. .

Abstract

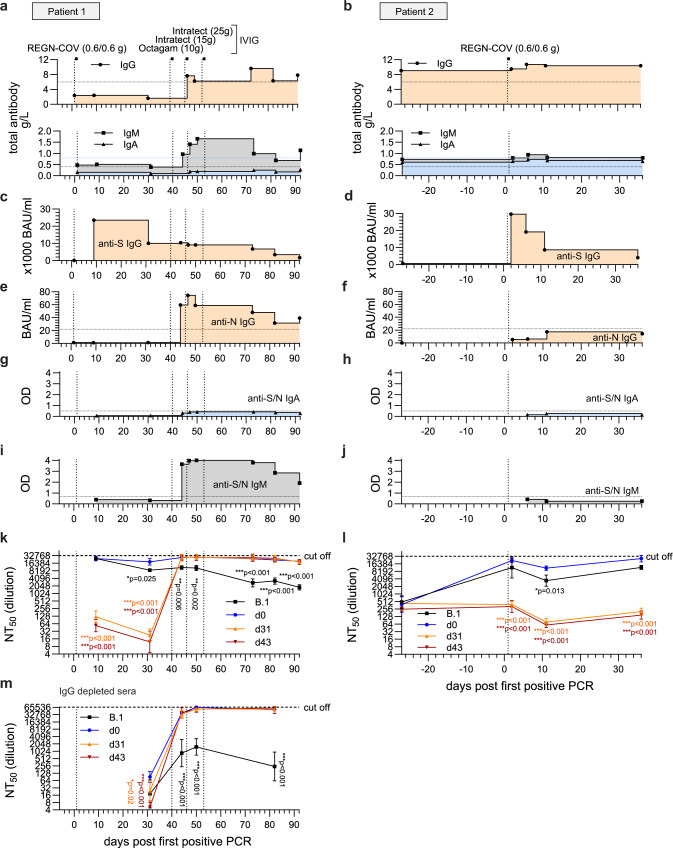
Monoclonal antibodies (mAbs) directed against the spike of severe acute respiratory syndrome coronavirus 2 (SARS-CoV-2) are effective therapeutic options to combat infections in high-risk patients. Here, we report the adaptation of SARS-CoV-2 to the mAb cocktail REGN-COV in a kidney transplant patient with hypogammaglobulinemia. Following mAb treatment, the patient did not clear the infection. During viral persistence, SARS-CoV-2 acquired three novel spike mutations. Neutralization and mouse protection analyses demonstrate a complete viral escape from REGN-COV at the expense of ACE-2 binding. Final clearance of the virus occurred upon reduction of the immunosuppressive regimen and total IgG substitution. Serology suggests that the development of highly neutralizing IgM rather than IgG substitution aids clearance. Our findings emphasise that selection pressure by mAbs on SARS-CoV-2 can lead to development of escape variants in immunocompromised patients. Thus, modification of immunosuppressive therapy, if possible, might be preferable to control and clearance of the viral infection.


Conflict of interest statement

The authors declare no competing interests.

Figures

Fig. 1
Fig. 1. Nosocomial outbreak at the University Medical Centre of Freiburg, Germany caused by Delta lineage AY.43.
a Visualization of known transmission links due to close contacts or spatiotemporal proximity. Extended information is provided in Supplementary Table 1. b Phylogenetic tree of all AY.43 sequences generated in Freiburg, Germany, in late 2021 (Supplementary Data 1). The maximum-likelihood phylogenetic tree was constructed with IQ-Tree (1000 bootstrap replicates, GTR + F + R2) and rooted on the Wuhan-Hu-1 reference sequence (NC_045512). The tree was visualized with the R ggtree package. Lineages were assessed with pangolin v0.6 (pangolin data v1.8). Bar indicates substitutions per site.
Fig. 2
Fig. 2. Summary of relevant clinical parameters of the two SARS-CoV-2 infected kidney transplant patients.
Temporal overview of clinical parameters for patient 1 (a, c, e, g) and patient 2 (b, d, f). Day 0 indicates the first positive SARS-CoV-2 qPCR result of each patient. a, b Hospitalization and (c, d) immunosuppressive drugs of patient 1 and 2. e, f Diagnostic SARS-CoV-2 qPCR cycle threshold (Ct) values of oropharyngeal swabs. The horizontal dotted lines indicate the cut-off value (Ct ≥ 40) between positive and negative results. Virus isolation dates are indicated as circles. Vertical dotted lines mark the treatment time points with the mAb cocktail REGN-COV-2 (0.6 g of each Imdevimab and Casirivimab) and total intravenous IgG substitutions (10 g Octagam and 15/25 g Intratect). g Need for external oxygen of patient 1.
Fig. 3
Fig. 3. SARS-CoV-2 whole-genome sequencing identifies novel S mutations during viral persistence.
Schematic overview of the viral genome variations of swabs from patient 1 (a) and their virus isolates (b) in comparison to the Wuhan-Hu-1 reference sequence. The heatmap summarizes the positions in the viral genome and the variant frequencies in the different samples (shown are values above 15%). The days of sampling are indicated at the right, heatmap colour intensity indicates variant frequencies. For the isolates (b) sequencing results after virus isolation (passage 1) and additionally for day 0, 31 and 43 sequencing results after virus cultivation (passage 2) are shown. Raw reads are available at ENA (accession number ERP139553). c Schematic overview of the SARS-CoV-2 spike protein including the S1 and S2 cleavage products and functional domains such as the N-terminal domain (NTD), receptor-binding domain (RBD), receptor-binding motif (RBM), S1/S2 proteolytic furin cleavage site, fusion peptide (FP), heptad repeat regions (HR1/HR2), transmembrane domain (TM) and C-terminal domain (CT). Indicated are the novel non-synonymous changes in the spike (S) gene acquired during viral persistence. d, e Growth of the three patient isolates in d VeroE6 and e Calu-3 cells. The cells were either infected with a prototypic B.1 isolate (Muc-IMB-1) or one of the patient isolates (d0, d31, d43) using a multiplicity of infection of 0.001. At 24, 48 and 72 h post infection, cell culture supernatants were collected and viral titers were determined by plaque assay. The log-transformed titers are shown as means ± SD of results from four independent experiments. Dotted lines indicate the assay cut-off. Significance was determined via two-way ANOVA with a Sidak´s multiple comparison test (*p < 0.05, **p < 0.01). f Biolayer interferometry binding measurements of ACE-2 association with immobilized S showing variation of fractional signal saturation for different spike proteins. The solid line represents the best fit calculated using Levenberg-Marquardt method. The dissociation constant KD was calculated from the fitted line as well as from analysis of binding kinetics (Supplementary Fig. 2). Source data are provided in the Source Data file.
Fig. 4
Fig. 4. REGN-COV antibodies have a reduced neutralizing capacity and fail to protect in vivo against the late isolates of patient 1.
ac Neutralizing capacity of the therapeutic antibodies a Sotrovimab, b Imdevimab and c Casirivimab. Serial 10-fold dilutions of the monoclonal antibodies were incubated with 100 pfu of the B.1 isolate or the three patient isolates (d0, d31, d43) and analyzed by plaque assay. Neutralization titers 50 (NT50) values were calculated from individual curve fits of each serial dilutions (n = 3 biologically independent experiments). Shown are geometric mean and geometric standard deviation. Statistics were performed on log-transformed values with a one-way ANOVA (Tukey’s multiple comparison test, **p < 0.01). dg Weight loss as mean and standard error of means (d, f) and survival (e, g) of female, 20–27 weeks old hACE-2 transgenic mice untreated (mock) or treated intraperitoneally with 50 µg/mouse of Sotrovimab, Imdevimab or Casirivimab 18 h pre intranasal infection with 2.000 pfu of the d, e d0 or f, g d31 isolate. Age and sex for each animal is provided in the Source Data file. Significance for the survival was calculated with a log-rank (Mantel–Cox) test (**p < 0.05, ***p < 0.001). h 3D presentation of the RBD of the SARS-CoV-2 spike protein (PDB accession number: 6xdg, blue) and the d31 RBD predicted by AlphaFold 2 (green) bound to the Fab fragments of Imdevimab and Casirivimab. RBD mutations compared to Wuhan-Hu-1 (NC_045512.2) are marked in red. Bold amino acid substitutions are only present in the d31 isolate whereas mutations already present in the d0 isolate are marked in grey. Source data are provided in the Source Data file.
Fig. 5
Fig. 5. Clearance of the late isolates was associated with decrease in immunosuppression and total IgG substitution.
Temporal overview of serological analyses of patient 1 (a, c, e, g, i, k, m) and patient 2 (b, d, f, h, j, l). Day 0 indicates the first positive SARS-CoV-2 qPCR result of each patient. Vertical dotted lines mark the treatment time points with the mAb cocktail REGN-COV (0.6 g of each Imdevimab and Casirivimab) and the total intravenous IgG substitutions (10 g Octagam and 15/25 g Intratect). a, b Determination of total IgG, IgA and IgM in the patient sera. Detection of c, d SARS-CoV-2 S-1-subunit specific IgG, e, f SARS-CoV-2 N-specific IgG, g, h SARS-CoV-2 S and N-specific IgA and i, j SARS-CoV-2 S and N-specific IgM by ELISA. Horizontal lines mark the detection limits. km Neutralizing capacity of the sera of k patient 1, l patient 2 and m IgG-depleted sera of patient 1. Serial 2-fold dilutions of the patients’ sera were incubated with 100 pfu of the B.1 isolate or the three patient isolates (d0, d31, d43) and analyzed by plaque assay. Plotted are the neutralization titers 50 (NT50) values calculated from the individual curve fits of each serial dilutions (n = 3 biologically independent experiments). Shown is the geometric mean and geometric standard deviation. Statistics were performed on log-transformed values with a two-way ANOVA (Dunnett’s multiple comparison test, *p < 0.05, **p < 0.01, ***p < 0.001) and are compared to d0. Source data are provided in the Source Data file.

Similar articles

Cited by

References

    1. Choi B, et al. Persistence and evolution of SARS-CoV-2 in an immunocompromised host. N. Engl. J. Med. 2020;383:2291–2293. doi: 10.1056/NEJMc2031364. - DOI - PMC - PubMed
    1. Avanzato VA, et al. Case study: Prolonged infectious SARS-CoV-2 shedding from an asymptomatic immunocompromised individual with cancer. Cell. 2020;183:1901–1912. doi: 10.1016/j.cell.2020.10.049. - DOI - PMC - PubMed
    1. Aydillo T, et al. Shedding of viable SARS-CoV-2 after immunosuppressive therapy for cancer. N. Engl. J. Med. 2020;383:2586–2588. doi: 10.1056/NEJMc2031670. - DOI - PMC - PubMed
    1. Nussenblatt V, et al. Yearlong COVID-19 infection reveals within-host evolution of SARS-CoV-2 in a patient with B-cell depletion. J. Infect. Dis. 2022;225:1118–1123. doi: 10.1093/infdis/jiab622. - DOI - PMC - PubMed
    1. Sonnleitner ST, et al. Cumulative SARS-CoV-2 mutations and corresponding changes in immunity in an immunocompromised patient indicate viral evolution within the host. Nat. Commun. 2022;13:1–12. doi: 10.1038/s41467-022-30163-4. - DOI - PMC - PubMed

Publication types