[Preprint]. 2023 Mar 29:2023.03.28.534600.
doi: 10.1101/2023.03.28.534600.

Mathematical modeling suggests cytotoxic T lymphocytes control growth of B16 tumor cells in collagin-fibrin gels by cytolytic and non-lytic mechanisms

Affiliations

Mathematical modeling suggests cytotoxic T lymphocytes control growth of B16 tumor cells in collagin-fibrin gels by cytolytic and non-lytic mechanisms

Barun Majumder et al. bioRxiv. .

Update in

Abstract

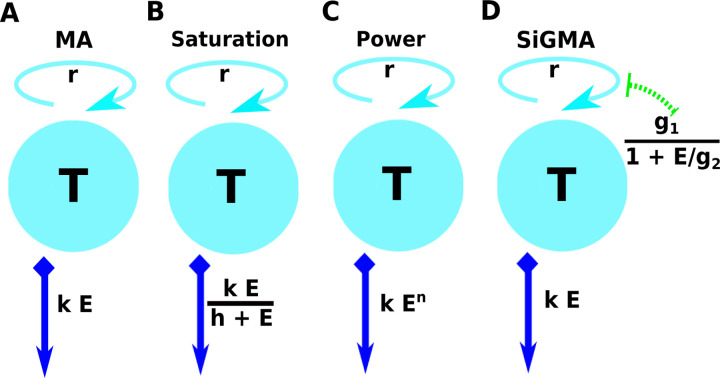
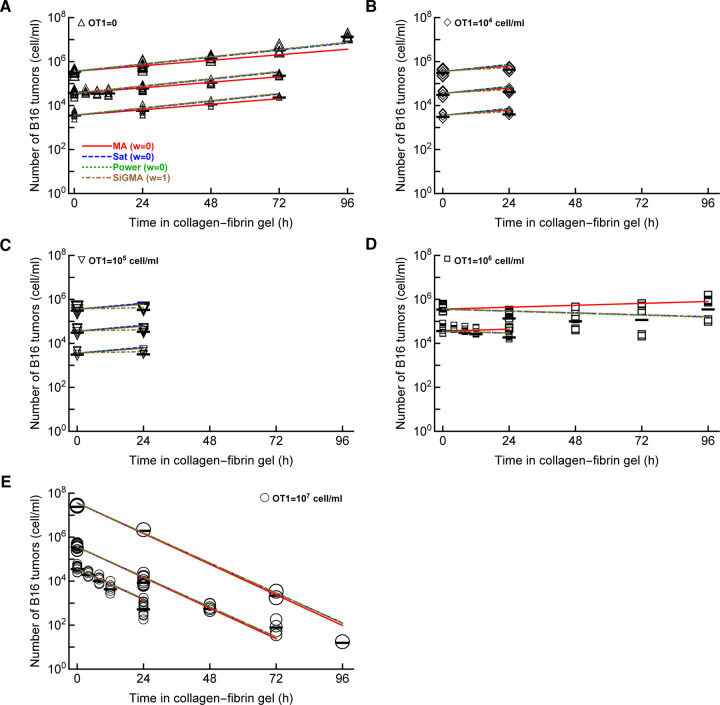
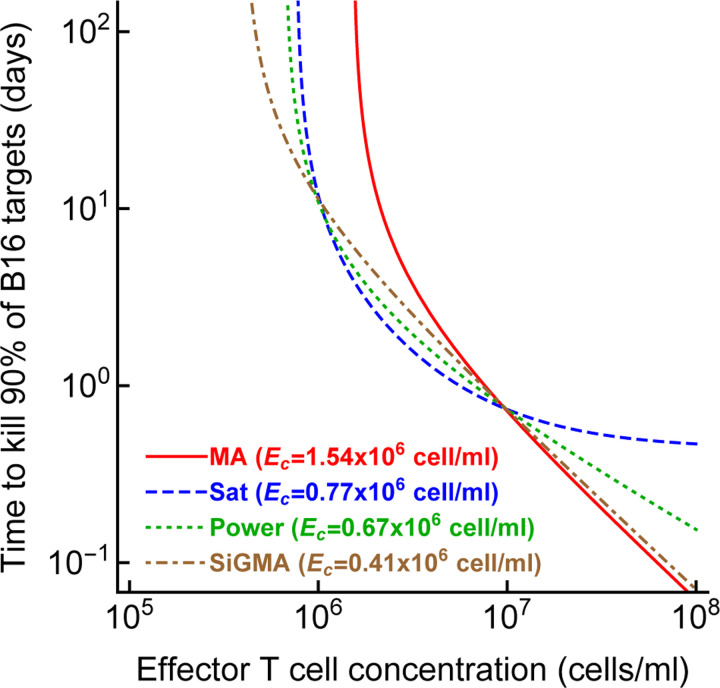
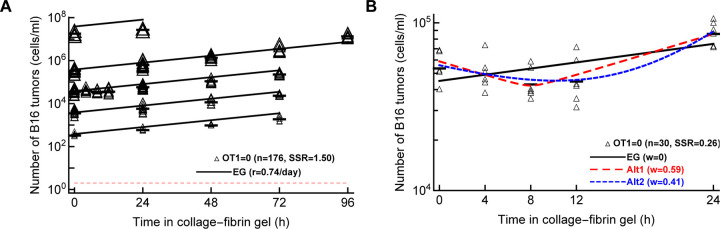
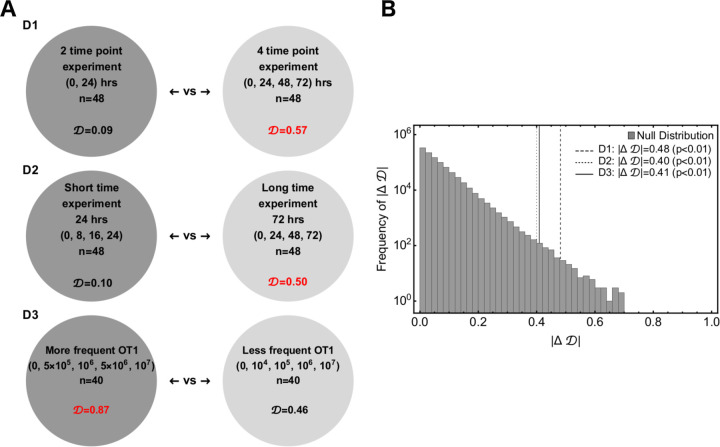
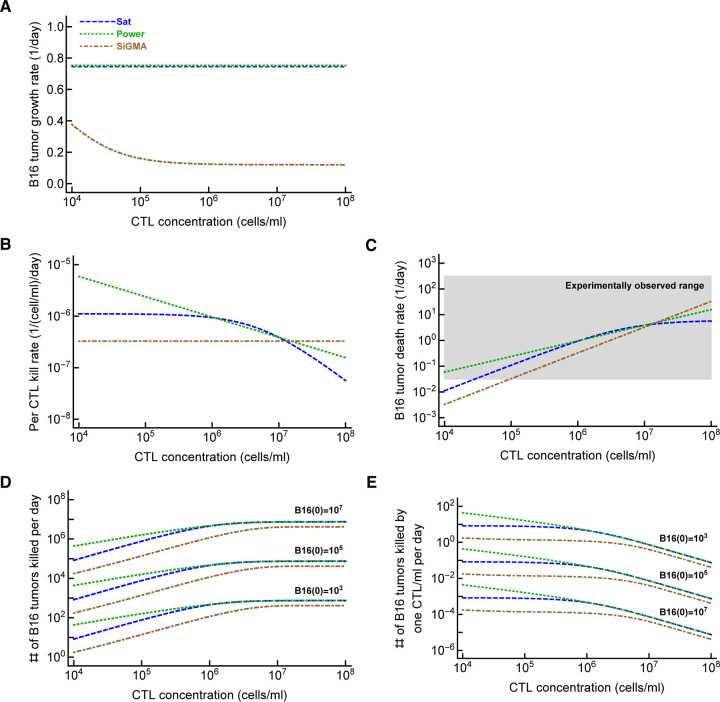
Cytotoxic T lymphocytes (CTLs) are important in controlling some viral infections, and therapies involving transfer of large numbers of cancer-specific CTLs have been successfully used to treat several types of cancers in humans. While molecular mechanisms of how CTLs kill their targets are relatively well understood we still lack solid quantitative understanding of the kinetics and efficiency at which CTLs kill their targets in different conditions. Collagen-fibrin gel-based assays provide a tissue-like environment for the migration of CTLs, making them an attractive system to study the cytotoxicity in vitro. Budhu et al. [1] systematically varied the number of peptide (SIINFEKL)- pulsed B16 melanoma cells and SIINFEKL-specific CTLs (OT-1) and measured remaining targets at different times after target and CTL co-inoculation into collagen-fibrin gels. The authors proposed that their data were consistent with a simple model in which tumors grow exponentially and are killed by CTLs at a per capita rate proportional to the CTL density in the gel. By fitting several alternative mathematical models to these data we found that this simple "exponential-growth-mass-action-killing" model does not precisely fit the data. However, determining the best fit model proved difficult because the best performing model was dependent on the specific dataset chosen for the analysis. When considering all data that include biologically realistic CTL concentrations ( E ≤ 10 7 cell/ml) the model in which tumors grow exponentially and CTLs suppress tumor's growth non-lytically and kill tumors according to the mass-action law (SiGMA model) fitted the data with best quality. Results of power analysis suggested that longer experiments (∼ 3 - 4 days) with 4 measurements of B16 tumor cell concentrations for a range of CTL concentrations would best allow to discriminate between alternative models. Taken together, our results suggest that interactions between tumors and CTLs in collagen-fibrin gels are more complex than a simple exponential-growth- mass-action killing model and provide support for the hypothesis that CTLs impact on tumors may go beyond direct cytotoxicity.


Figures

Figure 1:
Figure 1:. A schematic representation of the four main alternative models fitted to data on the dynamics of B16 tumor cells.
These models are as follows: (A): an exponential growth of tumors and a mass-action killing by CTLs (MA) model (eqn. (3)); (B): an exponential growth of tumors and saturation in killing by CTLs (Saturation or Sat) model (eqn. (4)); (C) an exponential growth of tumors and killing by CTLs in accord with a powerlaw (Power) model (eqn. (5)); and (D) an exponential growth of tumors with CTL-dependent suppression of the growth and mass-action killing of tumors by CTLs (SiGMA) model (eqn. (6)). The tumor growth rate r is shown on the top of the cyan spheres which represent the B16 tumor cells T . For the suppression in growth model with a mass-action term in killing (D,“SiGMA”), the E dependent suppression rate is presented over the green arrow. The killing rate k for each model is shown in the blue arrow pointing downwards. For example, the Power model is shown by a constant growth rate r with the death rate of the tumors by E CTLs is kEn.
Figure 2:
Figure 2:. The model assuming exponential growth of B16 tumor cells and mass-action killing by CTLs is not consistent with the B16 tumor dynamics.
We fitted mass-action killing (MA, eqn. (3) and Figure 1A), saturated killing (Sat, eqn. (4) and Figure 1B), powerlaw killing (Power, eqn. (5) and Figure 1C), and saturation in growth and mass-action killing (SiGMA, eqn. (6) and Figure 1D) models to data (Datasets 1–4) that includes all our available data with CTL densities ≤ 107 cells/ml (see Materials and Methods for more detail). The data are shown by markers and lines are predictions of the models. We show model fits for data for (A): OT1 = 0, (B): OT1 = 104 cell/ml, (C): OT1 = 105 cell/ml, (D): OT1 = 106 cell/ml, and (E): OT1 = 107 cell/ml. Parameters of the best fit models and measures of relative model fit quality are given in Table 1; Akaike weights w for the model fits are shown in panel A.
Figure 3:
Figure 3:. The CTL concentration needed to eliminate most B16 tumor cells depends on the model of tumor control by CTLs.
For every best fit model (Table 1) we calculated the time to kill 90% of B16 targets for a given concentration of CTLs (eqn. (7)). For every model we also calculated the control CTL concentration (Ec) that is required to eliminate at least 90% of the tumor cells within 100 days.
Figure 4:
Figure 4:. Pure exponential growth (EG) model is not consistent with the data on B16 tumor dynamics in the absence of CTLs.
(A): we fitted with an exponential growth model (eqn. (3) with E = 0) to data on B16 growth from all datasets 1–5 with OT1 = 0. The best fit values for the parameters along with 95% confidence intervals are: α = 2.6 (2.4 − 2.8) and r = 0.74 (0.69 − 0.79)/day. (B): we fitted exponential growth and two alternative models (eqn. (3) with E = 0 and eqns. (8)–(9)) to the data from Dataset 4 for which OT1 = 0. The relative quality of the model fits is shown by Akaike weights w (see Table S6 for model parameters and other fit quality metrics). The data are shown by markers and model predictions are shown by lines.
Figure 5:
Figure 5:. Power analysis indicates that longer experiments with several, closely spaced CTL concentrations would allow to best discriminate between alternative models.
We performed three sets of simulations to get insights into a hypothetical future experiment which may allow to better discriminate between alternative mathematical models. (A): Three experimental designs are: D1 – 2 time point vs 4 time point experiments; D2 — short time scale (0–24h) vs. long time scale (0–72h) experiments; D3 — more frequently chosen values of CTL concentrations vs less frequently chosen vales of CTL concentrations (see Figure S5 and Materials and methods for more details). For every experimental setup we calculate 𝒟 – the determinant of a matrix formed from a simulated experimental set whose columns are constrained. (B): We define a test measure |𝒟|obs between two sets of each of D1, D2 and D3 and compare the observed |𝒟|obs with the universal null distribution of |𝒟|null to compute the p-value. The values of 𝒟 in red in panel A shows the better experimental designs in the pairs.
Figure 6:
Figure 6:. Metrics to quantify efficacy of CTL-mediated control of tumors are model-dependent.
For the three alternative models (Sat, Power, and SiGMA) that fitted some subsets of data with best quality we calculated metrics that could be used to quantify impact of CTLs on tumor growth depending on the concentration of tumor-specific CTLs. These metrics include (A): the growth rate of the tumors (fg in eqn. (1)); (B): per capita kill rate of tumors (per 1 CTL per day, fk/E in eqn. (1)); (C): the death rate of tumors due to CTL killing (fk in eqn. (1)). The grey box shows the range of experimentally observed death rates of targets as observed in some previous experiments (see Discussion for more detail and [44]); (E): the total number of tumors killed per day as the function of 3 different initial tumor cell concentrations (indicated on the panel); and (D): the number of tumors killed per 1 CTL/ml per day. The latter two metrics were computed by taking the difference of growth and combined killing at 24 hours. The parameters for the models are given is Table 1 and model equations are given in eqns. (4)–(6).

Similar articles

References

    1. Budhu S., Loike J. D., Pandolfi A., Han S., Catalano G., Constantinescu A., Clynes R. & Silverstein S. C. 2010. CD8+ T cell concentration determines their efficiency in killing cognate antigen-expressing syngeneic mammalian cells in vitro and in mouse tissues. J Exp Med, 207(1), 223–35. - PMC - PubMed
    1. Halle S., Halle O. & Forster R. 2017. Mechanisms and dynamics of T cell-mediated cytotoxicity in vivo. Trends in Immunology, 38(6), 432–443. doi:10.1016/j.it.2017.04.002. - DOI - PubMed
    1. Halle S., Keyser K. A., Stahl F. R., Busche A., Marquardt A., Zheng X., Galla M., Heissmeyer V., Heller K. et al. 2016. In vivo killing capacity of cytotoxic T cells is limited and involves dynamic interactions and T cell cooperativity. Immunity, 44(2), 233–245. doi: 10.1016/j.immuni.2016.01.010. - DOI - PMC - PubMed
    1. Bossi G., Trambas C., Booth S., Clark R., Stinchcombe J. & Griffiths G. M. 2002. The secretory synapse: the secrets of a serial killer. Immunological Reviews, 189(1), 152–160. doi: 10.1034/j.1600-065X.2002.18913.x. - DOI - PubMed
    1. Jenkins M. R., Tsun A., Stinchcombe J. C. & Griffiths G. M. 2009. The strength of T cell receptor signal controls the polarization of cytotoxic machinery to the immunological synapse. Immunity, 31(4), 621–31. - PMC - PubMed

Publication types