Mustard gas exposure instigates retinal Müller cell gliosis
- PMID: 37023936
- PMCID: PMC10157651
- DOI: 10.1016/j.exer.2023.109461
Mustard gas exposure instigates retinal Müller cell gliosis
Abstract
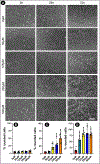
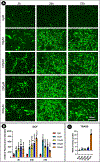
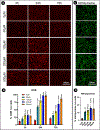
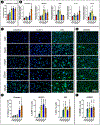
Sulfur mustard (SM) is a chemical warfare agent (CWA) that causes severe eye pain, photophobia, excessive lacrimation, corneal and ocular surface defects, and blindness. However, SM's effects on retinal cells are relatively meager. This study investigated the role of SM toxicity on Müller glial cells responsible for cellular architecture, inner blood-retinal barrier maintenance, neurotransmitter recycling, neuronal survival, and retinal homeostasis. Müller glial cells (MIO-M1) were exposed to SM analog, nitrogen mustard (NM), at varying concentrations (50-500 μM) for 3 h, 24 h, and 72 h. Müller cell gliosis was evaluated using morphological, cellular, and biochemical methods. Real-time cellular integrity and morphological evaluation were performed using the xCELLigence real-time monitoring system. Cellular viability and toxicity were measured using TUNEL and PrestoBlue assays. Müller glia hyperactivity was calculated based on glial fibrillary acidic protein (GFAP) and vimentin immunostaining. Intracellular oxidative stress was measured using DCFDA and DHE cell-based assays. Inflammatory markers and antioxidant enzyme levels were determined by quantitative real-time PCR (qRT-PCR). AO/Br and DAPI staining further evaluated DNA damage, apoptosis, necrosis, and cell death. Inflammasome-associated Caspase-1, ASC, and NLRP3 were studied to identify mechanistic insights into NM toxicity in Müller glial cells. The cellular and morphological evaluation revealed the Müller glia hyperactivity after NM exposure in a dose- and time-dependent manner. NM exposure caused significant oxidative stress and enhanced cell death at 72 h. A significant increase in antioxidant indices was observed at the lower concentrations of NM. Mechanistically, we found that NM-treated MIO-M1 cells increased caspase-1 levels that activated NLRP3 inflammasome-induced production of IL-1β and IL-18, and elevated Gasdermin D (GSDMD) expression, a crucial component actuating pyroptosis. In conclusion, NM-induced Müller cell gliosis via increased oxidative stress results in caspase-1-dependent activation of the NLRP3 inflammasome and cell death driven primarily by pyroptosis.
Keywords: Caspase 1; Cell death; Gliosis; Mustard gas; Müller glial cells; NLRP3; Nitrogen mustard; Oxidative stress; Pyroptosis; Retina; Sulfur mustard.
Copyright © 2023 Elsevier Ltd. All rights reserved.
Figures


Similar articles
-
A corneo-retinal hypercitrullination axis underlies ocular injury to nitrogen mustard.Exp Eye Res. 2023 Jun;231:109485. doi: 10.1016/j.exer.2023.109485. Epub 2023 Apr 18. Exp Eye Res. 2023. PMID: 37080381 Free PMC article.
-
Suppression of NLRP3 Inflammasome, Pyroptosis, and Cell Death by NIM811 in Rotenone-Exposed Cells as an in vitro Model of Parkinson's Disease.Neurodegener Dis. 2020;20(2-3):73-83. doi: 10.1159/000511207. Epub 2020 Nov 11. Neurodegener Dis. 2020. PMID: 33176317
-
Resveratrol Alleviates Retinal Ischemia-Reperfusion Injury by Inhibiting the NLRP3/Gasdermin D/Caspase-1/Interleukin-1β Pyroptosis Pathway.Invest Ophthalmol Vis Sci. 2023 Dec 1;64(15):28. doi: 10.1167/iovs.64.15.28. Invest Ophthalmol Vis Sci. 2023. PMID: 38133508 Free PMC article.
-
Does Pyroptosis Play a Role in Inflammasome-Related Disorders?Int J Mol Sci. 2022 Sep 9;23(18):10453. doi: 10.3390/ijms231810453. Int J Mol Sci. 2022. PMID: 36142364 Free PMC article. Review.
-
Research models of sulfur mustard- and nitrogen mustard-induced ocular injuries and potential therapeutics.Exp Eye Res. 2022 Oct;223:109209. doi: 10.1016/j.exer.2022.109209. Epub 2022 Aug 9. Exp Eye Res. 2022. PMID: 35961426 Review.
Cited by
-
The Involvement of Unfolded Protein Response in the Mechanism of Nitrogen Mustard-Induced Ocular Toxicity.J Pharmacol Exp Ther. 2024 Jan 17;388(2):518-525. doi: 10.1124/jpet.123.001814. J Pharmacol Exp Ther. 2024. PMID: 37914413 Free PMC article.
References
-
- Balali-Mood M; Hefazi M; Mahmoudi M; Jalali E; Attaran D; Maleki M; Razavi ME; Zare G; Tabatabaee A; Jaafari MR, Long-term complications of sulphur mustard poisoning in severely intoxicated Iranian veterans. Fundam Clin Pharmacol 2005, 19, (6), 713–21. - PubMed
-
- Banin E; Morad Y; Berenshtein E; Obolensky A; Yahalom C; Goldich J; Adibelli FM; Zuniga G; DeAnda M; Pe’er J; Chevion M, Injury Induced by Chemical Warfare Agents: Characterization and Treatment of Ocular Tissues Exposed to Nitrogen Mustard. Investigative Ophthalmology & Visual Science 2003, 44, (7), 2966–2972. - PubMed
-
- Bringmann A, Pannicke T, Grosche J, Francke M, Wiedemann P, Skatchkov SN, Osborne NN, Reichenbach A. Müller cells in the healthy and diseased retina. Prog Retin Eye Res. 2006. Jul;25(4):397–424. - PubMed
-
- Bringmann A; Wiedemann P, Müller Glial Cells in Retinal Disease. Ophthalmologica 2012, 227, (1), 1–19. - PubMed
Publication types
MeSH terms
Substances
Grants and funding
LinkOut - more resources
Full Text Sources
Miscellaneous

