. 2023 Apr 11;120(15):e2216028120.
doi: 10.1073/pnas.2216028120. Epub 2023 Apr 6.

LPS-aggregating proteins GBP1 and GBP2 are each sufficient to enhance caspase-4 activation both in cellulo and in vitro

Affiliations

LPS-aggregating proteins GBP1 and GBP2 are each sufficient to enhance caspase-4 activation both in cellulo and in vitro

Mary S Dickinson et al. Proc Natl Acad Sci U S A. .

Abstract

The gamma-interferon (IFNγ)-inducible guanylate-binding proteins (GBPs) promote host defense against gram-negative cytosolic bacteria in part through the induction of an inflammatory cell death pathway called pyroptosis. To activate pyroptosis, GBPs facilitate sensing of the gram-negative bacterial outer membrane component lipopolysaccharide (LPS) by the noncanonical caspase-4 inflammasome. There are seven human GBP paralogs, and it is unclear how each GBP contributes to LPS sensing and pyroptosis induction. GBP1 forms a multimeric microcapsule on the surface of cytosolic bacteria through direct interactions with LPS. The GBP1 microcapsule recruits caspase-4 to bacteria, a process deemed essential for caspase-4 activation. In contrast to GBP1, closely related paralog GBP2 is unable to bind bacteria on its own but requires GBP1 for direct bacterial binding. Unexpectedly, we find that GBP2 overexpression can restore gram-negative-induced pyroptosis in GBP1KO cells, without GBP2 binding to the bacterial surface. A mutant of GBP1 that lacks the triple arginine motif required for microcapsule formation also rescues pyroptosis in GBP1KO cells, showing that binding to bacteria is dispensable for GBPs to promote pyroptosis. Instead, we find that GBP2, like GBP1, directly binds and aggregates "free" LPS through protein polymerization. We demonstrate that supplementation of either recombinant polymerized GBP1 or GBP2 to an in vitro reaction is sufficient to enhance LPS-induced caspase-4 activation. This provides a revised mechanistic framework for noncanonical inflammasome activation where GBP1 or GBP2 assembles cytosol-contaminating LPS into a protein-LPS interface for caspase-4 activation as part of a coordinated host response to gram-negative bacterial infections.

Keywords: cell-autonomous immunity; guanylate-binding proteins; inflammasome; interferon-stimulated genes; lipopolysaccharide.


Conflict of interest statement

The authors declare no competing interest.

Figures

Fig. 1.
Fig. 1.
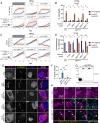
GBP1 targeting of S. flexneri is reduced in A549 cells compared to HeLa cells, but pyroptosis levels are similar. (A) A549 and HeLa cells were infected with the indicated strains, fixed at 1.5 h post infection, and immunostained for GBP1. S. flexneri with GBP1 surrounding >50% of the bacterial surface were counted as GBP1 positive. (B and C) A549 and HeLa cells were grown with or without 100 U/mL IFNγ overnight, then lysed for western blotting. Membranes were probed with antibodies against the indicated GBPs and GAPDH (B), or CASP4, GSDMD, and GAPDH (C). (DI) A549 and HeLa cells unprimed or primed with 100 U/mL IFNγ overnight were infected with the indicated S. flexneri strains expressing a bioluminescent reporter plasmid. Cell death was measured over time using sytox green fluorescence (D). 4 h timepoint of IFNγ primed cells was used for statistical analysis (E). Supernatant from IFNγ-primed cells infected with S. flexneri was removed at 3 hpi, and LDH levels (F) or IL-18 secretion (G) was measured. Bacterial luminescence was measured over time (H). Luminescence measurements from the 6 h timepoint were used to calculate the growth of each strain in primed cells relative to unprimed cells (I). Caspase-4 – CASP4. Graphs are averages from three independent experiments and are represented by mean ± SD. One-way ANOVA with Tukey’s multiple comparisons test was used, all statistically significant comparisons are shown. *P < 0.05, **P < 0.01, ***P < 0.001, ****P < 0.0001.
Fig. 2.
Fig. 2.
A549 cells require endogenous GBP1 for pyroptosis and restriction of S. flexneri growth. A549 cells were primed overnight with 100 U/mL IFNγ, then infected with wild-type S. flexneri or S. flexneri ΔipaH9.8ΔospC3 expressing a bioluminescent reporter plasmid. Cell death was measured using sytox green (A). Supernatant was taken at 3 hpi to measure IL-18 secretion (B). Bacterial growth was monitored by luminescence (C). Luminescence measurements from the 6 h timepoint were used to calculate the growth of each strain in primed cells relative to unprimed cells (D). Data are averages from three independent experiments and are represented by mean ± SD. Two-way ANOVA with Dunnett’s multiple comparisons test was used; for each bacterial strain, values for each knockout cell line were compared to the wild-type cells. All statistically significant comparisons are shown. *P < 0.05, **P < 0.01, ***P < 0.001, ****P < 0.0001.
Fig. 3.
Fig. 3.
Overexpression of GBP1 or GBP2 can rescue pyroptosis and bacterial restriction in GBP1KO cells. A549 cells were stably transduced to express mCherry or mCherry-GBPs. Cells were then infected with bioluminescent S. flexneri and cell death was measured over time using sytox green fluorescence in cells primed with 100 U/mL IFNγ overnight before infection (A). The sytox green signal at 4 h was used to determine statistical significance (B). Bacterial luminescence was measured over time (C). Luminescence measurements from the 6 h timepoint were used to calculate the growth of each strain in primed cells relative to unprimed cells (D). Data are averages from three independent experiments and are represented by mean ± SD. Two-way ANOVA with Tukey’s multiple comparisons test was used. Statistical comparisons are shown by letters, with bars sharing no matching letters being significantly different. Purple letters correspond to statistical comparisons for wild-type S. flexneri, and orange letters correspond to S. flexneri ΔipaH9.8ΔospC3.
Fig. 4.
Fig. 4.
GBP2 fails to bind bacteria on its own but forms small polymers. (A) Structures and schematics for GBP1, GBP2, and GBP5. All GBP paralogs consist of a large GTPase domain (LG), a middle domain (MD), and a GTPase effector domain (GED), whereby C-terminal isoprenyl moieties vary with GBP1 becoming post transcriptionally farnesylated, and GBP2 and GBP5 geranylgeranylated. (BD) Recombinant Alexa Fluor 488-labeled GBP1, GBP2, and GBP5 alone (B) or mixed with Alexa Fluor 647-labeled GBP1 (C) were supplemented with GTP and added to formaldehyde-fixed RFP-expressing S. flexneri. Confocal microscopy time-lapses were recorded, and targeted bacteria were quantified after 1 h (D). (E and F) GBP polymerization was monitored in UV-absorbance-based light scattering experiments. Equal molar ratios of recombinant GBP1, GBP2, or GBP5 were mixed with GBP1, and polymerization was induced with GTP (E). GTP-induced polymerization of single GBPs was monitored over time (F). (G) Number-weighted mean radius (Rn) of nucleotide-free (apo) or GDP·AlFX-bound nonisoprenylated (nonfarnesylated - nf, nongeranylgeranylated - ngg) and isoprenylated GBPs was determined in DLS experiments. (A) PDB entry 1F5N and AlphaFold models AF-P32456, AF-Q96PP8. (B and C) Representative images of three independent experiments. (D and G) Graphs are averages from three independent experiments and are represented by mean ± SD. (D) One-way ANOVA with Dunnett’s multiple comparisons test comparing to GBP1488+ S. flexneri was used, all statistically significant comparisons are shown. ****P < 0.0001. (E and F) Representative graphs from two independent experiments.
Fig. 5.
Fig. 5.
GBP1-dependent pyroptosis and restriction of S. flexneri growth is independent of GBP1 binding to bacteria. (AD) Wild-type A549 or GBP1KO cells expressing mCherry or mCherry-GBP1 mutants were unprimed or primed with 100 U/mL IFNγ overnight, where indicated. Cells were infected with S. flexneri expressing a bioluminescent reporter and cell death was measured over time using sytox green fluorescence (A). The sytox green signal at 4 h was used to determine statistical significance (B). Bacterial luminescence was measured over time (C). Luminescence measurements from the 6 h timepoint were used to calculate the growth of each strain in primed cells relative to unprimed cells (D). (E and F) Wild-type A549 or GBP1KO cells expressing mCherry or mCherry-GBP1 mutants were primed overnight with IFNγ, then infected with GFP expressing S. flexneri ΔipaH9.8, and fixed at 2 h post infection. (E) Coverslips were imaged at 100× magnification using widefield microscopy. Images were deconvolved and z-projections are shown, scale bar are 5 μm. (F) Coverslips were imaged at 63× magnification, with images taken from five independent fields. Targeting of S. flexneri by each overexpressed protein was quantified using ImageJ. S. flexneri with indicated protein around at least 50% of the bacterial membrane were counted as targeted. (G) Expression levels of indicated overexpressed proteins determined by western blot. (H) Frames from timelapse microscopy at indicated time points for GBP1KO cells expressing mCherry, mCherry-GBP1, or mCherry-GBP13R infected with GFP expressing S. flexneri ΔospC3ΔipaH9.8. Dying cells are shown in blue (sytox blue). All graphs show averages from three independent experiments and are represented by mean ± SD. (B and D) Significance was determined using two-way ANOVA with Tukey’s multiple comparisons test. Statistical comparisons are shown by letters, with bars sharing no matching letters being significantly different. Purple letters correspond to statistical comparisons for wild-type S. flexneri, and orange letters correspond to S. flexneri ΔipaH9.8ΔospC3. (F) One-way ANOVA with Tukey’s multiple comparisons test was used. All significant comparisons are shown. *P < 0.05, **P < 0.01, ***P < 0.001, ****P < 0.0001.
Fig. 6.
Fig. 6.
Ectopically expressed GBP1, GBP13R, and GBP2 can rescue pyroptosis in GBP1KO cells transfected with LPS. (A) Wild-type and GBP1KO A549 cells in 96-well plates were unprimed or primed with 100 U/mL IFNγ overnight, then transfected with 0.1 μg or 1 μg per well E. coli O55:B5 LPS. Cell death was measured using sytox green fluorescence at 6 h post transfection. (B) GBP1KO A549 cells were transduced with tet-inducible expression vectors, and expression of each construct was titrated with different concentrations of anhydrotetracycline (aTc). Cells were unprimed or primed with 100 U/mL IFNγ overnight, then transfected with 1 μg E. coli O55:B5 LPS per well. Cell death was measured using sytox green fluorescence at 6 h post transfection. (C and D) Wild-type A549 or GBP1KO A549 cells overexpressing mCherry or the indicated mCherry-GBPs in 96-well plates were unprimed or primed with 100 U/mL IFNγ overnight, then transfected with 0.1 μg (solid bars) or 1 μg (striped bars) E. coli O55:B5 LPS per well. Cell death was measured using sytox green fluorescence at 6 h post transfection (B). IL-18 secretion was measured in supernatants taken at 6 h post transfection (C). All graphs show averages from three independent experiments and are represented by mean ± SD. (A) One-way ANOVA with Tukey’s multiple comparisons test was used. All significant comparisons are shown. *P < 0.05, **P < 0.01, ***P < 0.001, ****P < 0.0001. (BD) Significance was determined using two-way ANOVA with Tukey’s multiple comparisons test. Statistical comparisons are shown by letters, with bars sharing no matching letters being significantly different. (C and D) Black letters correspond to statistical comparisons for 0.1 μg per well LPS, and blue letters correspond to 1 μg per well LPS.
Fig. 7.
Fig. 7.
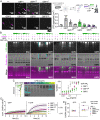
GBP1 and GBP2 bind and aggregate LPS and promote caspase-4 activation in vitro. (A) Recombinant isoprenylated and nonisoprenylated GBPs were supplemented with GTP and added to Alexa Fluor 568-labeled E. coli O55:B5 LPS. LPS particles were analyzed from different fields of view taken after 20 min with Fiji, and the average aggregate area was plotted. (B and C) Following mixing of recombinant proteins with E. coli O55:B5 LPS in the presence of different nucleotides, protein-LPS complexes were resolved with NPAGE, and gels were stained successively for LPS and proteins. (B) NPAGEs of BSA, GBP1, GBP2, and GBP5 supplemented with GDP or GDP·AlFX in the absence or presence of LPS (final concentrations 1 mg/mL, 0.1 mg/L, or 0.01 mg/mL). (C) NPAGE of GBP1 titrated with LPS (final concentrations 2 mg/mL to 0.008 mg/mL) supplemented with GDP·AlFX. Gray values for each gel lane were plotted with Fiji and areas were defined representing unshifted and shifted protein fractions. Percentage of shifted protein was plotted against LPS concentrations. (D and E) Following mixing of recombinant proteins with E. coli O55:B5 LPS in the absence or presence of GTP, protein-LPS complexes were added to recombinant caspase-4, and caspase-4 activity was determined by monitoring release of free 7-Amino-4-methylcoumarin (AMC) upon cleavage of fluorogenic caspase substrate Z-VAD-AMC over time. (D) Fluorescence intensities were normalized to basal caspase-4 activities. (E) The area under the curve was used to determine statistical significance. Caspase-4 – CASP4. All graphs show averages from three independent experiments and are represented by mean ± SD. (A and E) One-way ANOVA with Dunnett’s multiple comparisons test comparing to control (no GBP addition) was used. All significant comparisons are shown. *P < 0.05, ****P < 0.0001. (B and C) Representative NPAGEs from two (B) or three (C) independent experiments are shown.

Similar articles

Cited by

References

    1. Randow F., MacMicking J. D., James L. C., Cellular self-defense: How cell-autonomous immunity protects against pathogens. Science 340, 701–706 (2013). - PMC - PubMed
    1. Poltorak A., et al. , Defective LPS signaling in C3H/HeJ and C57BL/10ScCr mice: Mutations in Tlr4 gene. Science 282, 2085–2088 (1998). - PubMed
    1. Rosadini C. V., Kagan J. C., Early innate immune responses to bacterial LPS. Curr. Opin. Immunol. 44, 14–19 (2017). - PMC - PubMed
    1. Shi J., et al. , Inflammatory caspases are innate immune receptors for intracellular LPS. Nature 514, 187–192 (2014). - PubMed
    1. Aachoui Y., et al. , Caspase-11 protects against bacteria that escape the vacuole. Science 339, 975–978 (2013). - PMC - PubMed

Publication types