. 2023 Jun 9;51(10):4942-4958.
doi: 10.1093/nar/gkad243.

Identification of key residues of the DNA glycosylase OGG1 controlling efficient DNA sampling and recruitment to oxidized bases in living cells

Affiliations

Identification of key residues of the DNA glycosylase OGG1 controlling efficient DNA sampling and recruitment to oxidized bases in living cells

Ostiane D'Augustin et al. Nucleic Acids Res. .

Abstract

The DNA-glycosylase OGG1 oversees the detection and clearance of the 7,8-dihydro-8-oxoguanine (8-oxoG), which is the most frequent form of oxidized base in the genome. This lesion is deeply buried within the double-helix and its detection requires careful inspection of the bases by OGG1 via a mechanism that remains only partially understood. By analyzing OGG1 dynamics in the nucleus of living human cells, we demonstrate that the glycosylase constantly samples the DNA by rapidly alternating between diffusion within the nucleoplasm and short transits on the DNA. This sampling process, that we find to be tightly regulated by the conserved residue G245, is crucial for the rapid recruitment of OGG1 at oxidative lesions induced by laser micro-irradiation. Furthermore, we show that residues Y203, N149 and N150, while being all involved in early stages of 8-oxoG probing by OGG1 based on previous structural data, differentially regulate the sampling of the DNA and recruitment to oxidative lesions.


Figures

Figure 1.
Figure 1.
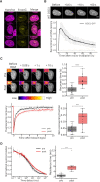
OGG1 dynamically samples the DNA within the cell nucleus. (A) Left: Normalized FCS autocorrelation curves obtained for WT OGG1-GFP, a GPF dimer (GFP2) and a GFP pentamer (GFP5) expressed in HeLa OGG1 KO cells. Right: Residence times of the GFP-tagged constructs within the focal volume estimated from the fit of the autocorrelation curves. Twelve cells per condition. (B) Left: Representative confocal images of HeLa OGG1 KO cells expressing either WT OGG1-GFP or a GFP dimer (GFP2) and counterstained with Hoechst. Scale bar: 5 μm. Right: Colocalization between the GFP and Hoechst channels estimated by calculation of the Pearson's coefficients (44 cells for OGG1-GFP, 50 cells for GFP2). (C) Left: Normalized FCS autocorrelation curves obtained for GFP-tagged WT OGG1, OGG1-F319A and OGG1-H270A expressed in HeLa OGG1 KO cells. Right: Residence times of the GFP-tagged constructs within the focal volume estimated from the fit of the autocorrelation curves. Twelve cells per condition. (D) Representative time-course images of the fluorescence recovery after photobleaching of circular area of variable sizes within the nucleus of HeLa OGG1 KO cells expressing WT OGG1-GFP. The bleached regions with diameters of 10, 20 and 40 pixels are shown with red dashed circles. Scale bar: 5 μm. (E) Left: Normalized fluorescence recovery curves for WT OGG1-GFP obtained from the images shown in D. Right: Characteristic recovery times estimated from the fit of the curves. Twelve cells per condition. (F) Normalized autocorrelation curve obtained for WT OGG1-GFP expressed in HeLa OGG1 KO cells. Median of twelve cells. The experimental curve (black) is fitted either with a simple diffusion model (blue) or an anomalous diffusion model (red).
Figure 2.
Figure 2.
OGG1 is rapidly recruited to 8-oxoG lesions induced by laser micro-irradiation and displays rapid turnover at sites of damage. (A) Representative confocal images of HeLa OGG1 KO after laser micro-irradiation and immunostaining against 8-oxoG. DNA was counterstained with Hoechst. Scale bar: 5 μm. (B) Top: Representative time-course images of the accumulation of WT OGG1-GFP at sites of laser micro-irradiation in the nucleus of OGG1 KO cells. White arrowheads indicate the micro-irradiated line. Scale bar: 5 μm. Bottom: Curve of the recruitment kinetics of WT OGG1-GFP at sites of micro-irradiation measured from the time-course images. Median of twelve cells. (C) Left: Representative time-course images and normalized curves of the fluorescence recovery after photobleaching within the nucleus of HeLa OGG1 KO cells expressing WT OGG1-GFP before damage (pre) and at sites of laser micro-irradiation (post). Insets in pseudocolor show a magnified view of the micro-irradiated region. Scale bar: 5 μm. Right: Characteristic recovery times and immobile fractions estimated from the fits of the fluorescence recovery curves. Sixteen cells before and after damage. (D) Left: Normalized FCS autocorrelation curves measured for WT OGG1-GFP before damage (pre) and at sites of laser micro-irradiation (post) in the nucleus of HeLa OGG1 KO cells. Right: Residence times of WT OGG1-GFP within the focal volume estimated from the fit of the autocorrelation curves. Eleven cells before and after damage.
Figure 3.
Figure 3.
Direct detection of 8-oxoG by OGG1 is essential for its efficient accumulation at sites of DNA damage. (A) Representative time-course images of the accumulation of GFP-tagged OGG1-WT, OGG1-F319A and OGG1-H270A at sites of laser micro-irradiation in the nucleus of HeLa OGG1 KO cells. White arrowheads indicate the micro-irradiated line. Scale bar: 5 μm. (B) Left: Curves of the recruitment kinetics of OGG1-WT, F319A and H270A at sites of micro-irradiation derived from the images shown in A. Right: Peak recruitment extracted from the recruitment curves. Twelve cells per condition. (C) Left: Normalized FCS autocorrelation curves measured for GFP-tagged OGG1-WT, OGG1-F319A and OGG1-H270A before damage (pre) and at sites of laser micro-irradiation (post) in the nucleus of HeLa OGG1 KO cells. Right: Residence time of the different constructs within the focal volume estimated from the fit of the autocorrelation curves. Twelve cells per condition. (D) Representative time-course images of the accumulation of WT OGG1-GFP at sites of laser micro-irradiation in the nucleus of HeLa OGG1 KO cells left untreated (NT), or treated with 30 μM of the OGG1 inhibitor TH5487. White arrowheads indicate the micro-irradiated line. Scale bar: 5 μm. (E) Left: Curves of the recruitment kinetics of OGG1-WT at sites of micro-irradiation derived from the images shown in (D). Right: Peak recruitment extracted from the recruitment curves. Twelve cells per condition.
Figure 4.
Figure 4.
Conserved residue G245 is essential for OGG1 association with DNA. (A) Representative gel-shifts showing the binding of purified GST-tagged OGG1-WT and OGG1-G245A to 8-oxoG:C (left) and G:C (right) containing DNA duplexes for concentrations of proteins ranging between 0 and 160 nM. (B) Left: Normalized FCS autocorrelation curves measured for GFP-tagged OGG1-WT and OGG1-G245A in the absence of laser micro-irradiation in the nucleus of HeLa OGG1 KO cells. Right: Residence time of the two constructs within the focal volume estimated from the fit of the autocorrelation curves. Ten cells per condition. (C) Representative gels of the cleavage of an 8-oxoG:C containing oligonucleotide by increasing concentrations of GST-tagged OGG1-WT and OGG1-G245A ranging between 0 and 160 nM. (D) Quantification of the relative amounts of cleavage product from the gels shown in (C). Mean of three independent repeats. (E) Representative time-course images of the accumulation of GFP-tagged OGG1-WT and OGG1-G245A at sites of laser micro-irradiation in the nucleus of HeLa OGG1 KO cells. White arrowheads indicate the micro-irradiated line. Scale bar: 5 μm. (F) Left: Curves of the recruitment kinetics of OGG1-WT and OGG1-G245A at sites of micro-irradiation derived from the images shown in (E). Right: Peak recruitment extracted from the recruitment curves. Sixteen cells per condition.
Figure 5.
Figure 5.
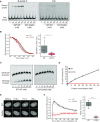
Mutating the probing residues Y203 and N149/N150 have differential impacts on the DNA binding properties and DNA-glycosylase activity of OGG1 in vitro. (A) Representative gel-shifts showing the binding of purified OGG1-WT, OGG1-N149A/N150A (2NA) and OGG1-Y203A to radiolabeled DNA duplexes free of damage (G:C) or containing an 8-oxoG:C pair (8-oxoG:C). The protein concentrations are shown below the gels. C1 refers to the specific lesion recognition complex composed of 1 protein per 8-oxoG:C probe while C2 corresponds to a non-specific complex probably composed of two OGG1 proteins binding to one DNA duplex molecule, irrespectively of the presence of the lesions. (B) Titration curves of the relative amounts of DNA/protein complex (C1 or C2 as indicated) as a function of the protein concentration for OGG1-WT, OGG1-2NA and OGG1-Y203A interacting with an undamaged DNA probe (G:C) or an 8-oxoG:C containing DNA probe (8-oxoG:C). These titration curves were estimated from the gel-shifts shown on Fig S7. Each point corresponds to the mean of at least three independent repeats. For OGG1-Y203A, the dramatic loss of affinity for 8-oxoG did not allow to monitor the titration curve of the C1 complex. (C) Top: Representative gels of the amounts of 8-oxoG:C containing radiolabelled oligonucleotide substrate (S) and its OGG1 cleavage product (P) for growing concentrations of OGG1-WT, OGG1-2NA and OGG1-Y203A. Bottom: Quantification of the relative amounts of cleavage product as a function of the protein concentration from the gels shown above. Each point corresponds to the mean of at least three independent repeats.
Figure 6.
Figure 6.
Mutating the probing residues Y203 and N149/N150 have differential impacts the dynamics of OGG1 DNA sampling and recruitment to laser-induced 8-oxoG in living cells. (A) Left: Normalized FCS autocorrelation curves for GFP-tagged OGG1-WT and OGG1-Y203A in the absence of laser micro-irradiation in the nucleus of HeLa OGG1 KO cells. Right: Residence time of the two constructs within the focal volume estimated from the fit of the autocorrelation curves. Twelve cells per condition. (B) Left: Normalized FCS autocorrelation curves for GFP-tagged OGG1-WT and OGG1-N149A/N150A (2NA) in the absence of laser micro-irradiation in the nucleus of HeLa OGG1 KO cells. Right: Residence time of the two constructs within the focal volume estimated from the fit of the autocorrelation curves. Sixteen cells per condition. (C) Left: Representative time-course images of the accumulation of GFP-tagged OGG1-WT, OGG1-Y203A, OGG1-2NA and OGG1-K249Q at sites of laser micro-irradiation in the nucleus of HeLa OGG1 KO cells. White arrowheads indicate the micro-irradiated line. Scale bar: 5 μm. Right: Curves of the recruitment kinetics of the different OGG1 constructs at sites of micro-irradiation derived from the images shown on the left. (D) Peak recruitment of the different OGG1 constructs extracted from the recruitment curves shown in (C). Twelve cells per condition. (E) Residual accumulation relative to peak recruitment estimated for OGG1-WT, OGG1-2NA and OGG1-K249Q from the recruitment curves shown in (C). This relative residual accumulation is measured at the time corresponding to the dissipation of half of the peak recruitment for the wild-type construct. Twelve cells per condition. (F) Representative time-course images of the accumulation of WT OGG1-GFP at sites of laser micro-irradiation in the nucleus of HeLa OGG1 KO cells left untreated (NT), or treated with 30 μM of the OGG1 inhibitor O8-Cl. White arrowheads indicate the micro-irradiated line. Scale bar: 5 μm. (G) Left: Curves of the recruitment kinetics of OGG1-WT at sites of micro-irradiation derived from the images shown in (F). Right: Peak recruitment and residual accumulation extracted from the recruitment curves. Twelve cells per condition.
Figure 7.
Figure 7.
Model summarizing the impacts of the mutations studied in this work on the different steps of 8-oxoG detection and clearance by OGG1.

Similar articles

Cited by

References

    1. Hall D.B., Holmlin R.E., Barton J.K.. Oxidative DNA damage through long-range electron transfer. Nature. 1996; 382:731–735. - PubMed
    1. Sampath H., McCullough A.K., Lloyd R.S.. Regulation of DNA glycosylases and their role in limiting disease. Free Radical Res. 2012; 46:460–478. - PMC - PubMed
    1. Sheng Z., Oka S., Tsuchimoto D., Abolhassani N., Nomaru H., Sakumi K., Yamada H., Nakabeppu Y.. 8-Oxoguanine causes neurodegeneration during MUTYH-mediated DNA base excision repair. J. Clin. Invest. 2012; 122:4344–4361. - PMC - PubMed
    1. López-Otín C., Blasco M.A., Partridge L., Serrano M., Kroemer G.. The hallmarks of aging. Cell. 2013; 153:1194–1217. - PMC - PubMed
    1. Bradley-Whitman M.A., Timmons M.D., Beckett T.L., Murphy M.P., Lynn B.C., Lovell M.A.. Nucleic acid oxidation: an early feature of Alzheimer's disease. J. Neurochem. 2014; 128:294–304. - PMC - PubMed

Publication types