

Lint percentage and boll weight QTLs in three excellent upland cotton (Gossypium hirsutum): ZR014121, CCRI60, and EZ60
- PMID: 37020180
- PMCID: PMC10074700
- DOI: 10.1186/s12870-023-04147-5
Lint percentage and boll weight QTLs in three excellent upland cotton (Gossypium hirsutum): ZR014121, CCRI60, and EZ60
Abstract
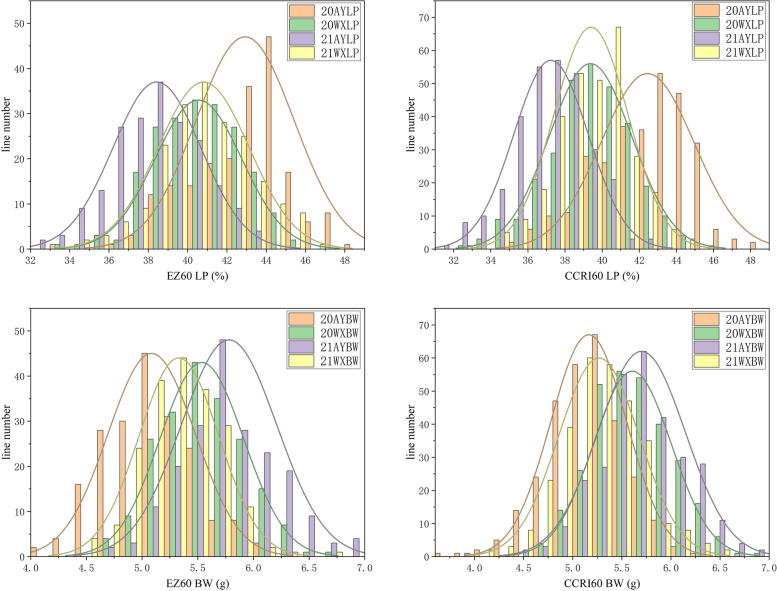
Background: Upland cotton (Gossypium hirsutum L.) is the most economically important species in the cotton genus (Gossypium spp.). Enhancing the cotton yield is a major goal in cotton breeding programs. Lint percentage (LP) and boll weight (BW) are the two most important components of cotton lint yield. The identification of stable and effective quantitative trait loci (QTLs) will aid the molecular breeding of cotton cultivars with high yield.
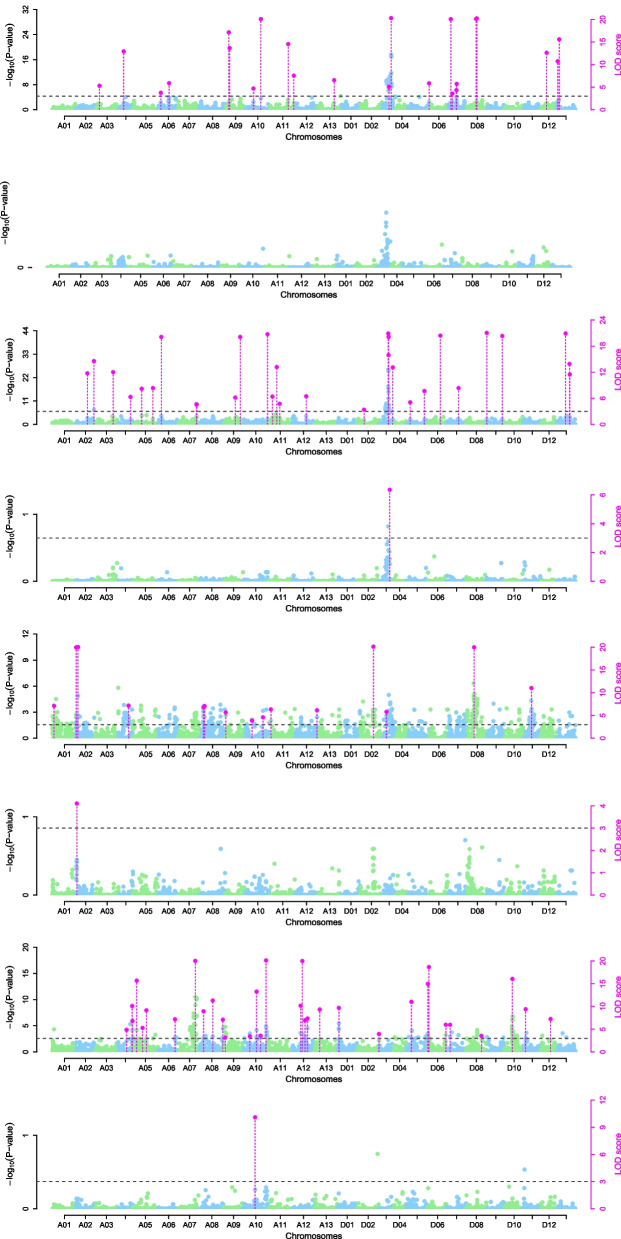
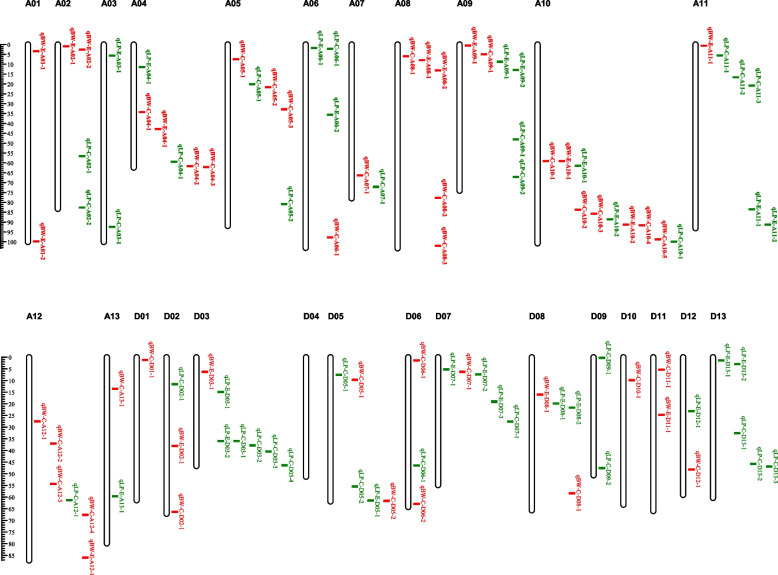
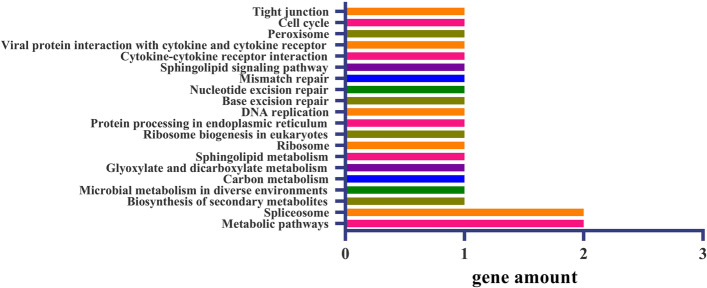
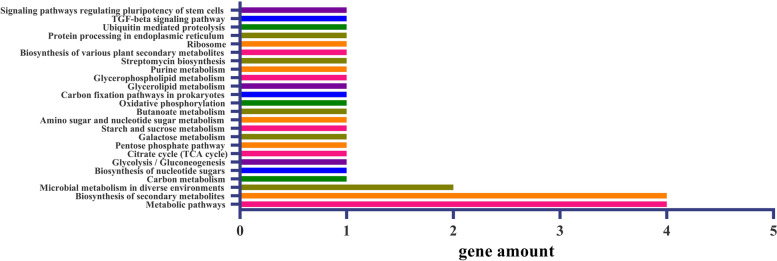
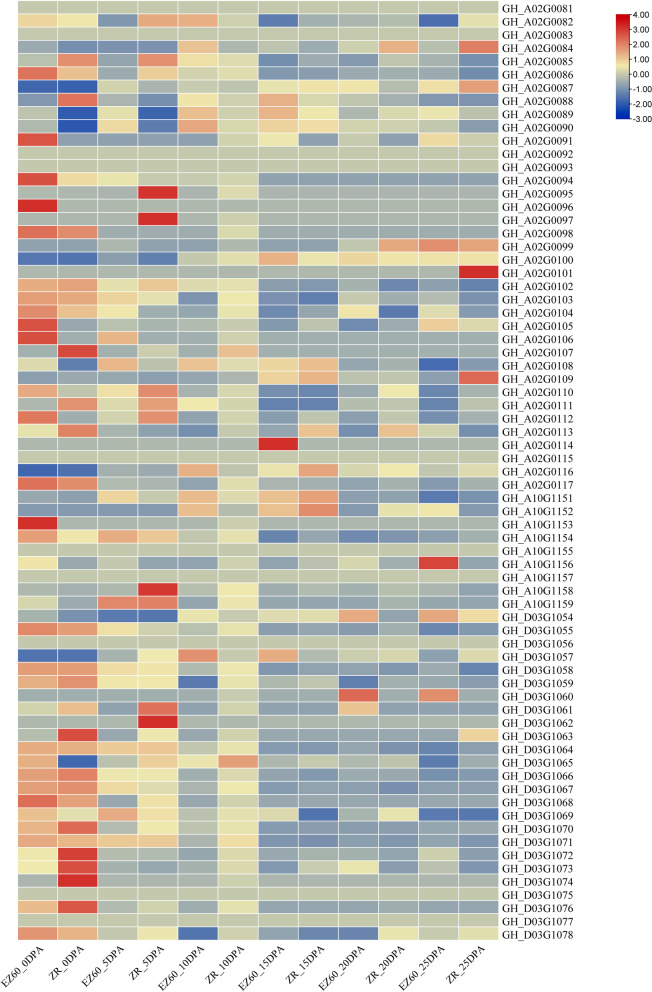
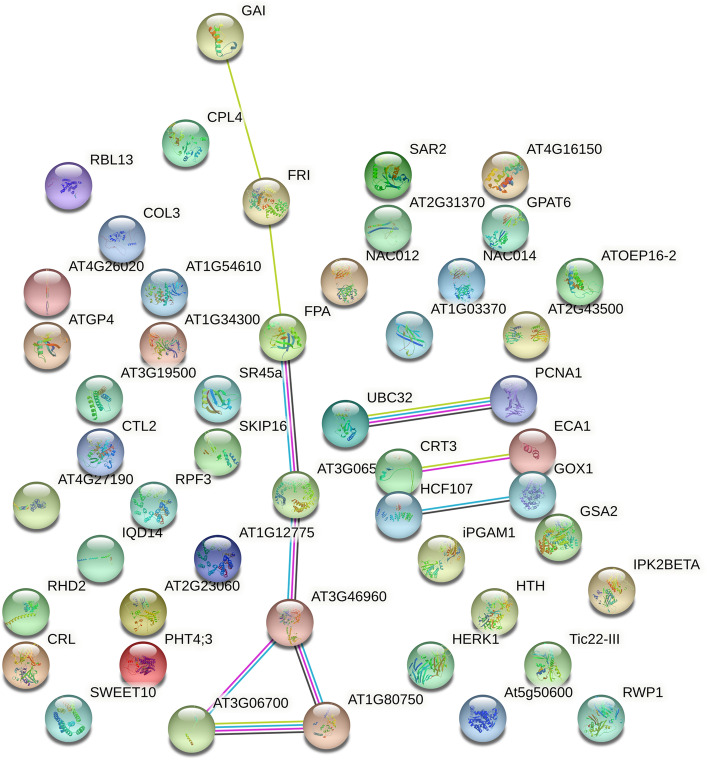
Results: Genotyping by target sequencing (GBTS) and genome-wide association study (GWAS) with 3VmrMLM were used to identify LP and BW related QTLs from two recombinant inbred line (RIL) populations derived from high lint yield and fiber quality lines (ZR014121, CCRI60 and EZ60). The average call rate of a single locus was 94.35%, and the average call rate of an individual was 92.10% in GBTS. A total of 100 QTLs were identified; 22 of them were overlapping with the reported QTLs, and 78 were novel QTLs. Of the 100 QTLs, 51 QTLs were for LP, and they explained 0.29-9.96% of the phenotypic variation; 49 QTLs were for BW, and they explained 0.41-6.31% of the phenotypic variation. One QTL (qBW-E-A10-1, qBW-C-A10-1) was identified in both populations. Six key QTLs were identified in multiple-environments; three were for LP, and three were for BW. A total of 108 candidate genes were identified in the regions of the six key QTLs. Several candidate genes were positively related to the developments of LP and BW, such as genes involved in gene transcription, protein synthesis, calcium signaling, carbon metabolism, and biosynthesis of secondary metabolites. Seven major candidate genes were predicted to form a co-expression network. Six significantly highly expressed candidate genes of the six QTLs after anthesis were the key genes regulating LP and BW and affecting cotton yield formation.
Conclusions: A total of 100 stable QTLs for LP and BW in upland cotton were identified in this study; these QTLs could be used in cotton molecular breeding programs. Putative candidate genes of the six key QTLs were identified; this result provided clues for future studies on the mechanisms of LP and BW developments.
Keywords: Boll weight; Candidate gene; Lint percentage; Quantitative trait locus (QTL); Upland cotton (Gossypium hirsutum L.).
© 2023. The Author(s).
Conflict of interest statement
The authors declare there are no competing interests.
Figures

Similar articles
-
Genome-wide association analysis reveals quantitative trait loci and candidate genes involved in yield components under multiple field environments in cotton (Gossypium hirsutum).BMC Plant Biol. 2021 May 31;21(1):250. doi: 10.1186/s12870-021-03009-2. BMC Plant Biol. 2021. PMID: 34059007 Free PMC article.
-
An RTM-GWAS procedure reveals the QTL alleles and candidate genes for three yield-related traits in upland cotton.BMC Plant Biol. 2020 Sep 7;20(1):416. doi: 10.1186/s12870-020-02613-y. BMC Plant Biol. 2020. PMID: 32894064 Free PMC article.
-
Genome-wide association reveals genetic variation of lint yield components under salty field conditions in cotton (Gossypium hirsutum L.).BMC Plant Biol. 2020 Jan 14;20(1):23. doi: 10.1186/s12870-019-2187-y. BMC Plant Biol. 2020. PMID: 31937242 Free PMC article.
-
Genome-wide association study reveals novel quantitative trait loci and candidate genes of lint percentage in upland cotton based on the CottonSNP80K array.Theor Appl Genet. 2022 Jul;135(7):2279-2295. doi: 10.1007/s00122-022-04111-1. Epub 2022 May 16. Theor Appl Genet. 2022. PMID: 35570221 Review.
-
Inheritance, QTLs, and Candidate Genes of Lint Percentage in Upland Cotton.Front Genet. 2022 Mar 31;13:855574. doi: 10.3389/fgene.2022.855574. eCollection 2022. Front Genet. 2022. PMID: 35450216 Free PMC article. Review.
Cited by
-
Genome-wide association study of fiber yield-related traits uncovers the novel genomic regions and candidate genes in Indian upland cotton (Gossypium hirsutum L.).Front Plant Sci. 2023 Oct 23;14:1252746. doi: 10.3389/fpls.2023.1252746. eCollection 2023. Front Plant Sci. 2023. PMID: 37941674 Free PMC article.
References
-
- Chen ZJ, Scheffler BE, Dennis E, Triplett BA, Zhang T, Guo W, Chen X, Stelly DM, Rabinowicz PD, Town CD, Arioli T, Brubaker C, Cantrell RG, Lacape JM, Ulloa M, Chee P, Gingle AR, Haigler CH, Percy R, Saha S, Wilkins T, Wright RJ, Van Deynze A, Zhu Y, Yu S, Abdurakhmonov I, Katageri I, Kumar PA, Rahman, M-U, Zafar Y, Yu JZ, Kohel R J , Wendel JF, Paterson AH. Toward sequencing cotton (Gossypium) genomes. Plant Physiol. 2007;145:1303–1310. doi: 10.1104/pp.107.107672. - DOI - PMC - PubMed
-
- Sun Z, Wang X, Liu Z, Gu Q, Zhang Y, Li Z, Ke H , Yang J, Wu Ji, Wu L , Zhang G, Zhang C, Ma Z. A genome wide association study uncovers novel genomic regions and candidate genes of yield related traits in upland cotton. Theor Appl Genet. 2018;131(11):2413–2425. doi: 10.1007/s00122-018-3162-y. - DOI - PubMed
MeSH terms
Substances
LinkOut - more resources
Full Text Sources
Miscellaneous
