. 2023 Apr 5;9(14):eade4110.
doi: 10.1126/sciadv.ade4110. Epub 2023 Apr 5.

An IL-6/STAT3/MR/FGF21 axis mediates heart-liver cross-talk after myocardial infarction

Affiliations

An IL-6/STAT3/MR/FGF21 axis mediates heart-liver cross-talk after myocardial infarction

Jian-Yong Sun et al. Sci Adv. .

Abstract

The liver plays a protective role in myocardial infarction (MI). However, very little is known about the mechanisms. Here, we identify mineralocorticoid receptor (MR) as a pivotal nexus that conveys communications between the liver and the heart during MI. Hepatocyte MR deficiency and MR antagonist spironolactone both improve cardiac repair after MI through regulation on hepatic fibroblast growth factor 21 (FGF21), illustrating an MR/FGF21 axis that underlies the liver-to-heart protection against MI. In addition, an upstreaming acute interleukin-6 (IL-6)/signal transducer and activator of transcription 3 (STAT3) pathway transmits the heart-to-liver signal to suppress MR expression after MI. Hepatocyte Il6 receptor deficiency and Stat3 deficiency both aggravate cardiac injury through their regulation on the MR/FGF21 axis. Therefore, we have unveiled an IL-6/STAT3/MR/FGF21 signaling axis that mediates heart-liver cross-talk during MI. Targeting the signaling axis and the cross-talk could provide new strategies to treat MI and heart failure.


Figures

Fig. 1.
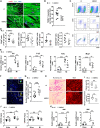
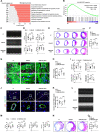
Fig. 1.. Deficiency of hepatocyte MR improves cardiac function and decreases scar size after acute or subacute MI in mice.
(A) Schematic illustration of the experimental approach to identify significantly altered nuclear receptors in the liver responding to MI. The Venn diagram showed differentially expressed transcription factors and nuclear receptors in livers 1 day after MI versus sham operation. FC, fold change; Nr1d1 and Nr1d2, nuclear receptor subfamily 1 group D members 1 and 2, respectively (also known as REV-ERBα and REV-ERBβ); Nr3c2, nuclear receptor subfamily 3 group C member 2 (also known as MR). n = 3. (B) qRT-PCR analysis of MR (or Nr3c2) gene expression in different mouse tissues 1 day after MI. n = 6. (C) Representative images of echocardiography in littermate control (LC) and hepatocyte MR knockout (HMRKO) mice 1 week after MI or sham operation. (D) Quantifications of ejection fraction (EF), fraction shortening (FS), left ventricular end-systolic dimension (Ds), and left ventricular end-diastolic dimension (Dd) based on echocardiography. Sham, n = 8; MI, n = 12. (E) Representative Masson’s trichrome staining of mouse cardiac sections 1 week after MI or sham operation. Scar tissues stained blue. Scale bar, 1 mm. (F) Quantification of scar size in hearts exemplified in (E). n = 12. DAPI, 4′,6-diamidino-2-phenylindole. (G) Representative images of echocardiography in mice 8 weeks after MI or sham operation. (H) Quantifications of EF, FS, Ds, and Dd based on echocardiography. Sham, n = 8; MI, n = 11. (I) Representative Masson’s trichrome staining of mouse cardiac sections 8 weeks after MI or sham operation. Scale bar, 1 mm. (J) Quantification of scar size in hearts exemplified in (I). n = 12. Data are represented as means ± SEM. ns, not significant. *P < 0.05, **P < 0.01, ***P < 0.001, and ****P < 0.0001.
Fig. 2.
Fig. 2.. Deficiency of hepatocyte MR inhibits adverse cardiac remodeling after MI in mice.
(A) Representative TUNEL staining and cardiac troponin T (cTnT) immunofluorescence staining in cardiac sections from LC and HMRKO mice 3 days after MI. (B) Quantification of TUNEL-positive myocytes. n = 8. (C) Representative flow cytometry analysis of CD45+ cells, CD64+Ly6G macrophages, Ly6G+CD64 granulocytes, and CD45+CD3+ lymphocytes in mouse heart samples 3 days after MI. SSC-A, side scatter area. (D) Quantification of flow cytometry results. n = 10. (E) qRT-PCR analysis of proinflammatory cytokines in mouse heart samples 3 days after MI or sham operation. Sham, n = 5; MI, n = 8. (F) Representative immunofluorescence staining of alpha-smooth muscle actin (α-SMA) and CD31 in the peri-infarct regions of mouse heart samples 7 days after MI. (G) Quantification of α-SMA and CD31 dual-positive vessels in peri-infarct regions. n = 8. (H) Representative Picrosirius red staining (left) and wheat germ agglutinin (WGA) staining (right) in the noninfarct regions of mouse heart samples 8 weeks after MI. (I) Quantitative analyses of fibrotic area (red areas in Picrosirius red staining) and cardiomyocyte size (WGA staining). n = 8 to 10. (J) Heart weight–to–body weight ratio (HW/BW) and lung weight–to–body weight ratio (LW/BW) of mice 8 weeks after MI or sham operation. n = 8. (K) qRT-PCR analysis of ANP (atrial natriuretic peptide) and BNP (brain natriuretic peptide) gene expression in mouse heart samples 8 weeks after MI or sham operation. n = 8. Scale bars, 100 μm. Data are represented as means ± SEM. *P < 0.05, **P < 0.01, ***P < 0.001, and ****P < 0.0001.
Fig. 3.
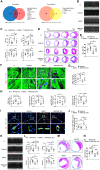
Fig. 3.. FGF21 mediates the protection of hepatocyte MR deficiency on MI.
(A) Venn diagram presenting the overlap of up-regulated or down-regulated genes between HMRKO + MI versus LC + MI and LC + MI versus LC + sham in mouse livers 1 day after MI. Gene expression was measured by RNA-seq. Up-regulated genes with log2fold change > 2 and down-regulated genes with log2fold change < −2 are shown. n = 3. (B) Representative images of echocardiography in mice 1 week after MI. HMR/HFgf21 DKO indicates hepatocyte MR and Fgf21 double knockout. (C) Quantifications of EF, FS, Ds, and Dd based on echocardiography. n = 10. (D) Representative Masson’s trichrome staining of mouse cardiac sections 1 week after MI. Scale bar, 1 mm. (E) Quantification of scar size in hearts exemplified in (D). n = 10. (F) Representative TUNEL staining and cTnT immunofluorescence staining in mouse cardiac sections 3 days after MI. Scale bar, 100 μm. (G) Quantification of TUNEL-positive myocytes. n = 10. (H) Quantifications of flow cytometry analysis of CD45+ cells, CD64+Ly6G macrophages, Ly6G+CD64 granulocytes, and CD45+CD3+ lymphocytes in mouse heart samples 3 days after MI. n = 10. (I) Representative immunofluorescence staining of α-SMA and CD31 in peri-infarct regions of mouse heart samples 7 days after MI. White arrows indicate vascularization. Scale bar, 100 μm. (J) Quantification of neovascularization in the peri-infarct regions. n = 8. (K) Representative images of echocardiography in mice 8 weeks after MI. (L) Quantification of EF, FS, Ds, and Dd based on echocardiography. n = 10. (M) Representative Masson’s trichrome staining of mouse cardiac sections 8 weeks after MI. Scale bar, 5 mm. (N) Quantification of scar size in hearts exemplified in (M). n = 10. Data are represented as means ± SEM. *P < 0.05, **P < 0.01, and ***P < 0.001.
Fig. 4.
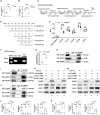
Fig. 4.. An MR-NCOR1-HDAC3 complex regulates Fgf21 expression in hepatocytes.
(A) qRT-PCR analysis of Fgf21 gene expression in primary hepatocytes from LC and HMRKO mice. (B) qRT-PCR analysis of Fgf21 gene expression in primary hepatocytes infected with control adenovirus (AdV-Ctrl) or flagMR adenovirus (AdV-flagMR) for 48 hours. Multiple of infection = 5. (C) Schematic illustration of putative MR binding regions on the promoter of mouse Fgf21. TSS, transcription start site. (D) Schematic illustration of luciferase reporter constructs containing mouse Fgf21 promoters (Fgf21-luc) with different length. (E) Luciferase reporter assays using HEK293FT cells cotransfected with flagMR plasmid or empty vector (Ctrl) and Fgf21-luc with different length or control plasmid pGL3-basic. RLU, relative luciferase unit. (F and G) ChIP analyses showing enrichment of MR on the promoter of Fgf21 in hepatocytes by regular PCR and gel electrophoresis (F) or qRT-PCR (G). Primers specific to R1 were used for PCR. IgG, immunoglobulin G. (H to J) Co-immunoprecipitation (IP) analyses of MR, NCOR1, and HDAC3 in primary hepatocytes infected with AdV-flagMR. (K) Western blotting (WB) analysis of MR, NCOR1, and FGF21 protein expression in primary hepatocytes infected with AdV-Ctrl or AdV-flagMR for 24 hours and then transfected with control small interfering RNA (siRNA) or NCOR1 siRNA for 48 hours. GAPDH, glyceraldehyde-3-phosphate dehydrogenase. (L) Quantification of Western blotting results exemplified in (K). (M) Western blotting analysis of MR, HDAC3, and FGF21 protein expression in primary hepatocytes infected with AdV-Ctrl or AdV-flagMR for 24 hours and then transfected with control siRNA or HDAC3 siRNA for 48 hours. (N) Quantification of Western blotting results exemplified in (M). Data represent three independent experiments. Data are represented as means ± SEM. *P < 0.05, **P < 0.01, ***P < 0.001, and ****P < 0.0001.
Fig. 5.
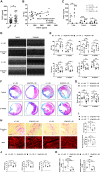
Fig. 5.. Spironolactone ameliorates adverse cardiac remodeling through hepatic FGF21.
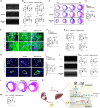
(A) Plasma levels of FGF21 tested by ELISA in patients with HP treated without or with spironolactone (Spl). n = 30. (B) Correlation between plasma FGF21 and EF in patients with HP treated with Spl. Pearson correlation test was used. n = 30. (C) Plasma levels of FGF21 tested by ELISA in mice at different time points after MI. ND, normal diet; SD, spironolactone diet. n = 5 to 7. (D) Representative images of echocardiography in mice 1 or 8 weeks after MI. (E) Quantifications of EF, FS, Ds, and Dd based on echocardiography. n = 7 to 9. (F) Representative Masson’s trichrome staining of mouse cardiac sections 1 or 8 weeks after MI. Scale bar, 5 mm. (G) Quantification of scar size in hearts exemplified in (F). n = 10. (H) Representative Picrosirius red staining and WGA staining in noninfarct regions of mouse heart samples 8 weeks after MI. Scale bar, 100 μm. (I) Quantitative analyses of fibrotic area and cardiomyocyte size. n = 7. (J) HW/BW, HW/TL, and LW/BW of mice 8 weeks after MI. n = 8. (K) qRT-PCR analysis of ANP and BNP gene expression in mouse heart samples 8 weeks after MI. n = 7. Data are represented as means ± SEM. *P < 0.05, **P < 0.01, ***P < 0.001, and ****P < 0.0001.
Fig. 6.
Fig. 6.. Hepatic Il6r suppresses MR expression and exerts cardioprotection after MI in mice.
(A) Enriched biological processes based on RNA-seq results in livers 12 hours after MI versus sham operation. n = 3. (B) Enrichment of IL-6/JAK/STAT3 signaling genes based on RNA-seq results in livers 12 hours after MI versus sham operation. n = 3. FDR, false discovery rate; NES, normalized enrichment score. (C) Representative images of echocardiography in mice 1 week after MI. HMR/HIl6r DKO indicates hepatocyte MR and Il6 receptor double knockout. (D) Quantifications of EF, FS, Ds, and Dd based on echocardiography. n = 10. (E) Representative Masson’s trichrome staining of mouse cardiac sections 1 week after MI. Scale bar, 1 mm. (F) Quantification of scar size in hearts exemplified in (E). n = 10. (G) Representative TUNEL staining and cTnT immunofluorescence staining in mouse cardiac sections 3 days after MI. Scale bar, 200 μm. (H) Quantification of TUNEL-positive myocytes. n = 8. (I) Quantifications of flow cytometry analysis of CD45+ cells, CD64+Ly6G macrophages, Ly6G+CD64 granulocytes, and CD45+CD3+ lymphocytes in mouse heart samples 3 days after MI. n = 10. (J) Representative immunofluorescence staining of α-SMA and CD31 in peri-infarct regions of mouse heart samples 7 days after MI. White arrows indicate vascularization. Scale bar, 100 μm. (K) Quantification of neovascularization in peri-infarct regions. n = 8. (L) Representative images of echocardiography in mice 8 weeks after MI. (M) Quantification of EF, FS, Ds, and Dd based on echocardiography. n = 10. (N) Representative Masson’s trichrome staining of mouse cardiac sections 8 weeks after MI. Scale bar, 1 mm. (O) Quantification of scar size in hearts exemplified in (N). n = 10. Data are represented as means ± SEM. *P < 0.05, **P < 0.01, and ***P<0.001.
Fig. 7.
Fig. 7.. STAT3 signaling in hepatocytes suppresses MR expression and improves cardioprotection after MI in mice.
(A) Representative images of echocardiography in mice 1 week after MI. HMR/HStat3 DKO indicates hepatocyte MR and Stat3 double knockout. (B) Quantifications of EF, FS, Ds, and Dd based on echocardiography. n = 10. (C) Representative Masson’s trichrome staining of mouse cardiac sections 1 week after MI. Scale bar, 1 mm. (D) Quantification of scar size in hearts exemplified in (C). n = 10. (E) Representative TUNEL staining and cTnT immunofluorescence staining in mouse cardiac sections 3 days after MI. Scale bar, 200 μm. (F) Quantification of TUNEL-positive myocytes. n = 9. (G) Quantifications of flow cytometry analysis of CD45+ cells, CD64+Ly6G macrophages, Ly6G+CD64 granulocytes, and CD45+CD3+ lymphocytes in mouse heart samples 3 days after MI. n = 8. (H) Representative immunofluorescence staining of α-SMA and CD31 in peri-infarct regions of mouse heart samples 7 days after MI. White arrows indicate vascularization. Scale bar, 100 μm. (I) Quantification of neovascularization in peri-infarct regions. n = 8. (J) Representative images of echocardiography in mice 8 weeks after MI. (K) Quantification of EF, FS, Ds, and Dd based on echocardiography. n = 8. (L) Representative Masson’s trichrome staining of mouse cardiac sections 8 weeks after MI. Scale bar, 1 mm. (M) Quantification of scar size in hearts exemplified in (L). n = 8. (N) Working model. Data are represented as means ± SEM. *P < 0.05 and **P < 0.01.

Similar articles

Cited by

References

    1. Oishi Y., Manabe I., Organ system crosstalk in cardiometabolic disease in the age of multimorbidity. Front Cardiovasc. Med. 7, 64 (2020). - PMC - PubMed
    1. Karsenty G., Olson E. N., Bone and muscle endocrine functions: Unexpected paradigms of inter-organ communication. Cell 164, 1248–1256 (2016). - PMC - PubMed
    1. Bernardo B. C., Ooi J. Y. Y., Weeks K. L., Patterson N. L., McMullen J. R., Understanding key mechanisms of exercise-induced cardiac protection to mitigate disease: Current knowledge and emerging concepts. Physiol. Rev. 98, 419–475 (2018). - PubMed
    1. Khanlou H., Souto H., Lippmann M., Muñoz S., Rothstein K., Ozden Z., Resolution of adult respiratory distress syndrome after recovery from fulminant hepatic failure. Am. J. Med. Sci. 317, 134–136 (1999). - PubMed
    1. Ali M., Wall W. J., Resolution of the adult respiratory distress syndrome following colectomy and liver transplantation. Chest 98, 1032–1034 (1990). - PubMed

MeSH terms