. 2023 Jun;12(14):e2300671.
doi: 10.1002/adhm.202300671. Epub 2023 Apr 20.

Development of a Synthetic, Injectable Hydrogel to Capture Residual Glioblastoma and Glioblastoma Stem-Like Cells with CXCL12-Mediated Chemotaxis

Affiliations

Development of a Synthetic, Injectable Hydrogel to Capture Residual Glioblastoma and Glioblastoma Stem-Like Cells with CXCL12-Mediated Chemotaxis

Zerin Mahzabin Khan et al. Adv Healthc Mater. 2023 Jun.

Abstract

Glioblastoma (GBM), characterized by high infiltrative capacity, is the most common and deadly type of primary brain tumor in adults. GBM cells, including therapy-resistant glioblastoma stem-like cells (GSCs), invade the healthy brain parenchyma to form secondary tumors even after patients undergo surgical resection and chemoradiotherapy. New techniques are therefore urgently needed to eradicate these residual tumor cells. A thiol-Michael addition injectable hydrogel for compatibility with GBM therapy is previously characterized and optimized. This study aims to develop the hydrogel further to capture GBM/GSCs through CXCL12-mediated chemotaxis. The release kinetics of hydrogel payloads are investigated, migration and invasion assays in response to chemoattractants are performed, and the GBM-hydrogel interactions in vitro are studied. With a novel dual-layer hydrogel platform, it is demonstrated that CXCL12 released from the synthetic hydrogel can induce the migration of U251 GBM cells and GSCs from the extracellular matrix microenvironment and promote invasion into the synthetic hydrogel via amoeboid migration. The survival of GBM cells entrapped deep into the synthetic hydrogel is limited, while live cells near the surface reinforce the hydrogel through fibronectin deposition. This synthetic hydrogel, therefore, demonstrates a promising method to attract and capture migratory GBM cells and GSCs responsive to CXCL12 chemotaxis.

Keywords: CXCL12 chemotaxis; cell migration; collagen-hyaluronic acid hydrogel; controlled delivery; glioblastoma cells; glioblastoma stem-like cells; thiol-Michael addition hydrogel.


Conflict of interest statement

Z.M.K., S.S.V., T.E.L., and E.V. are inventors on a pending patent related to this work. The authors declare no other financial or commercial conflicts of interest.

Figures

Figure 1
Figure 1
Schematic overview and clinical application of proposed CXCL12‐mediated chemotaxis of residual GBM cells. After resection of the primary tumor mass, an injectable hydrogel loaded with CXCL12 chemokines can be dispensed for crosslinking in the resection cavity in situ. Sustained release of the chemokines can generate a chemotactic gradient and induce the migration of residual GBM cells near the resection cavity for their subsequent invasion into the injectable hydrogel. Upon localization, the malignant cells can be eradicated with a non‐invasive ablation technique such as focused ultrasound. Created with BioRender.com.
Figure 2
Figure 2
Release kinetics of 10 kDa FITC‐dextran payload from synthetic hydrogels submerged in 1× phosphate buffered saline solution (PBS) at 37 °C for initial loading concentrations of 0.5, 5, and 10 µg mL−1. a) Comparison of cumulative release over time for different hydrogel payload concentrations and predicted cumulative release profile from the computational model based on Fickian diffusion and hydrogel degradation. b) Total amount of FITC‐dextran released over time from hydrogels for each loading concentration. All data are expressed as mean ± SD (n = 4). Blue dashed lines correspond to thresholds of 0.01 and 0.16 µg.
Figure 3
Figure 3
CXCL12 release from synthetic hydrogels submerged in 1× PBS at 37 °C for loading concentration of 5 µg mL−1. a) Cumulative release (ng) of CXCL12 over 72 h. b) Amount of CXCL12 (ng) released for each time point from hydrogels. All data are expressed as mean ± SD (n = 4) by one way analysis of variance (ANOVA) and Tukey's post‐hoc analysis. **p < 0.01.
Figure 4
Figure 4
Glioblastoma and glioblastoma stem‐like cell migration in response to chemoattraction in vitro. a) Schematic overview of Transwell setup for migration assay. Created with BioRender.com. 20 000 U251 GBM, U251 GSC, G34, or G528 cells were loaded on the top chamber. The number of cells that migrated through the Transwell insert (8 µm pore) to the underside in response to the chemoattractant on the bottom chamber was quantified. Chemoattractant groups on the bottom chamber were either the migration media (control) comprising Dulbecco's Modified Eagle Medium (DMEM) supplemented with 0.1% bovine serum albumin for U251 cells or complete Neurobasal media without growth factors for G34/G528 cells, empty synthetic hydrogels in migration media (hydrogel), synthetic hydrogels loaded with 5 µg mL−1 of CXCL12 in migration media (hydrogel‐CXCL12), or 0.2 µg mL−1 of CXCL12 in migration media (CXCL12 solution). Transwell assays with the U251 cells had an additional chemoattraction condition comprising synthetic hydrogels loaded with 3 × 106 U251 GBM cells in migration media (hydrogel‐U251). The number of cells quantified was averaged from ten random fields of view per sample at 10× with a confocal microscope. Migration index reported as ratio of number of migrated cells from the sample to the number of migrated cells from the control group. Migration index of b) U251 GBM cells at 24 or 48 h time point, c) U251 GSCs at 24 or 48 h time point, and d) G34 and G528 GSCs at 24 h time point. Data shown are mean ± SD (n = 3), *p < 0.05, **p < 0.01, ***p < 0.001, ****p < 0.0001 by Student's t‐test against the corresponding control group.
Figure 5
Figure 5
Glioblastoma and glioblastoma stem‐like cell invasion in response to CXCL12‐mediated chemotaxis in vitro. a) Schematic overview of dual layer hydrogel invasion assay setup. Created with BioRender.com. Either empty or 5 µg mL−1 CXCL12‐loaded synthetic hydrogels were synthesized in PDMS molds as the bottom layer. On the top layer, collagen‐HA hydrogels were synthesized encapsulating either U251 GBM or GSCs at 1 × 106 cells/mL. After 24 h of cell culture, reflectance confocal z‐stack imaging at 640 nm was used to demarcate the two hydrogel layers. Blue is DAPI and green is actin filament staining. b) Quantification of GSCs or GBM cells that invaded at least 20 µm (1 cell diameter) deep in synthetic hydrogel due to CXCL12. Data shown are mean ± SD (n = 3) by Student's t‐test. No background invasion for empty synthetic hydrogels was observed. Reflectance and confocal z‐stack images of U251 cell invasion after 24 h in dual‐layer hydrogel for c) GBM cells and empty synthetic hydrogel, d) GBM cells and CXCL12‐loaded synthetic hydrogel, e) GSCs and empty synthetic hydrogel, and f) GSCs and CXCL12‐loaded synthetic hydrogel on the bottom layer. Scale bars represent 200 µm.
Figure 6
Figure 6
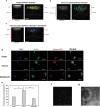
Mechanism of U251 GBM invasion into synthetic hydrogel from collagen‐HA hydrogel layer. Either empty or 5 µg mL−1 CXCL12‐loaded synthetic hydrogels were synthesized in PDMS molds as the bottom layer. On the top layer, collagen‐HA hydrogels were synthesized encapsulating U251 GBM cells at 1 × 106 cells/mL. After 14 h, reflectance confocal z‐stack imaging at 640 nm was used to demarcate the two hydrogel layers. Blue is DAPI, green is actin filament staining, and red is myosin IIA. Cell invasion in response to a) empty synthetic hydrogels, b) CXCL12‐loaded synthetic hydrogels, and c) CXCL12‐loaded synthetic hydrogels subjected to 30 µm of (‐)‐blebbistatin incubation. Scale bars represent 200 µm. d) Representative 1.61 µm optical slice images of the cells in the collagen‐HA layer for each corresponding sample group. Scale bars represent 50 µm. e) Quantification of normalized myosin IIA fluorescence intensities based on three cells from five representative images in the collagen‐HA layer with a confocal microscope at 20×. Data shown are mean ± SD (n = 3) by one way ANOVA and Tukey's post‐hoc analysis. No background invasion for empty synthetic hydrogels or blebbistatin‐treated samples was observed. *p‐value < 0.05, **p‐value < 0.01. f) Representative second harmonic generation image of U251 GBM‐encapsulated collagen‐HA hydrogel after 24 h of culture. Scale bar is 50 µm. g) Representative reflectance (543 nm) image of synthetic hydrogel swelled for 24 h in PBS at 37 °C. Scale bar is 50 µm.
Figure 7
Figure 7
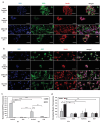
Immunofluorescence analysis of stem cell and glial markers during U251 GBM and GSC interaction with synthetic hydrogel and collagen‐HA hydrogel surfaces. 100 000 U251 GBM cells or GSCs were seeded on the surface of either synthetic hydrogels or collagen‐HA ECM hydrogels. 1.61 µm thick representative optical slice images of the cells focused on the hydrogel surface for a) 24 h time point and b) 48 h time point. Quantification of normalized c) GFAP fluorescence and d) nestin fluorescence. Ten fields of view were randomly selected and three cells were analyzed per field of view. Data shown are mean ± SD (n = 3) by one way ANOVA and Tukey's post‐hoc analysis. *p < 0.05, **p < 0.01, ***p < 0.001,****p < 0.0001. Scale bar is 50 µm.
Figure 8
Figure 8
Viability of GBM cells encapsulated in synthetic or collagen‐HA hydrogels. U251 GBM cells were encapsulated in synthetic or collagen‐HA ECM hydrogels at a density of 1 × 106 cells/mL and cultured for up to 120 h in complete DMEM media. a) Representative images of cells encapsulated in both hydrogels subjected to live/dead staining at 24, 72, and 120 h time points. Red stain is propidium iodide (dead cells) and green stain is calcein AM (live cells). Scale bar is 200 µm. Images acquired up to 300 µm deep in each hydrogel. b) Representative z‐stack images of live/dead stained U251 GBM cells encapsulated either in the synthetic hydrogel or collagen‐HA hydrogel during the 120 h time point. Scale bar is 200 µm. c) Viability of U251 GBM cells encapsulated either in collagen‐HA hydrogel or synthetic hydrogel over time. Cell viability is based on the percentage of live cells over total number of cells. Ten fields of view were randomly selected per hydrogel sample to quantify the number of live and dead cells per hydrogel. Acquired images were limited to 300 µm deep in each hydrogel for analysis. All data are averages ± SD (n = 3), ****p‐value < 0.0001 by one way ANOVA and Tukey's post‐hoc analysis. No significant difference in cell viability within ECM hydrogels or synthetic hydrogels over time.
Figure 9
Figure 9
Hydrogel degradation and fibronectin deposition by encapsulated U251 GBM cells. a) Total degradation of either empty synthetic hydrogels (acellular) or synthetic hydrogels encapsulated with 3 × 106 cells/mL of U251 GBM cells (cellular) over time. All data shown are mean ± SD (n = 3) by one way ANOVA and Tukey's post‐hoc analysis. b) Representative images comparing the complete degradation of acellular hydrogels from 0 to 120 h against intact cellular hydrogels from 0 to 120 h during the degradation study. c) Representative 1.61 µm optical slice images of U251 GBM cells encapsulated in synthetic or collagen‐HA ECM hydrogels depositing fibronectin. Cells were encapsulated at a density of 1 × 106 cells/mL and cultured in complete DMEM media for 72 h. Blue is DAPI and green is fibronectin. Scale bar is 20 µm. d) Quantification of normalized fibronectin deposition for U251 GBM cells encapsulated in collagen‐HA ECM hydrogels or synthetic hydrogels. All data shown are mean ± SD (n = 3) by one way ANOVA and Tukey's post‐hoc analysis. Five fields of view were randomly selected per hydrogel and three cells were analyzed per field of view at 20×. Acquired images were limited to 300 µm deep in each hydrogel.

Similar articles

Cited by

References

    1. Ostrom Q. T., Cioffi G., Waite K., Kruchko C., Barnholtz‐Sloan J. S., Neuro. Oncol. 2021, 23, iii1. - PMC - PubMed
    1. Stupp R., Brada M., van den Bent M. J., Tonn J. C., Pentheroudakis G., Ann. Oncol. 2014, 25, iii93. - PubMed
    1. Ostrom Q. T., Cote D. J., Ascha M., Kruchko C., Barnholtz‐Sloan J. S., JAMA Oncol. 2018, 4, 1254. - PMC - PubMed
    1. Hatoum A., Mohammed R., Zakieh O., Cancer Manag. Res. 2019, 11, 1843. - PMC - PubMed
    1. Lara‐Velazquez M., Al‐Kharboosh R., Jeanneret S., Vazquez‐Ramos C., Mahato D., Tavanaiepour D., Rahmathulla G., Quinones‐Hinojosa A., Brain Sci. 2017, 7, 166. - PMC - PubMed

Publication types