Excessive self-grooming, gene dysregulation and imbalance between the striosome and matrix compartments in the striatum of Shank3 mutant mice
- PMID: 37008785
- PMCID: PMC10061084
- DOI: 10.3389/fnmol.2023.1139118
Excessive self-grooming, gene dysregulation and imbalance between the striosome and matrix compartments in the striatum of Shank3 mutant mice
Abstract
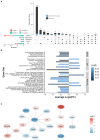
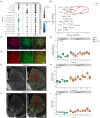
Autism is characterized by atypical social communication and stereotyped behaviors. Mutations in the gene encoding the synaptic scaffolding protein SHANK3 are detected in 1-2% of patients with autism and intellectual disability, but the mechanisms underpinning the symptoms remain largely unknown. Here, we characterized the behavior of Shank3 Δ11/Δ11 mice from 3 to 12 months of age. We observed decreased locomotor activity, increased stereotyped self-grooming and modification of socio-sexual interaction compared to wild-type littermates. We then used RNAseq on four brain regions of the same animals to identify differentially expressed genes (DEGs). DEGs were identified mainly in the striatum and were associated with synaptic transmission (e.g., Grm2, Dlgap1), G-protein-signaling pathways (e.g., Gnal, Prkcg1, and Camk2g), as well as excitation/inhibition balance (e.g., Gad2). Downregulated and upregulated genes were enriched in the gene clusters of medium-sized spiny neurons expressing the dopamine 1 (D1-MSN) and the dopamine 2 receptor (D2-MSN), respectively. Several DEGs (Cnr1, Gnal, Gad2, and Drd4) were reported as striosome markers. By studying the distribution of the glutamate decarboxylase GAD65, encoded by Gad2, we showed that the striosome compartment of Shank3 Δ11/Δ11 mice was enlarged and displayed much higher expression of GAD65 compared to wild-type mice. Altogether, these results indicate altered gene expression in the striatum of Shank3-deficient mice and strongly suggest, for the first time, that the excessive self-grooming of these mice is related to an imbalance in the striatal striosome and matrix compartments.
Keywords: GAD65; Shank3; autism; matrix; mouse model; stereotyped behavior; striatum compartmentation; striosomes.
Copyright © 2023 Ferhat, Verpy, Biton, Forget, De Chaumont, Mueller, Le Sourd, Coqueran, Schmitt, Rochefort, Rondi-Reig, Leboucher, Boland, Fin, Deleuze, Boekers, Ey and Bourgeron.
Conflict of interest statement
The authors declare that the research was conducted in the absence of any commercial or financial relationships that could be construed as a potential conflict of interest. The reviewer MY declared a shared affiliation with the author ATF to the handling editor at the time of review.
Figures


Similar articles
-
Brain region-specific disruption of Shank3 in mice reveals a dissociation for cortical and striatal circuits in autism-related behaviors.Transl Psychiatry. 2018 Apr 27;8(1):94. doi: 10.1038/s41398-018-0142-6. Transl Psychiatry. 2018. PMID: 29700290 Free PMC article.
-
Striatopallidal dysfunction underlies repetitive behavior in Shank3-deficient model of autism.J Clin Invest. 2017 May 1;127(5):1978-1990. doi: 10.1172/JCI87997. Epub 2017 Apr 17. J Clin Invest. 2017. PMID: 28414301 Free PMC article.
-
The cannabinoid-1 receptor is abundantly expressed in striatal striosomes and striosome-dendron bouquets of the substantia nigra.PLoS One. 2018 Feb 21;13(2):e0191436. doi: 10.1371/journal.pone.0191436. eCollection 2018. PLoS One. 2018. PMID: 29466446 Free PMC article.
-
The Striosome and Matrix Compartments of the Striatum: A Path through the Labyrinth from Neurochemistry toward Function.ACS Chem Neurosci. 2017 Feb 15;8(2):235-242. doi: 10.1021/acschemneuro.6b00333. Epub 2016 Dec 15. ACS Chem Neurosci. 2017. PMID: 27977131 Review.
-
SHANK3 as an autism spectrum disorder-associated gene.Brain Dev. 2013 Feb;35(2):106-10. doi: 10.1016/j.braindev.2012.05.013. Epub 2012 Jun 29. Brain Dev. 2013. PMID: 22749736 Review.
Cited by
-
The cortico-striatal circuitry in autism-spectrum disorders: a balancing act.Front Cell Neurosci. 2024 Jan 11;17:1329095. doi: 10.3389/fncel.2023.1329095. eCollection 2023. Front Cell Neurosci. 2024. PMID: 38273975 Free PMC article. Review.
-
Behavioral regression in shank3Δex4-22 mice during early adulthood corresponds to cerebellar granule cell glutamatergic synaptic changes.Res Sq [Preprint]. 2024 Sep 6:rs.3.rs-4888950. doi: 10.21203/rs.3.rs-4888950/v1. Res Sq. 2024. Update in: Mol Autism. 2024 Dec 4;15(1):52. doi: 10.1186/s13229-024-00628-y PMID: 39281868 Free PMC article. Updated. Preprint.
-
Detecting Central Auditory Processing Disorders in Awake Mice.Brain Sci. 2023 Oct 31;13(11):1539. doi: 10.3390/brainsci13111539. Brain Sci. 2023. PMID: 38002499 Free PMC article.
-
Bridging the translational gap: what can synaptopathies tell us about autism?Front Mol Neurosci. 2023 Jun 27;16:1191323. doi: 10.3389/fnmol.2023.1191323. eCollection 2023. Front Mol Neurosci. 2023. PMID: 37441676 Free PMC article. Review.
-
Exploring the multidimensional nature of repetitive and restricted behaviors and interests (RRBI) in autism: neuroanatomical correlates and clinical implications.Mol Autism. 2023 Nov 27;14(1):45. doi: 10.1186/s13229-023-00576-z. Mol Autism. 2023. PMID: 38012709 Free PMC article.
References
LinkOut - more resources
Full Text Sources
Molecular Biology Databases
Research Materials
Miscellaneous

