. 2023 Mar 13:14:1023064.
doi: 10.3389/fimmu.2023.1023064. eCollection 2023.

Chronic CD27-CD70 costimulation promotes type 1-specific polarization of effector Tregs

Affiliations

Chronic CD27-CD70 costimulation promotes type 1-specific polarization of effector Tregs

Natalia Bowakim-Anta et al. Front Immunol. .

Abstract

Introduction: Most T lymphocytes, including regulatory T cells, express the CD27 costimulatory receptor in steady state conditions. There is evidence that CD27 engagement on conventional T lymphocytes favors the development of Th1 and cytotoxic responses in mice and humans, but the impact on the regulatory lineage is unknown.

Methods: In this report, we examined the effect of constitutive CD27 engagement on both regulatory and conventional CD4+ T cells in vivo, in the absence of intentional antigenic stimulation.

Results: Our data show that both T cell subsets polarize into type 1 Tconvs or Tregs, characterized by cell activation, cytokine production, response to IFN-γ and CXCR3-dependent migration to inflammatory sites. Transfer experiments suggest that CD27 engagement triggers Treg activation in a cell autonomous fashion.

Conclusion: We conclude that CD27 may regulate the development of Th1 immunity in peripheral tissues as well as the subsequent switch of the effector response into long-term memory.

Keywords: CD27 costimulation; CXCR3; dendritic cells; eomes; regulatory T cells.


Conflict of interest statement

The authors declare that the research was conducted in the absence of any commercial or financial relationships that could be construed as a potential conflict of interest.

Figures
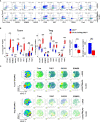
Figure 1
Figure 1
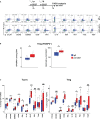
Activation of Tregs and Tconvs in CD70 transgenic mice. Spleen cells from CD27+/- mice expressing or not a CD70tg were harvested at 6-8 wk of age and stained ex vivo for indicated proteins. (A) Spleen cells were stained for CD4, Foxp3 and the indicated markers. Singlets were selected by gating events in the diagonal of FSC-H vs FSC-A plots. Representative flow cytometry plots of indicated marker on gated viable CD4+ cells.(B) Proportion of positive cells among viable CD4+ Tregs and Tconvs (left panels; proportion of Tregs and intensity of Foxp3 expression (right panels). Data are from 3-4 independent experiments with 5-8 mice per group. Bars represent median ± SD. Unpaired t-test was used to determine statistical differences followed by FDR correction for multiple comparisons (*p < 0.05; **p < 0.01; ***p < 0.001; ****p < 0.0001; ns, not significant. (C) Representative merged (n =8) t-distributed stochastic neighbor embedding (t-SNE) plot after dimensionality reduction and unsupervised clustering of flow cytometry data from CD4+ Tregs and Tconvs.
Figure 2
Figure 2
Injection of agonistic anti-CD27 mAb induces some features of Th1-type Tregs. WT mice were injected i.p. with agonistic anti-CD27 mAb (at days 0 and 3) and spleen cells were analyzed ex vivo by flow cytometry at day 6. (A) Spleen cells were stained for CD4, Foxp3 and the indicated markers? Singlets were selected by gating events in the diagonal of FSC-H vs FSC-A plots. Representative flow cytometry plots of indicated marker on gated viable CD4+ cells. (B) Proportion of Tregs and intensity of Foxp3 expression. (C) Proportion of CD4+ Tregs and Tconvs expressing the proliferation marker Ki67, transcription factors (Eomes, T-bet), cytokines (IFN-γ and IL-10) and inhibitory receptors (TIGIT, ICOS, CTLA-4 and PD-1). Data are from 3 independent experiments with 4 mice per group. Bars represent median ± SD. Unpaired t-test was used to determine statistical differences followed by FDR correction for multiple comparisons (*p < 0.05; **p < 0.01; ****p < 0.0001; ns, not significant).
Figure 3
Figure 3
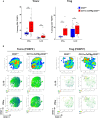
Transgenic expression of CD70 on dendritic cells induces the differentiation of type 1 effectors. (A) Proportion of Tregs (left) and Tconvs (right) expressing IFN-γ or IL-10 after short stimulation in vitro with phorbol myristate acetate (PMA)-ionomycin in the presence of brefeldin A. Data are from 3 independent experiments with 3-8 mice per group. Bars represent median ± SD. Unpaired t-test was used to determine statistical differences followed by FDR correction for multiple comparisons (*p < 0.05; **p < 0.01; ***p < 0.001; ns, not significant). (B) Merged (n = 8) tSNE plot after dimensionality reduction and unsupervised clustering of flow cytometry data from Tconvs and Tregs. The tSNE was built on the 3 markers and both cytokines.
Figure 4
Figure 4
Unchanged suppressive capacity of Tregs in CD11c-Cd70tg;CD27+/- mice. CD4+ Foxp3+ cells were sorted from CD27+/- or CD11c-Cd70tg;CD27+/- mice and co-cultured with CFSE-labeled, naive conventional CD4+ T cells from CD45.1 mice in the presence of soluble anti-CD3 mAb and irradiated splenocytes. After 3 days, flow cytometry profiles of CFSE were analyzed. Percent of suppression of proliferation as compared to cultures in which Treg cells were omitted. Data are representative of 4 independent experiments with n = 5 per group. Values are presented as the median ± SD and were compared by two-tailed unpaired student’s t-test. ns, not significant.
Figure 5
Figure 5
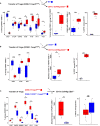
Cell autonomous activation/differentiation of Tregs upon CD27 engagement. (A, B) 5 x 10⁵ Tregs purified from Foxp3eGFP CD90.1 mice were injected i.v. into CD11c-Cd70tg;CD27-/- recipients and either WT (A) or CD27-/- (B) as control recipients. (C) Tregs were purified from Foxp3eGFP CD90.1 mice either CD27 competent or deficient (CD27-/-) and 5 x 10⁵ cells were injected i.v. into CD11c-Cd70tg;CD27-/- recipients. Spleen cells were analyzed ex vivo by flow cytometry 7 days after injection. Data show the proportion of transferred Tregs (Foxp3+ CD90.1+) expressing the proliferation marker Ki67, transcription factors (eomes, T-bet), chemokine receptor CXCR3 and inhibitory receptors (ICOS, CTLA-4 and PD-1) as well as the absolute number of CD90.1+ Tregs recovered. Controls include CD27 and CD70 staining. Data are representative of 3 independent experiments with 4 mice per group. Bars represent median ± SD. Unpaired t-test was used to determine statistical differences followed by FDR correction for multiple comparisons (*p < 0.05; **p < 0.01; ***p < 0.001; ****p < 0.0001; ns, not significant).
Figure 6
Figure 6
Common transcriptional signature of CD27 engagement in Tregs versus Tconvs. (A) Left panel: principal component analysis (PCA), a dimensionality reduction method, show the separation among Tregs and Tconvs due to CD70Tg. Variance in PC1 and PC2 is shown. (B) Left panel: differentially expressed genes of Tconvs and Tregs are clustered based on occurrence. Clusters 1 and 3 are upregulated specifically in Treg F1 CD70Tg and Tconv F1 CD70Tg, respectively, whereas clusters 4 and 6 consist of genes downregulated specifically in Treg F1 CD70Tg and Tconv F1 CD70Tg, respectively. Shared up/down regulated genes are found in cluster 2 and 5. Values are represented as Log2 fold-change obtained from median CPM of each gene. Selected genes for each cluster are displayed in the right margin. The number of genes in each cluster is shown in the left margin. Right panel, selected pathways enriched in clusters 1, 2, and 3 using clusterProfiler R package with default parameters and presented as −Log10 of p-value. (C) GSEA performed on F1 CD70Tg data set and Tconv F1 CD70Tg differentially expressed genes as gene sets. Normalized enrichment score (NES) and false discovery rate (FDR) are indicated. F1 mice: CD27+/-; F1 CD70Tg mice: CD11c-Cd70tg;CD27+/-.
Figure 7
Figure 7
Common enriched pathways in Tregs from CD11c-Cd70tg;CD27+/-, EomesTg and CXCR3+ Tregs. (A, B) GSEA performed on F1 CD70Tg data set and Treg EomesTg (A) or Treg Cxcr3+ (B) differentially expressed genes as gene sets. Normalized enrichment score (NES) and false discovery rate (FDR) are indicated. (C) Bubble plot for selected pathways (database MsigDB; https://www.gsea-msigdb.org/gsea/msigdb/) enriched from genes upregulated in Treg F1 CD70Tg, Treg Cxcr3+ and Treg EomesTg using clusterProfiler R package with default parameters and presented as −Log10 of p-value. Color intensity indicates p-value and bubble size indicates number of enriched genes.

Similar articles

Cited by

References

    1. Chang YH, Wang KC, Chu KL, Clouthier DL, Tran AT, Torres Perez MS, et al. . Dichotomous expression of TNF superfamily ligands on antigen-presenting cells controls post-priming anti-viral CD4+ T cell immunity. Immunity (2017) 47(5):943–958.e9. doi: 10.1016/j.immuni.2017.10.014 - DOI - PubMed
    1. Hintzen RQ, Lens SM, Lammers K, Kuiper H, Beckmann MP, van Lier RA. Engagement of CD27 with its ligand CD70 provides a second signal for T cell activation. J Immunol (1995) 154(6):2612–23. doi: 10.4049/jimmunol.154.6.2612 - DOI - PubMed
    1. Hendriks J, Xiao Y, Borst J. CD27 promotes survival of activated T cells and complements CD28 in generation and establishment of the effector T cell pool. J Exp Med (2003) 198(9):1369–80. doi: 10.1084/jem.20030916 - DOI - PMC - PubMed
    1. Yamada A, Salama AD, Sho M, Najafian N, Ito T, Forman JP, et al. . CD70 signaling is critical for CD28-independent CD8 + T cell-mediated alloimmune responses In vivo . J Immunol (2005) 174(3):1357–64. doi: 10.4049/jimmunol.174.3.1357 - DOI - PubMed
    1. Tesselaar K, Gravestein LA, Van Schijndel GMW, Borst J, Van Lier RAW. Characterization of murine CD70, the ligand of the TNF receptor family member CD27. J Immunol (1997) 159(10):4959–65. doi: 10.4049/jimmunol.159.10.4959 - DOI - PubMed

Publication types

Grants and funding

The work was supported was the National Fund for Scientific Research (FNRS), the European Regional Development Fund (ERDFWallonia BioMed 2014-2020-LIV 45-20), Wallonia (Programme d’Excellence Food4GUT) and grants from the Fonds Jean Brachet and the Fonds Hoguet.