SIV Infection Regulates Compartmentalization of Circulating Blood Plasma miRNAs within Extracellular Vesicles (EVs) and Extracellular Condensates (ECs) and Decreases EV-Associated miRNA-128
- PMID: 36992331
- PMCID: PMC10059597
- DOI: 10.3390/v15030622
SIV Infection Regulates Compartmentalization of Circulating Blood Plasma miRNAs within Extracellular Vesicles (EVs) and Extracellular Condensates (ECs) and Decreases EV-Associated miRNA-128
Abstract
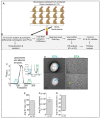
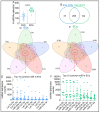
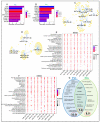
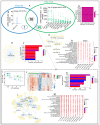
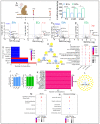
Background: This is Manuscript 1 of a two-part Manuscript of the same series. Here, we present findings from our first set of studies on the abundance and compartmentalization of blood plasma extracellular microRNAs (exmiRNAs) into extracellular particles, including blood plasma extracellular vesicles (EVs) and extracellular condensates (ECs) in the setting of untreated HIV/SIV infection. The goals of the study presented in this Manuscript 1 are to (i) assess the abundance and compartmentalization of exmiRNAs in EVs versus ECs in the healthy uninfected state, and (ii) evaluate how SIV infection may affect exmiRNA abundance and compartmentalization in these particles. Considerable effort has been devoted to studying the epigenetic control of viral infection, particularly in understanding the role of exmiRNAs as key regulators of viral pathogenesis. MicroRNA (miRNAs) are small (~20-22 nts) non-coding RNAs that regulate cellular processes through targeted mRNA degradation and/or repression of protein translation. Originally associated with the cellular microenvironment, circulating miRNAs are now known to be present in various extracellular environments, including blood serum and plasma. While in circulation, miRNAs are protected from degradation by ribonucleases through their association with lipid and protein carriers, such as lipoproteins and other extracellular particles-EVs and ECs. Functionally, miRNAs play important roles in diverse biological processes and diseases (cell proliferation, differentiation, apoptosis, stress responses, inflammation, cardiovascular diseases, cancer, aging, neurological diseases, and HIV/SIV pathogenesis). While lipoproteins and EV-associated exmiRNAs have been characterized and linked to various disease processes, the association of exmiRNAs with ECs is yet to be made. Likewise, the effect of SIV infection on the abundance and compartmentalization of exmiRNAs within extracellular particles is unclear. Literature in the EV field has suggested that most circulating miRNAs may not be associated with EVs. However, a systematic analysis of the carriers of exmiRNAs has not been conducted due to the inefficient separation of EVs from other extracellular particles, including ECs. Methods: Paired EVs and ECs were separated from EDTA blood plasma of SIV-uninfected male Indian rhesus macaques (RMs, n = 15). Additionally, paired EVs and ECs were isolated from EDTA blood plasma of combination anti-retroviral therapy (cART) naïve SIV-infected (SIV+, n = 3) RMs at two time points (1- and 5-months post infection, 1 MPI and 5 MPI). Separation of EVs and ECs was achieved with PPLC, a state-of-the-art, innovative technology equipped with gradient agarose bead sizes and a fast fraction collector that allows high-resolution separation and retrieval of preparative quantities of sub-populations of extracellular particles. Global miRNA profiles of the paired EVs and ECs were determined with RealSeq Biosciences (Santa Cruz, CA) custom sequencing platform by conducting small RNA (sRNA)-seq. The sRNA-seq data were analyzed using various bioinformatic tools. Validation of key exmiRNAs was performed using specific TaqMan microRNA stem-loop RT-qPCR assays. Results: We showed that exmiRNAs in blood plasma are not restricted to any type of extracellular particles but are associated with lipid-based carriers-EVs and non-lipid-based carriers-ECs, with a significant (~30%) proportion of the exmiRNAs being associated with ECs. In the blood plasma of uninfected RMs, a total of 315 miRNAs were associated with EVs, while 410 miRNAs were associated with ECs. A comparison of detectable miRNAs within paired EVs and ECs revealed 19 and 114 common miRNAs, respectively, detected in all 15 RMs. Let-7a-5p, Let-7c-5p, miR-26a-5p, miR-191-5p, and let-7f-5p were among the top 5 detectable miRNAs associated with EVs in that order. In ECs, miR-16-5p, miR-451, miR-191-5p, miR-27a-3p, and miR-27b-3p, in that order, were the top detectable miRNAs in ECs. miRNA-target enrichment analysis of the top 10 detected common EV and EC miRNAs identified MYC and TNPO1 as top target genes, respectively. Functional enrichment analysis of top EV- and EC-associated miRNAs identified common and distinct gene-network signatures associated with various biological and disease processes. Top EV-associated miRNAs were implicated in cytokine-cytokine receptor interactions, Th17 cell differentiation, IL-17 signaling, inflammatory bowel disease, and glioma. On the other hand, top EC-associated miRNAs were implicated in lipid and atherosclerosis, Th1 and Th2 cell differentiation, Th17 cell differentiation, and glioma. Interestingly, infection of RMs with SIV revealed that the brain-enriched miR-128-3p was longitudinally and significantly downregulated in EVs, but not ECs. This SIV-mediated decrease in miR-128-3p counts was validated by specific TaqMan microRNA stem-loop RT-qPCR assay. Remarkably, the observed SIV-mediated decrease in miR-128-3p levels in EVs from RMs agrees with publicly available EV miRNAome data by Kaddour et al., 2021, which showed that miR-128-3p levels were significantly lower in semen-derived EVs from HIV-infected men who used or did not use cocaine compared to HIV-uninfected individuals. These findings confirmed our previously reported finding and suggested that miR-128 may be a target of HIV/SIV. Conclusions: In the present study, we used sRNA sequencing to provide a holistic understanding of the repertoire of circulating exmiRNAs and their association with extracellular particles, such as EVs and ECs. Our data also showed that SIV infection altered the profile of the miRNAome of EVs and revealed that miR-128-3p may be a potential target of HIV/SIV. The significant decrease in miR-128-3p in HIV-infected humans and in SIV-infected RMs may indicate disease progression. Our study has important implications for the development of biomarker approaches for various types of cancer, cardiovascular diseases, organ injury, and HIV based on the capture and analysis of circulating exmiRNAs.
Keywords: SIV; extracellular condensates; extracellular vesicles; miRNA; miRNA-128.
Conflict of interest statement
The authors report no biomedical financial interests or potential conflicts of interest.
Figures

Similar articles
-
Alterations in Abundance and Compartmentalization of miRNAs in Blood Plasma Extracellular Vesicles and Extracellular Condensates during HIV/SIV Infection and Its Modulation by Antiretroviral Therapy (ART) and Delta-9-Tetrahydrocannabinol (Δ9-THC).Viruses. 2023 Feb 24;15(3):623. doi: 10.3390/v15030623. Viruses. 2023. PMID: 36992332 Free PMC article.
-
Small RNA sequencing of extracellular vesicles identifies circulating miRNAs related to inflammation and oxidative stress in HIV patients.BMC Immunol. 2020 Nov 11;21(1):57. doi: 10.1186/s12865-020-00386-5. BMC Immunol. 2020. PMID: 33176710 Free PMC article.
-
Analysis of circulating extracellular vesicle derived microRNAs in breast cancer patients with obesity: a potential role for Let-7a.J Transl Med. 2023 Mar 31;21(1):232. doi: 10.1186/s12967-023-04075-w. J Transl Med. 2023. PMID: 37004031 Free PMC article.
-
Extracellular vesicles and their content in the context of polycystic ovarian syndrome and endometriosis: a review.J Ovarian Res. 2024 Aug 5;17(1):160. doi: 10.1186/s13048-024-01480-7. J Ovarian Res. 2024. PMID: 39103867 Free PMC article. Review.
-
MicroRNAs in extracellular vesicles: A potential role in cancer progression.Cell Signal. 2024 Sep;121:111263. doi: 10.1016/j.cellsig.2024.111263. Epub 2024 Jun 17. Cell Signal. 2024. PMID: 38897529 Review.
Cited by
-
Exosome-Mediated Antigen Delivery: Unveiling Novel Strategies in Viral Infection Control and Vaccine Design.Vaccines (Basel). 2024 Mar 7;12(3):280. doi: 10.3390/vaccines12030280. Vaccines (Basel). 2024. PMID: 38543914 Free PMC article. Review.
-
Serum amyloid A and mitochondrial DNA in extracellular vesicles are novel markers for detecting traumatic brain injury in a mouse model.iScience. 2024 Jan 17;27(2):108932. doi: 10.1016/j.isci.2024.108932. eCollection 2024 Feb 16. iScience. 2024. PMID: 38323004 Free PMC article.
References
Publication types
MeSH terms
Substances
Grants and funding
- R33 DA053643/DA/NIDA NIH HHS/United States
- R01DA050169/NH/NIH HHS/United States
- R01DA052845/NH/NIH HHS/United States
- R01DA042524/NH/NIH HHS/United States
- P51 OD011104/OD/NIH HHS/United States
- R01 DA052845/DA/NIDA NIH HHS/United States
- R01DA042348/NH/NIH HHS/United States
- P30 AI161943/AI/NIAID NIH HHS/United States
- R01 DA050169/DA/NIDA NIH HHS/United States
- P51 OD011133/OD/NIH HHS/United States
- R01 DA042524/DA/NIDA NIH HHS/United States
- R01 DA042348/DA/NIDA NIH HHS/United States
- R21/R33DA053643/NH/NIH HHS/United States
- U42 OD010442/OD/NIH HHS/United States
LinkOut - more resources
Full Text Sources
Medical

