

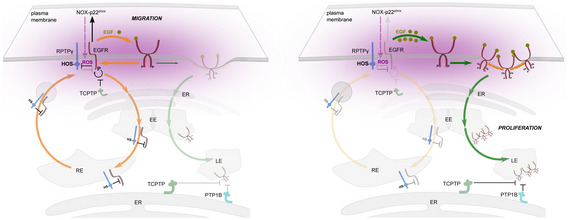
The EGFR phosphatase RPTPγ is a redox-regulated suppressor of promigratory signaling
- PMID: 36988334
- PMCID: PMC10183832
- DOI: 10.15252/embj.2022111806
The EGFR phosphatase RPTPγ is a redox-regulated suppressor of promigratory signaling
Abstract
Spatially organized reaction dynamics between proto-oncogenic epidermal growth factor receptor (EGFR) and protein tyrosine phosphatases determine EGFR phosphorylation dynamics in response to growth factors and thereby cellular behavior within developing tissues. We show that the reaction dynamics of mutual inhibition between RPTPγ phosphatase and autocatalytic ligandless EGFR phosphorylation enable highly sensitive promigratory EGFR signaling responses to subnanomolar EGF levels, when < 5% receptors are occupied by EGF. EGF thereby triggers an autocatalytic phospho-EGFR reaction by the initial production of small amounts of phospho-EGFR through transient, asymmetric EGF-EGFR2 dimers. Single cell RPTPγ oxidation imaging revealed that phospho-EGFR induces activation of NADPH oxidase, which in turn inhibits RPTPγ-mediated dephosphorylation of EGFR, tilting the autocatalytic RPTPγ/EGFR toggle switch reaction towards ligandless phosphorylated EGFR. Reversibility of this reaction to EGF is maintained by the constitutive phosphatase activity of endoplasmic reticulum-associated TCPTP. This RPTPγ/EGFR reaction at the plasma membrane causes promigratory signaling that is separated from proliferative signaling induced by accumulated, liganded, phosphorylated EGF-EGFR in endosomes. Accordingly, loss of RPTPγ results in constitutive promigratory signaling from phosphorylated EGFR monomers. RPTPγ is thus a suppressor of promigratory oncogenic but not of proliferative EGFR signaling.
Keywords: EGFR-PTP interaction; PTP oxidation; oncogenic signaling network; reactive oxygen species; toggle-switch dynamics.
© 2023 The Authors. Published under the terms of the CC BY NC ND 4.0 license.
Conflict of interest statement
The authors declare that they have no conflict of interest.
Figures
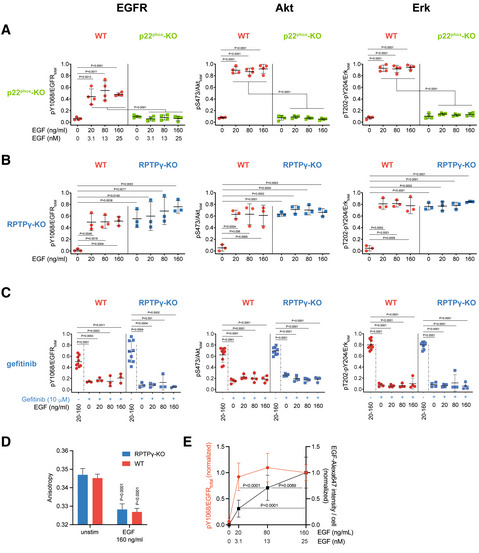
EGFR (pY1068, left), Akt (pS473, middle), and Erk (pT202 and pY204, right) phosphorylation response in WT (red) compared to p22phox‐KO (green) MCF7 cells as function of EGF concentration (ng/ml; nM) upon 5′ stimulation with different doses of EGF‐Alexa647 quantified from Western blot analysis. N = 4 biological replicates with mean ± SD, P: unpaired two‐tailed t‐test.
Same as (A) comparing WT (red) to RPTPγ‐KO (blue) MCF7 cells. N = 3 biological replicates with mean ± SD, P: unpaired two‐tailed t‐test.
Quantitative Western blot analysis as in (A) comparing WT (red) and RPTPγ‐KO (blue) MCF7 cells after EGF stimulus (20, 80, 160 ng/ml from (B), left column: w/o Gefitinib) to the cells from the corresponding cell line treated with 10 μM of the EGFR‐inhibitor Gefitinib for 1 h and the indicated EGF concentration for the last 5′ (ng/ml). N = 3 biological replicates with mean ± SD, P: unpaired two‐tailed t‐test.
Quantification of live cell fluorescence anisotropy microscopy measurements of EGFR‐QG‐mCitrine dimerization level in WT (red) and RPTPγ‐KO (blue) MCF7 cells before and after 160 ng/ml EGF‐Alexa647 stimulus for 15′. mean ± SEM, N = 3 biological replicates, n = 31 cells, P: paired two‐tailed t‐test, against respective unstimulated cases.
Comparison of normalized EGFR-phosphorylation (pY1068/EGFRtotal) as a function of EGF concentration (N = 10, from Figs 1A and B, and EV1E, red) to EGF‐Alexa647 bound to WT MCF7 cells at the corresponding, indicated concentrations normalized to the 160 ng/ml, measured by fluorescence microscopy. N = 5 biological replicates, n = 16–19 fields of view, mean ± SD, P: One‐way ANOVA with Tukey's multiple comparison test.
- A
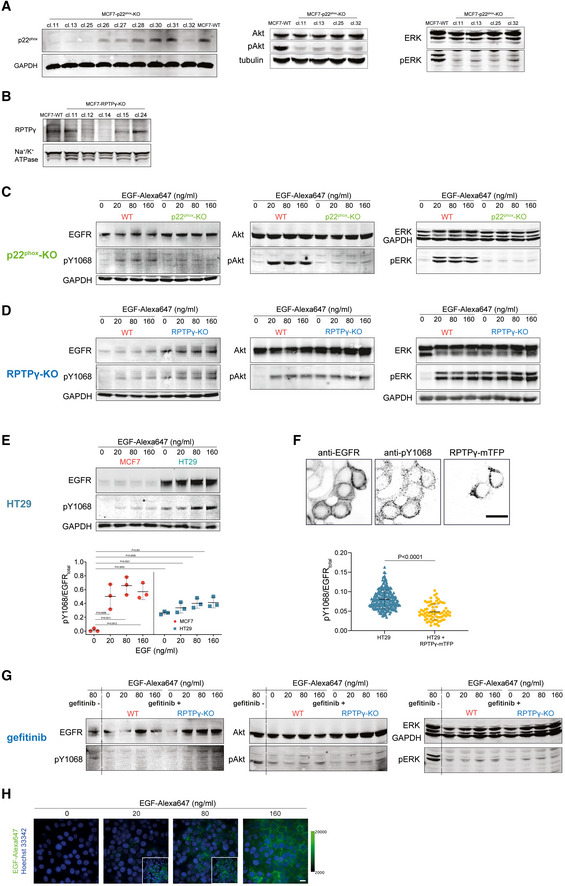
Left: Western blot showing endogenous p22phox (top row) and GAPDH (loading control; bottom row) in cell lysates obtained from different clones of MCF7 cells subjected to CRISPR‐Cas9‐mediated p22phox‐KO (lanes 1–9) and MCF7 WT cells (last lane). Middle: Western blot showing Akt and phospho‐Akt (pS473) in lysates of MCF7 WT cells (lane 1) and selected p22phox‐KO cell lines (lanes 2–5) treated for 5′ with 160 ng/ml EGF. Right: Same as middle for Erk and phospho‐Erk (pT202 and pY204).
- B
Western blot showing endogenous RPTPγ (top row) and Na+/K+ ATPase (loading control; bottom row) in membrane protein extracts of MCF7 WT cells (first lane) and different clones of MCF7 cells subjected to CRISPR‐Cas9‐mediated RPTPγ‐KO (lanes 2–6).
- C, D
(C) Representative western blots showing EGFR (left), Akt (middle) and Erk (right) in the top rows with corresponding phosphorylation (middle row: EGFR: pY1068, Akt: pS473, Erk: pT202 and pY204) in WT (lanes 1–4) and p22phox‐KO (lanes 5–8) MCF7 cells, without EGF and upon 5′ stimulation with EGF‐Alexa647 (20, 80 and 160 ng/ml). Bottom row: GAPDH (loading control). (D) Same arrangement as (C) for WT and RPTPγ‐KO MCF7 cells.
- E
Top panel: Representative western blot showing phosphorylated EGFR at tyrosine 1068 (pY1068) in MCF7 WT and HT29 cells, without EGF and upon 5′ stimulation with EGF‐Alexa647 (20, 80 and 160 ng/ml). Bottom graph: Quantification with mean ± SD, N = 3 biological replicates, P: unpaired two‐tailed t‐test.
- F
Top panel: Representative confocal micrographs of immunostained endogenous EGFR (left image), phosphorylated EGFR at tyrosine 1068 (middle image: pY1068) and ectopically expressed RPTPγ‐mTFP (right image) in HT29 cells in absence of EGF‐stimulus. Scale bar: 10 μm. Bottom panel: Quantification of phosphorylated (pY1068) over total EGFR staining in cells without (blue) and with (yellow) RPTPγ‐mTFP expression. Individual cells with mean ± SD, N = 3, n > 75 cells per condition, P: unpaired two‐tailed t‐test.
- G
Representative western blots showing EGFR (left), Akt (middle) and Erk (right) in the top rows with corresponding phosphorylation (lower row: EGFR: pY1068, Akt: pS473, Erk: pT202 and pY204) in WT (lanes 2–5) and RPTPγ‐KO (lanes 6–9) MCF7 cells treated with 10 μM of EGFR‐inhibitor gefitinib for 1 h, without EGF and upon 5′ stimulation with EGF‐Alexa647 (20, 80 and 160 ng/ml). Lane 1: WT MCF7 cells treated with 80 ng/ml EGF in the absence of gefitinib.
- H
Representative fluorescence micrographs of EGF‐Alexa647 (green) bound to EGFR in WT MCF7 cells at the corresponding, indicated concentrations applied for 5′. Blue: Hoechst33342, scale bar 10 μm. Insets: Individually contrast‐stretched fluorescence micrographs.
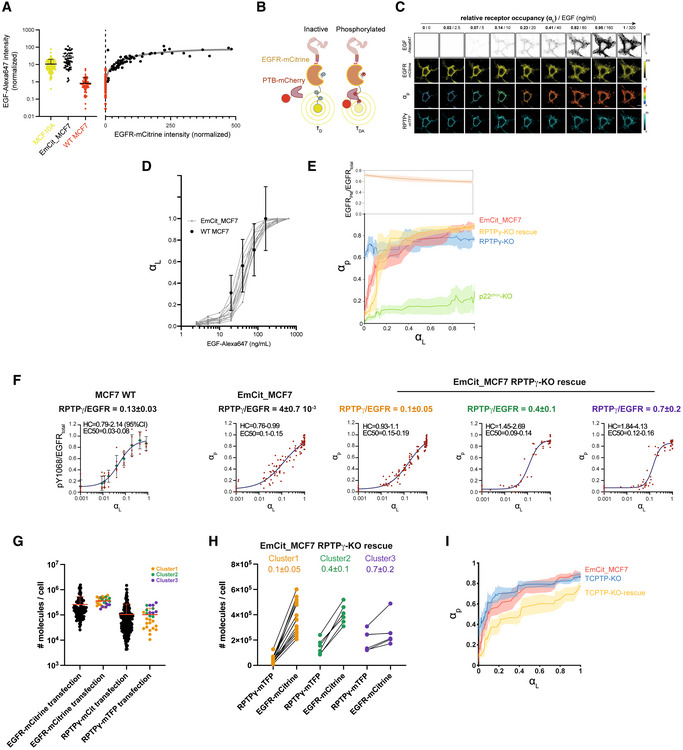
Left panel: comparison of normalized EGF‐Alexa647 (160 ng/ml; 5′) fluorescence intensity bound to individual endogenous EGFR expressing MCF10A (yellow), to exogenous EGFR‐mCitrine expressing EmCit_MCF7 cells (black) and WT MCF7 cells (red); Right panel: normalized EGF‐Alexa647 fluorescence plotted against normalized EGFR‐mCitrine fluorescence intensity in WT (red) and EmCit_MCF7 (black, with 2nd order polynomal fit: gray line) cells. N = 3 biological replicates, n > 75 cells, mean ± SD.
Quantitative imaging of EGFR phosphorylation: Right: Binding of PTB‐mCherry (acceptor) to phosphorylated EGFR‐mCitrine (donor) causes FRET between donor and acceptor resulting in a reduced excited state lifetime (τDA) of the donor (mCitrine) in the EGFR‐mCitrine/PTB‐mCherry complex. Left: Unphosphorylated EGFR‐mCitrine exhibits a discrete fluorescence lifetime (τD) that is distinct from τDA. The spatially invariant τDA and τD are shared global parameters for all pixels that enable the mapping of the local fraction of phosphorylated EGFR‐mCitrine (αp, local parameter) within living cells by global analysis.
Representative fluorescence micrographs of in cell EGF‐Alexa647 (0–320 ng/ml) dose–response imaging for EGFR phosphorylation in RPTPγ‐KO EmCit_MCF7 cells expressing RPTPγ‐mTFP. Concentrations of EGF‐Alexa647 were increased at 1.5′ time interval and are shown as cumulative dose in ng/mL and corresponding relative receptor occupancies (αL), obtained by normalizing the ratiometric fluorescence of EGF‐Alexa647/EGFR‐mCitrine to that at saturating EGF‐Alexa647 dose. First row: EGF‐Alexa647; Second row: EGFR‐mCitrine; Third row: phosphorylated EGFR‐mCitrine fraction (αp); Fourth row: RPTPγ‐mTFP; Scale bar: 10 μm.
Gray: αL upon each administered dose for individual EmCit_MCF7 cells to cumulative doses of EGF‐Alexa647 (2.5–640 ng/ml). N = 3 biological replicates, n = 13 cells. Black: EGF‐Alexa647 bound to WT MCF7 cells at the indicated concentrations normalized to the mean fluorescence intensity at 160 ng/ml EGF‐Alexa647 (Fig 1E; mean ± SD, N = 5 biological replicates, n = 16–19 fields of view).
Top: Relative fraction of PM‐localized fraction of EGFR during the course of in cell dose–response experiments in EmCit_MCF7 cells. N = 3 biological replicates, n = 10 cells. Bottom: EGFR‐mCitrine phosphorylation (αp) plotted as a function of EGF‐receptor occupancy (αL) at the PM to incremental EGF‐Alexa647 doses in p22phox‐KO (green, N = 3 biological replicates, n = 12 cells), RPTPγ‐KO (blue, N = 3 biological replicates, n = 14 cells), RPTPγ‐KO with RPTPγ‐mTFP ectopic expression (yellow, N = 4 biological replicates, n = 13 cells) and WT (red, N = 3 biological replicates, n = 13 cells) EmCit_MCF7 cells. Solid lines: moving medians from single cell profiles; shaded bounds: median absolute deviations.
Left: EGFR‐ (pY1068‐) phosphorylation response in WT MCF7 cells obtained from western blots normalized to maximal phosphorylation obtained by inhibiting all phosphatases by 0.33 mM pervanadate (N = 6; red symbols with mean ± SD and fit to the hill equation (solid line)) at 0 (plotted as 0.001 to fit the logarithmic x‐axis), 0.5, 1, 2, 5, 10, 20, 40, and 80 ng/ml plotted against corresponding αL (obtained from in cell dose response experiments in EmCit_MCF7 cells (D)). Correspondig molecular RPTPγ/EGFR‐ratio (see G, H, Fig EV2H) is depicted above the graphs; Inserted into each graph are the values of Hill coefficient (HC) and EC50 of the fitted hill equation (95% confidence interval). 2nd graph: Same as left graph with αp plotted vs αL both obtained from in cell dose response experiments in EmCit_MCF7 cells. 3rd–5th graph: Same as 2nd graph for EmCit_MCF7 RPTPγ‐KO with RPTPγ‐mTFP ectopic expression clustered by RPTPγ/EGFR‐expression ratio and HC (Fig EV2G).
Number of molecules obtained by normalizing background‐subtracted fluorescence intensities of individual transfected cells against the mean background intensity of untransfected cells, yielding relative expressions levels independent on the fluorophore (Materials and Methods). This value was then set into proportion to the known mean number of EGFR per MCF10A cell to yield absolute molecule count/cell. 1st column: EGFR‐mCitrine in EmCit_MCF7 cells (N = 3 biological replicates, n = 102 cells); 2nd column EGFR‐mCitrine expressed in EmCit_MCF7 RPTPγ‐KO expressing RPTPγ‐mTFP (N = 3 biological replicates, n = 26 cells); 3rd column: RPTPγ‐mCitrine in MCF7 cells expressing additionally EGFR‐mCherry (N = 3 biological replicates, n = 253 cells); 4th column: RPTPγ‐mTFP expressed in EmCit_MCF7 RPTPγ‐KO (N = 3 biological replicates, n = 26 cells; individual cells with mean + SD). Color code in 2nd and 4th column is attribution to respective cluster (H and Fig EV2G).
Number of RPTPγ‐mTFP and EGFR‐mCitrine molecules in EmCit_MCF7 RPTPγ‐KO expressing RPTPγ‐mTFP plotted for the three HC‐RPTPγ/EGFR‐ratio clusters identified in Fig EV2G together with RPTPγ over EGFR molecular ratio (top; mean ± SD).
EGFR‐mCitrine phosphorylation (αp) plotted as a function of EGF‐receptor occupancy (αL) at the PM to incremental EGF‐Alexa647 doses in WT (red, N = 3 biological replicates, n = 13 cells), TCPTP‐KO (blue, N = 3 biological replicates, n = 14 cells) and TCPTP‐KO with TCPTP‐mTFP ectopic expression (yellow, N = 3 biological replicates, n = 13 cells) EmCit_MCF7 cells. Solid lines: moving medians from single cell profiles; shaded bounds: median absolute deviations.
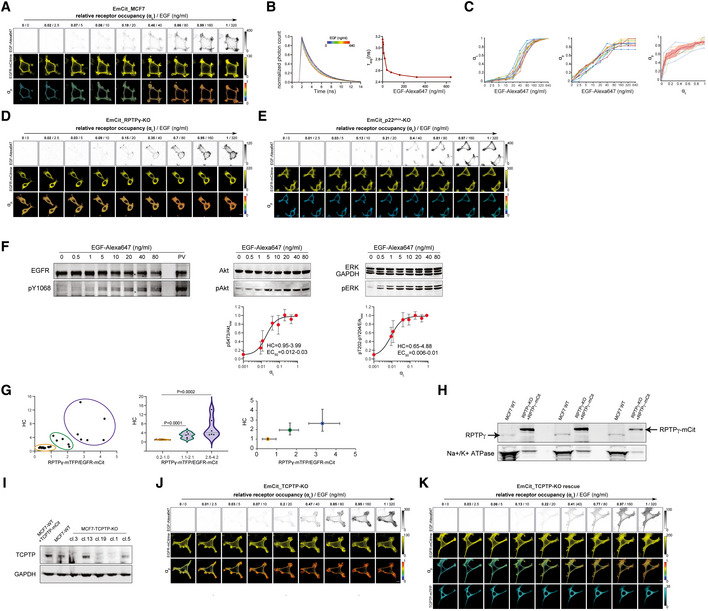
Representative fluorescence micrographs of in cell EGF‐Alexa647 (0–320 ng/ml) dose–response imaging of EGFR phosphorylation in EmCit_MCF7 cells. Concentrations of EGF‐Alexa647 were increased at 1.5′ time interval and are shown as cumulative dose in ng/ml and corresponding relative receptor occupancies (αL), obtained by normalizing the ratiometric fluorescence of EGF‐Alexa647/EGFR‐mCitrine to that at saturating EGF‐Alexa647 dose. First row: EGF‐Alexa647; Second row: EGFR‐mCitrine; Third row: phosphorylated EGFR‐mCitrine fraction (αp); Scale bar: 10 μm.
Left: Peak normalized photon intensity distribution histograms as a function of their time of arrival obtained from time‐correlated single photon counting measurements of EGFR‐mCitrine (with PTB‐mCherry as FRET‐acceptor; Fig 2B) at different cumulative EGF‐Alexa647 doses (A) (color code in inset). Right: Average fluorescence lifetime of mCitrine (τavg, ns) obtained by integrating the area under individual normalized decay curves as a function of cumulative EGF‐Alexa647 dose.
Left: fraction of EGF‐Alexa647 binding to EGFR‐mCitrine (receptor occupancy αL) upon each administered dose (cumulative doses 2.5–640 ng/ml), middle: fraction of phosphorylated EGFR‐mCitrine (αp) derived from FLIM measurments as a function of administered EGF‐Alexa647 dose, right: αp plotted against αL. Colored thin lines: individual cell profiles; Solid red line with shaded bounds: moving median with median absolute deviation.
Same as (A) for RPTPγ‐KO EmCit_MCF7 cells.
Same as (A) for p22phox‐KO EmCit_MCF7 cells.
Top row: Left: Representative western blot showing EGFR (top) and corresponding phosphorylation response at Y1068 (bottom) in lysates of MCF7 WT cells as a function of indicated EGF‐Alexa647 stimulus for 5′. Lysate from cells treated for 5′ with 0.33 mM of PTP‐inhibitor pervanadate (PV, last lane) was used as a positive control for EGFR‐phosphorylation. Middle: Same for Akt (top) and phosphorylation at pS473 (bottom). Right: Same for Erk (top) and phosphorylation at pT202 and pY204 (bottom). Bottom row: Quantification of phosphorylated Akt (pS473/Akttotal; left) and (pErk/Erktotal; right) as a function of the receptor occupancy αL (C) corresponding to the applied doses of EGF‐Alexa647. N = 4 biological replicates, mean (red symbols) ± SD and fit to the hill equation (solid black line). Inserts: Hill coefficient (HC) and EC50 of the fitted hill equation (95% confidence interval).
Left: RPTPγ‐mTFP/EGFR‐mCitrine fluorescence ratio of individual EmCit_MCF7 RPTPγ‐KO cells with RPTPγ‐mTFP ectopic expression plotted against Hill coefficient (HC) obtained from fitting the hill equation to the corresponding in cell EGF‐dose response (compare Fig 2F, N = 3 biological replicates, n = 23 cells) with colored lines encircling data points of the three clusters; Middle/Right: HC versus RPTPγ‐mTFP/EGFR‐mCitrine range of the three clusters; mean ± SD (y‐axis) and full range of values (x‐axis), P: unpaired two‐tailed t‐test.
Representative western blot showing RPTPγ (top row) and Na+/K+ ATPase as a loading control (bottom row) in membrane protein extract lysates of WT MCF7 and MCF7‐RPTPγ‐KO cells stably expressing RPTPγ‐mCitrine. 17 (left and middle) and 28 (right) times more total protein was loaded for WT cells compared to MCF7‐RPTPγ‐KO cells expressing RPTPγ‐mCitrine to maintain band intensity within the dynamic range of the fluorescence detector of the scanner.
Western blot showing endogenous TCPTP expression (top row) and GAPDH (loading control; bottom row) in cell lysates obtained from WT with (lane1) and without (lane2) ectopic TCPTP expression and different clones of MCF7 cells subjected to CRISPR‐Cas9 mediated TCPTP‐KO (3–7 lanes).
Same as (A) for TCPTP‐KO EmCit_MCF7 cells.
Same as (A) for TCPTP‐KO EmCit_MCF7 cells with TCPTP‐mTFP (fourth row) ectopic expression.
- A
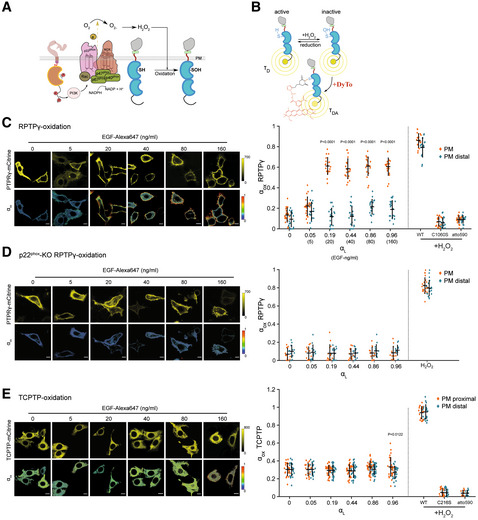
Reaction schematic of EGFR‐dependent PTP‐oxidation: Phosphorylated EGFR (red circles) activates PI3K, which results in the activation of Rac‐GTPase and the cytosolic components of NOX‐assembly like p40phox, p47phox and p67phox. Recruitment of these components to the PM‐based major NOX‐unit and p22phox subunit, mediates the transfer of electrons from the cytosolic NADPH to extracellular oxygen (O2) leading to the formation of superoxide anion (O2 −) that dismutates to hydrogen peroxide (H2O2). Diffusion of H2O2 through the PM causes the cysteine oxidation of the PM‐vicinal PTPs, from thiol (SH) to sulfenic acid (SOH) state.
- B
Schematic of FLIM assay for the quantitative imaging of PTP‐oxidation in live cells: Binding of DyTo (atto590, acceptor) to oxidized cysteines (S‐OH) of PTP‐mCitrine (donor) results in FRET between donor and acceptor reducing the excited state lifetime of the donor (τDA). Spatial invariance of τDA and τD enable the mapping of the fraction of oxidized PTP‐mCitrine (αox, local parameter) by global analysis.
- C–E
(C) In cell EGF‐dose response imaging for RPTPγ‐mCitrine oxidation. Left panel: Representative confocal micrographs of RPTPγ‐mCitrine in EmTFP_MCF7 cells (top row) together with its oxidized fraction estimated using DyTo‐FLIM (αox, bottom row), upon 10′ stimulation with EGF‐Alexa647 (0–160 ng/ml) including 5′ together with 0.5 mM DyTo. Scale bar: 10 μm. Right panel: Quantification depicting the PM‐proximal (orange) and PM‐distal (blue) oxidized fractions as functions of receptor occupancy (αL) and corresponding EGF‐Alexa647, or H2O2 concentration in EmTFP MCF7 cells expressing RPTPγ‐mCitrine (WT) or RPTPγC1060S‐mCitrine (C1060S) as well as WT cells treated with 0.5 mM atto590 instead of DyTo (atto590). Mean of individual cells (symbols) with mean ± SD (black lines), N = 3 biological replicates, n = 13–15 cells per EGF dose. P: unpaired two‐tailed t‐test, between PM (serpentine peripheral structures) and endosomal (vesicular structures) fractions. (D) Same as in (C), for RPTPγ‐mCitrine oxidation in p22phox‐KO cells. N = 3 biological replicates, n = 14–26 cells per EGF dose. (E) Same as in (C), for TCPTP‐mCitrine or TCPTPC216S‐mCitrine (C216S) oxidation in EmTFP_MCF7 cells. N = 3 biological replicates, n = 18–21 cells per EGF dose.
- A
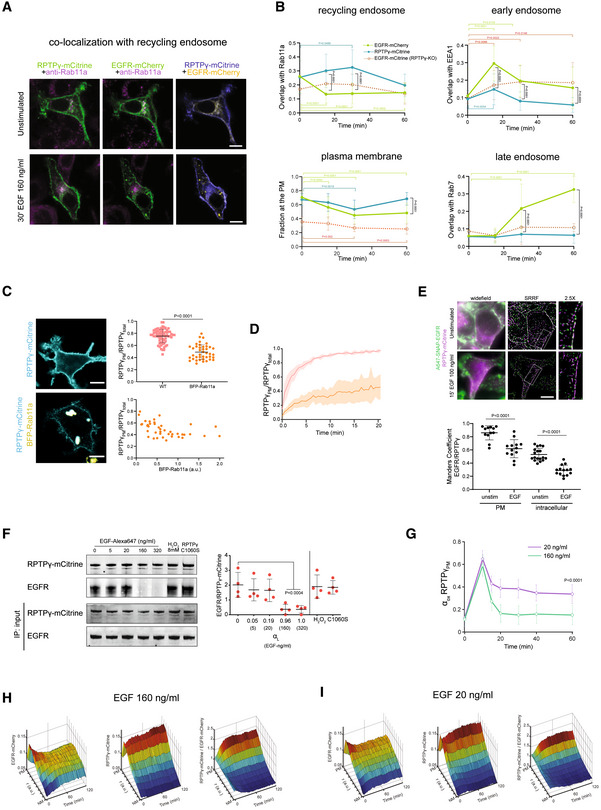
Representative confocal micrographs of MCF7 WT cells showing the co‐localization of RPTPγ‐mCitrine (1st column: green; 3rd column: blue) and EGFR‐mCherry (2nd column: green; 3rd column: yellow) with recycling‐endosome defined by immunostaining against Rab11a (magenta), without (top row) or after 30' EGF‐DyLight405 stimulus (160 ng/ml; bottom row). Scale bar: 10 μm.
- B
Fraction of RPTPγ‐mCitrine (cyan) or EGFR‐mCherry (green) that spatially overlaps with Rab11a (top left, N = 3, n = 23–26 cells per timepoint), PM (bottom left, N = 3 biological replicates, n = 15–17 cells), EEA1‐positive EEs (top right, N = 3 biological replicates, n = 25–28 cells) or Rab7‐positive LEs (bottom right, N = 3 biological replicates, n = 23–27 cells) in MCF7 cells as function of time after 160 ng/ml EGF‐stimulus. Orange symbols/dotted line: same for EGFR‐mCitrine in RPTPγ‐KO cells (N = 3 biological replicates, n = 17–21 cells). P: unpaired two‐tailed t‐test; colored P values compare to the respective species before stimulation, black in between species.
- C
Left: Representative confocal micrographs of MCF7 cells depicting the steady state localization of expressed RPTPγ‐mCitrine (cyan), without (top) or with co‐expression of BFP‐Rab11a (yellow, bottom). Top right: Quantification of PM‐localized fraction of RPTPγ‐mCitrine without (WT) and with co‐expression of BFP‐Rab11a. Bottom right: Fraction of RPTPγ‐mCitrine localized to the PM in individual cells as a function of BFP‐Rab11a expression level, measured by mean BFP‐fluorescence intensity. Scale bar: 10 μm. N = 2 biological replicates, n > 40 per condition, mean ± SD; P: unpaired two‐tailed t‐test.
- D
Fraction of fluorescent paGFP‐RPTPγ at the PM over time after photoactivation of paGFP exclusively in the perinuclear region, in cells with (orange) or without (pink) co‐expression of BFP‐Rab11a. mean ± SD, N = 3 biological replicates, n = 4–7 cells.
- E
Upper panel: Dual‐color widefield images (1st column), SRRF reconstructions (2nd column) with magnifications of boxed areas (3rd column) of Alexa647‐SNAP‐EGFR (green) and RPTPγ‐mCitrine (magenta) of cryo‐arrested MCF7 cells, unstimulated (top row) or stimulated with 100 ng/ml EGF (bottom row) for 15′. Scale bar: 10 μm. Lower panel: corresponding Manders colocalization coefficients for Alexa647‐Snap‐EGFR/RPTPγ‐mCitrine from SRRF reconstructions on intracellular compartments or PM area for unstimulated (n = 12–18) and 15' EGF‐stimulated (n = 13–14) cells. mean ± SD, P: unpaired two‐tailed t‐test.
- F
Left: Representative IP‐western blot showing co‐IP of EGFR (2nd row) upon RPTPγ‐mCitrine (1st row: lanes 1–6) or RPTPγC1060S‐mCitrine (lane 7) pull‐down by anti‐GFP antibody from lysates of MCF7 cells co‐transfected with EGFR and RPTPγ‐mCitrine or RPTPγC1060S‐mCitrine: without stimulus (0 ng/ml), upon 10′ stimulus with EGF‐Alexa647 (5–320 ng/ml, also displayed as corresponding receptor‐occupancy αL, Fig 2D) or 8 mM of H2O2. 3rd and 4th row: total protein concentrations of RPTPγ‐mCitrine and EGFR in the lysate measured by western blot as input control for the Co‐IP. Right: corresponding ratiometric quantification of co‐immunoprecipitated EGFR over pulled down RPTPγ-mCitrine or RPTPγC1060S‐mCitrine protein bands (mean ± SD, N = 4 biological replicates, P: unpaired two‐tailed t‐test).
- G
Oxidized fraction of RPTPγ‐mCitrine (αox) at the PM of live EmTFP_MCF7 cells estimated using DyTo‐FLIM at indicated timepoints upon receptor sub‐saturating (20 ng/ml, magenta, N = 3 biological replicates, n = 21–25 cells) or saturating (160 ng/ml, green, N = 3 biological replicates, n = 23–26 cells) sustained EGF‐Alexa647 stimulus. mean ± SD, P: unpaired two‐tailed t‐test between 20 ng/ml and 160 ng/ml treatment (P < 0.001 from 15′ to 60′).
- H, I
(H) Average spatial–temporal maps constructed from confocal micrographs obtained at 1′ interval from live MCF7 cells showing the distributions of EGFR‐mCherry (left), RPTPγ‐mCitrine (middle) and RPTPγ‐mCitrine/EGFR‐mCherry (right) as a function of their normalized and binned radial distance (r) between PM and nuclear membranes (NM) and time (0–120′), upon sustained treatment with receptor‐saturatig (αL = 0.96 ± 0.05) dose of 160 ng/ml EGF‐Alexa647. N = 3 biological replicates, n = 14 cells. (I) Same as (H) for a receptor‐subsaturating (αL = 0.19 ± 0.04) dose of 20 ng/ml EGF‐Alexa647. N = 3 biological replicates, n = 13 cells.
- A, B
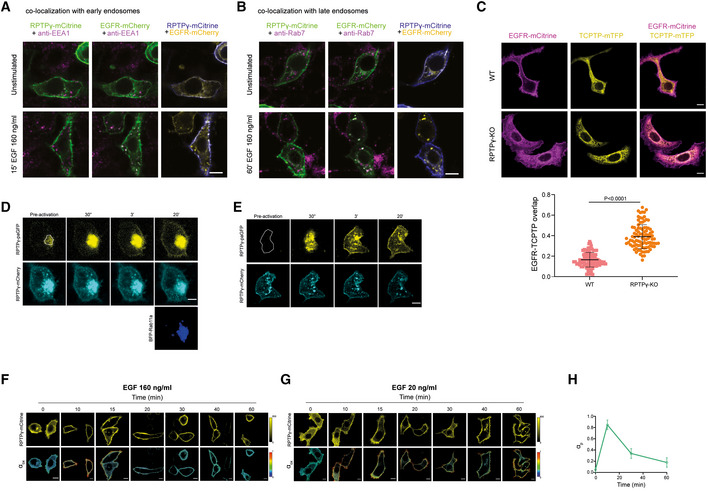
(A) Representative confocal micrographs of MCF7 WT cells showing RPTPγ‐mCitrine (1st column: green; 3rd column: blue) and EGFR‐mCherry (2nd column: green; 3rd column: yellow) with early‐endosomes marked by immunostaining against EEA1 (magenta), without (top row) or after 15' EGF‐DyLight405 stimulus (160 ng/ml; bottom row). Scale bar: 10 μm. (B) Same as (A) with late‐endosomes marked by immunostaining against Rab7 (magenta) without (top row) or after 60' EGF‐DyLight405 stimulus (160 ng/ml; bottom row).
- C
Top panel: Representative confocal micrographs comparing the steady state co‐localized fraction of EGFR‐mCitrine (magenta) with the ER‐marker TCPTP‐mTFP (yellow) in WT (top row) to RPTPγ‐KO (bottom row) MCF7 cells. Bottom panel: Quantification (N = 3, n > 50 per cell type) of the fraction of EGFR‐mCitrine fluorescence co‐localizing with TCPTP‐mTFP fluorescence for WT and RPTPγ‐KO cells. Individual cells with mean ± SD, P: unpaired two‐tailed t‐test.
- D, E
(D) Representative confocal time lapse images of the fluorescence photoactivation of RPTPγ‐paGFP (top row) on the RE (white‐rimmed region) in MCF7 cells with co‐expressed RPTPγ‐mCherry (middle row) and BFP‐Rab11a (last row) at indicated times after photoactivation. Gamma correction for all channels: 0.18. (E) Same as (D) without BFP‐Rab11a co‐expression.
- F, G
(F) Representative confocal micrographs of RPTPγ‐mCitrine (top row) and its oxidized fraction (αox, bottom row, color‐code lower right), obtained at the indicated times upon receptor‐saturating (160 ng/ml), sustained EGF‐Alexa647 stimulus in live MCF7 WT cells expressing EGFR‐mTFP and RPTPγ‐mCitrine. (G) Same as (F) with non‐saturating (20 ng/ml) EGF‐Alexa647 stimulus.
- H
Temporal profile of EGFR‐mCitrine phosphorylation (αp) determined by FLIM in EmCit_MCF7 cells co‐expressing PTB‐mCherry, after pulsed stimulation from 0 to 5′ with saturating EGF‐Alexa647 (160 ng/ml). mean ± SD, N = 3 biological replicates, n = 24 cells.
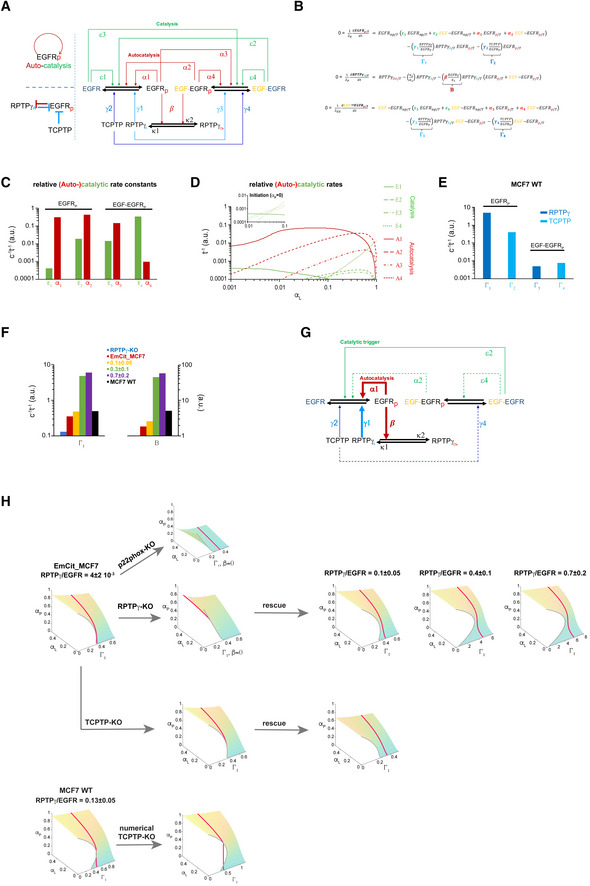
Full RPTPγ‐EGFR‐TCPTP network architecture depicting the chemical conversions (black arrows; p: phosphorylation on EGFR, Ox: oxidized catalytic cysteine on RPTPγ, A: active RPTPγ with reduced catalytic cysteine) and all possible regulatory interactions (colored arrows: causal links; corresponding catalytic, autocatalytic rate constant for EGFR phosphorylation (Fig EV4A)); and – second‐order RPTP‐specific, and – second‐order TCPTP‐dependent dephosphorylation; – second‐order EGFR‐dependent oxidation of RPTPγ; – intrinsic PTP deactivation and activation rate. Rate constants (, ) are color coded as in (B–F) and Fig EV4A and B.
Ordinary differential equations (ODEs) that describe the dynamics of the coupled reactants EGFRp, EGF‐EGFRp and RPTPγA in the general symmetric autocatalytic toggle switch model. , and describe the fractions of active (phosphorylated) proteins, relative to the respective total protein concentration. and describe the fractions of inactive (non‐phosphorylated or oxidized) proteins, EGF‐EGFR depicts EGFR molecules liganded by EGF. : fitted relative kinetic parameter groups color coded to their corresponding rate constants.
Catalytic () and autocatalytic () rate constants obtained from iterative global fitting the ODEs in (B) solved for steady state (dEGFRp/T/dt = dEGF‐EGFRp/T/dt = dRPTPγA/T/dt = 0) to EGF‐dose response () data from all EGFR and PTP expression conditions (Fig 2E, F and I). EGFRp, EGF‐EGFRp: product of the corresponding reactions.
Relative catalytic () and autocatalytic () EGFR phosphorylation rates at steady state as a function of receptor occupancy . Steady state reaction rates were calculated by multiplication of the rate constants () by the relative abundance of the corresponding reactants and catalysts (EGFR, EGFRp, EGF‐EGFR, EGF‐EGFRp) obtained by the global fit. Inset: Calculation of the initiation of the signal by catalytic reactions () at , calculated by multiplication of rate constants () by the relative abundance of reactants (EGFR = ; EGF‐EGFR = ).
Maximal dephosphorylation rates by RPTPγ (Γ1,3 = γ1,3. RPTPγ/EGFRT; dark blue) or TCPTP (Γ2,4 = γ2,4.TCPTP/EGFRT; light blue) of ligandless EGFRp (Γ1, Γ2) or liganded EGF‐EGFRp (Γ3, Γ4) obtained from iterative global fitting the ODEs in (B) solved for steady state (dEGFRp/T/dt = dEGF‐EGFRp/T/dt = dRPTPγA/T/dt = 0) to EGF‐dose response () data of MCF7 WT cells (Fig 2F).
Change of the free parameter groups in EmCit_MCF7 RPTPγ‐KO (blue), EmCit_MCF7 (red), EmCit_MCF7 RPTPγ‐KO expressing RPTPγ‐mTFP splitted in three clusters with increasing RPTPγ‐mTFP/EGFR‐mCitrine ratio (yellow, green, purple; Figs 2H and EV2G) and WT MCF7 cells (black).
RPTPγ‐EGFR‐TCPTP network architecture depicting the chemical conversions and regulatory interactions that are relevant for the EGFR‐phosphorylation response at physiological () EGF‐concentrations. EGFR phosphorylation is mainly driven by autocatalysis among unliganded EGFR (α1; see (D)). EGFRp oxidatively inactivates RPTPγ via ROS (β). RPTPγ counteracts this autocatalysis by dephosphorylation of EGFRp (γ1). The autocatalytic activation needs to be triggered by a sufficient amount of EGFRp in the system that must come from (ε2) and/or from (ε3, ε4), which produce EGF‐EGFRp that can generate EGFRp via α2. TCPTP (γ2,4) has a comparably weaker, but constitutive modulatory dephosphorylation activity.
Experimentally reconstructed 3D‐bifurcation diagrams showing the dependence of steady‐state EGFR phosphorylation (αp) on γ1.RPTPγ/EGFR) and EGF‐receptor occupancy (αL) for EmCit_MCF7 cells (left, 2nd row) with derivated p22phox‐, TCPTP‐ and RPTPγ‐KO and corresponding TCPTP‐ and RPTPγ‐rescue cells, indicated by the black arrows. Last row: MCF7 WT cells (left) with a numerical knockout of TCPTP, (TCPTP associated rates and = 0). Molecular ratio of RPTPγ/EGFR are depicted on top of the corresponding diagram; red line: fit to the experimentally derived dose response trajectory.
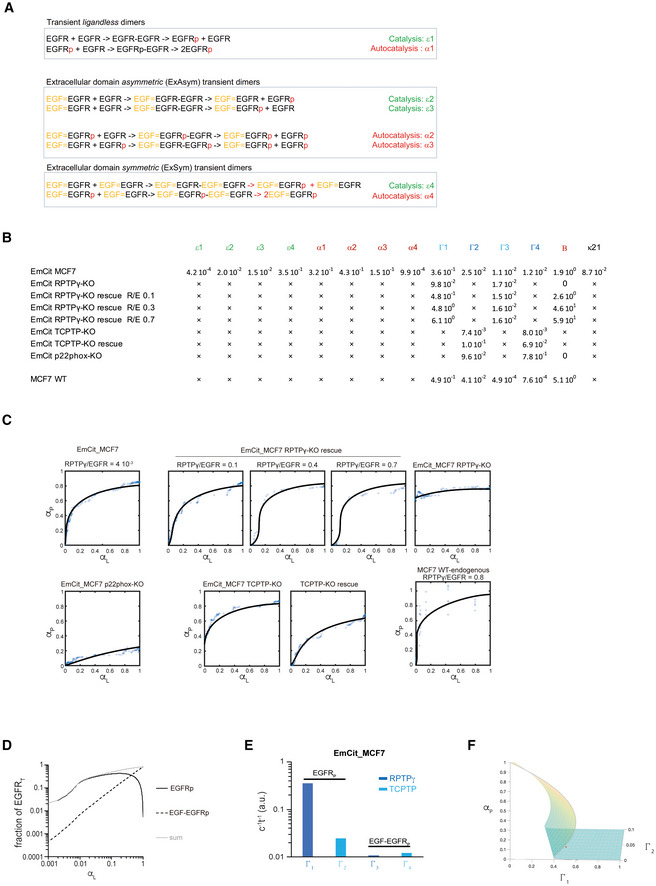
Chemical equations for all possible catalytic (green with corresponding rate constants ε1–4) and autocatalytic (red, α1–4) reactions among liganded (EGF=) and unliganded EGFR that yield phosphorylated EGFR (EGFRp, EGF‐EGFRp), sorted by their corresponding reaction intermediate (transient EGFR‐dimers with 0 (ligandless), 1 (extracellular domain asymmetric: ExAsym) or 2 (extracellular domain symmetric: ExSym) EGF molecules).
Catalytic (green, ε1–4) and autocatalytic (red, α1–4) rate constants as well as kinetic parameter groups (Γ1–4, Β, κ21) obtained from iteratively fitting of the ODEs depicted in Fig 5B considering all possible interactions in the EGFR‐PTP system (Fig 5A) to all EGFR, RPTPγ and TCPTP‐expression conditions, as depicted on the y‐axis. EmCit_MCF7: MCF7 cells ectopically expressing ~2 × 10⁵ EGFR‐mCitrine; RPTPγ‐KO/TCPTP‐KO: CRISPR‐Cas9 meditated knock out in EmCit_MCF7 cells; R/E: RPTPγ/EGFR molecular ratio (Fig 2H); RPTPγ‐KO rescue/TCPTP‐KO rescue: Protein expression rescued by ectopic overexpression of PTP‐mTFP; x: shared parameters that were linked during the global fit and therefore have the same value as shown for EmCit_MCF7.
Overlay of the resulting fit (solid line) yielding the parameters shown in (B) to the experimental data (blue circles) of the fraction of phosphorylated EGFR (αp) versus the fraction of EGF‐bound EGFR (αL), for all EGFR, RPTPγ, NOX and TCPTP‐expression perturbations as well as for endogenous expression in WT MCF7 cells (see B).
Fraction of phosphorylated unliganded (EGFRp/EGFRT) and liganded (EGF‐EGFRp/EGFRT) in MCF7 WT cells plotted against the fraction of EGF‐bound EGFR (αL). Fractions were obtained from iterative global fitting of the ODEs in (Fig 5B) solved for steady state (dEGFRp/T/dt = dEGF‐EGFRp/T/dt = dRPTPγA/T/dt = 0) to EGF‐dose response () data surface (B). Sum: total fraction of phosphorylated EGFR ((EGFRp + EGF‐EGFRp)/EGFRT).
Maximal dephosphorylation rates by RPTPγ (Γ1,3 = γ1,3. RPTPγ/EGFRT; dark blue) or constitutive dephosphorylation rates by TCPTP (Γ2,4 = γ2,4.TCPTP/EGFRT; light blue) of ligandless EGFRp (Γ1, Γ2) or liganded EGF‐EGFRp (Γ3, Γ4) of EmCit_MCF7 WT cells obtained from iterative global fitting of the ODEs in (Fig 5B) solved for steady state (dEGFRp/T/dt = dEGF‐EGFRp/T/dt = dRPTPγA/T/dt = 0) to EGF‐dose response () data surface (B).
3D‐bifurcation diagram showing the dependence of EGFR phosphorylation (αp) on (=γ1.RPTPγ/EGFR) and γ2.TCPTP/EGFR) for αL = 0 using the kinetic parameters obtained for WT MCF7 cells. red dot: Steady‐state poising of the system at endogenous RPTPγ/TCPTP expression.
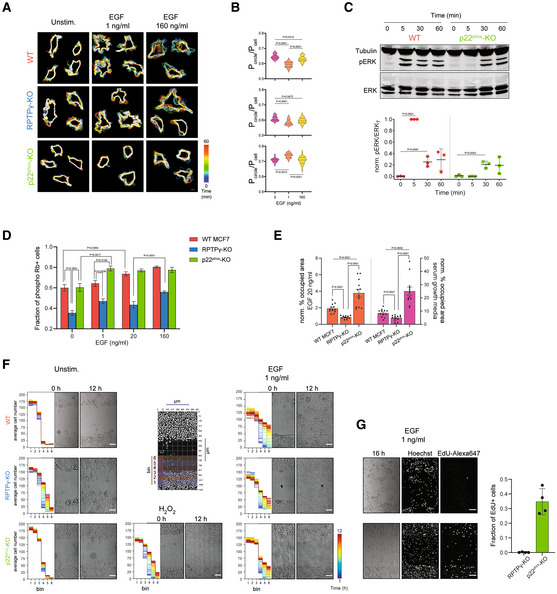
Representative cell contour maps showing the temporal changes (color bar: time (min), bottom right) in cell morphology for WT (upper row), RPTPγ‐KO (middle row) and p22phox‐KO (bottom row) MCF7 cells, expressing PM‐marker BFP‐tkRas imaged every 2′ over 60′, without (1st column) or with 1 ng/ml (2nd column) or 160 ng/ml (3rd column) EGF‐Alexa647. Scale bar: 10 μm.
Morphometric quantification by the ratio of the perimeter of an equiareal circle to the actual perimeter of all cells (N = 3 biological replicates, n = 9–20 cells) at all timepoints (Pcircle/Pcell). 1st row: WT, 2nd row: RPTPγ‐KO, 3rd row: p22phox‐KO MCF7 cells. P: one‐way ANOVA with Šídák's multiple comparisons.
Top: Representative Western blot against Erk and phosphorylated Erk (pT202 and pY204) in WT (red) compared to p22phox‐KO (green) MCF7 cells after the indicated times of sustained stimulation with 20 ng/ml EGF‐Alexa647. Bottom: Corresponding quantification of the fraction of phosphorylated ERK as a function of stimulation time. Mean ± SD, N = 3 biological replicates, P: unpaired two‐tailed t‐test.
Quantification of cell proliferation using retinoblastoma (Rb) protein phosphorylation detected by immunofluorescence, for WT (red), RPTPγ‐KO (blue) and p22phox‐KO (green) MCF7 cells without or post 24 h of EGF‐Alexa647 treatment (1, 20, 160 ng/ml). Mean ± SEM, N = 3 biological replicates, n > 2,000 cells per EGF stimulus per cell line, P: two‐way ANOVA with Tukey multiple comparisons.
Quantification of the culture‐well area (%) occupied by proliferating cell‐colonies, obtained from clonogenic assays of WT, RPTPγ‐KO and p22phox‐KO MCF7 cells, plated either in medium containing 20 ng/ml EGF and 0.5% FCS (left: orange bars, N = 3–4 biological replicates, 11–12 wells each) or complete serum growth medium containing 10% FCS (right: pink bars, N = 4 biological replicates, 12 wells each). Mean ± SEM, P: unpaired two‐tailed t‐test with Welch's correction.
Representative transmitted light micrographs of WT (top row), RPTPγ‐KO (middle row) and p22phox‐KO (bottom row) MCF7 cells, without (1st column) and during stimulation with, H2O2 (0.5 mM, 2nd column) or EGF‐Alexa647 (1 ng/ml, 3rd column) at the indicated times (0, 12 h) after removal of a migration barrier. Scale bar: 100 μm. Insets left of the images: Temporal maps (color‐code lower right) depicting the average cell number (over N = 4–5 biological replicates) distributed in six spatial bins around the initial cell front measured every 10′ (schematic in second column: location of the lateral bins in the migration chamber).
Left panel: Exemplary images of RPTPγ‐KO (top row) and p22phox‐KO (bottom row) MCF7 cells stimulated with 1 ng/ml EGF‐Alexa647, at 16 h after removal of a migration barrier together with Hoechst 33342 (2nd column) and 5‐Ethinyl‐2'‐Desoxyuridin (EdU 10 μM, 1 h; 3rd column) staining obtained after 17 h. Right Graph: Quantification of the fraction of dividing (EdU+) cells between 16th and 17th hour. N = 4 biological replicates, Mean ± SD.
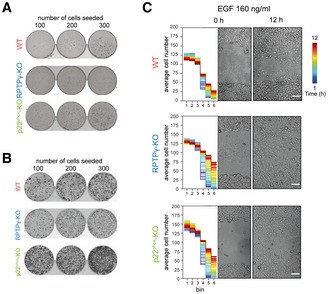
Representative images of a clonogenic assay of WT (top), RPTPγ‐KO (middle) and p22phox‐KO (bottom) MCF7 cells plated in medium containing 20 ng/ml EGF and 0.5% FCS at an initial density of 100, 200 and 300 cells/well, fixed stained with crystal violet and imaged on the 7th day post plating.
Same representation as (A), for cells plated in complete serum growth medium containing 10% FCS.
Representative transmitted light micrographs of WT (top row), RPTPγ‐KO (middle row) and p22phox‐KO (bottom row) MCF7 cells during stimulation with EGF‐Alexa647 (160 ng/ml) at the indicated times (0, 12 h) after removal of a migration barrier in confluent cell layers. Scale bars: 100 μm. Insets left of the images: Average cell number (N = 4–5) distributed in six spatial bins (position of the bins schematized in Fig 6F) around the initial cell front measured every 10′, color‐coded (upper right) by time after barrier removal.
Similar articles
-
Interdependence between EGFR and Phosphatases Spatially Established by Vesicular Dynamics Generates a Growth Factor Sensing and Responding Network.Cell Syst. 2018 Sep 26;7(3):295-309.e11. doi: 10.1016/j.cels.2018.06.006. Epub 2018 Aug 22. Cell Syst. 2018. PMID: 30145116 Free PMC article.
-
Growth hormone-induced phosphorylation of epidermal growth factor (EGF) receptor in 3T3-F442A cells. Modulation of EGF-induced trafficking and signaling.J Biol Chem. 2003 May 23;278(21):18902-13. doi: 10.1074/jbc.M300939200. Epub 2003 Mar 14. J Biol Chem. 2003. PMID: 12642595
-
EGF-dependent re-routing of vesicular recycling switches spontaneous phosphorylation suppression to EGFR signaling.Elife. 2015 Nov 26;4:e12223. doi: 10.7554/eLife.12223. Elife. 2015. PMID: 26609808 Free PMC article.
-
The physical basis of analog-to-digital signal processing in the EGFR system-Delving into the role of the endoplasmic reticulum.Bioessays. 2024 Sep;46(9):e2400026. doi: 10.1002/bies.202400026. Epub 2024 Jul 11. Bioessays. 2024. PMID: 38991978 Review.
-
Processing Temporal Growth Factor Patterns by an Epidermal Growth Factor Receptor Network Dynamically Established in Space.Annu Rev Cell Dev Biol. 2020 Oct 6;36:359-383. doi: 10.1146/annurev-cellbio-013020-103810. Epub 2020 Jul 21. Annu Rev Cell Dev Biol. 2020. PMID: 32692593 Review.
Cited by
-
The receptor protein tyrosine phosphatase PTPRK promotes intestinal repair and catalysis-independent tumour suppression.J Cell Sci. 2024 Jul 15;137(14):jcs261914. doi: 10.1242/jcs.261914. Epub 2024 Jul 22. J Cell Sci. 2024. PMID: 38904097 Free PMC article.
-
Tonic ErbB signaling underlies TGFβ-induced activation of ERK and is required for lens cell epithelial to myofibroblast transition.Mol Biol Cell. 2024 Mar 1;35(3):ar35. doi: 10.1091/mbc.E23-07-0294. Epub 2024 Jan 3. Mol Biol Cell. 2024. PMID: 38170570 Free PMC article.
References
-
- Ambasta RK, Kumar P, Griendling KK, Schmidt HHHW, Busse R, Brandes RP (2004) Direct interaction of the novel Nox proteins with p22phox is required for the formation of a functionally active NADPH oxidase. J Biol Chem 279: 45935–45941 - PubMed
-
- Arganda‐Carreras I, Kaynig V, Rueden C, Eliceiri KW, Schindelin J, Cardona A , Seung HS (2017) Trainable Weka segmentation: a machine learning tool for microscopy pixel classification. Bioinformatics 33: 2424–2426 - PubMed
-
- Bae YS, Kang SW, Seo MS, Baines IC, Tekle E, Chock PB, Rhee SG (1997) Epidermal growth factor (EGF)‐induced generation of hydrogen peroxide. J Biol Chem 272: 217–221 - PubMed
Publication types
MeSH terms
Substances
LinkOut - more resources
Full Text Sources
Research Materials
Miscellaneous
