. 2023 Mar 15;15(6):1773.
doi: 10.3390/cancers15061773.

The Impact of TRAIL on the Immunological Milieu during the Early Stage of Abdominal Sepsis

Affiliations

The Impact of TRAIL on the Immunological Milieu during the Early Stage of Abdominal Sepsis

Ann-Kathrin Berg et al. Cancers (Basel). .

Abstract

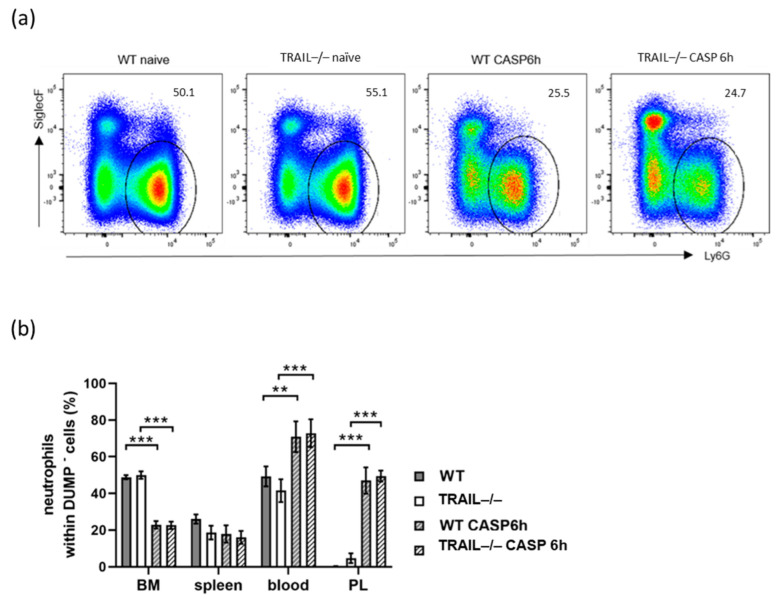
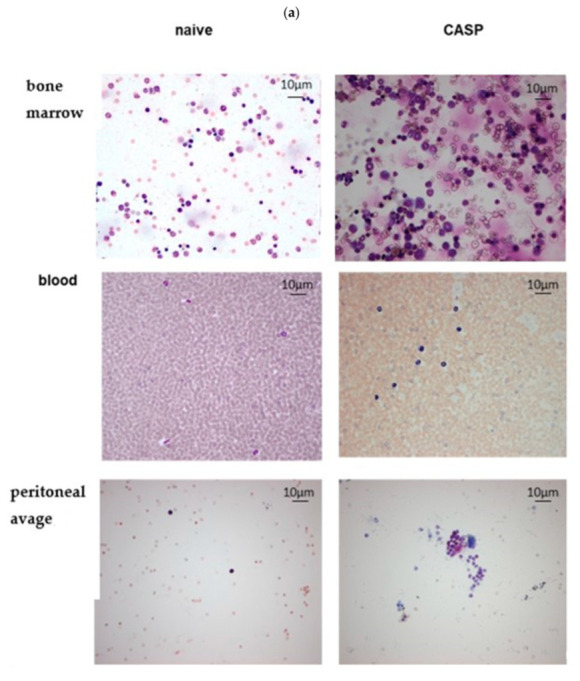
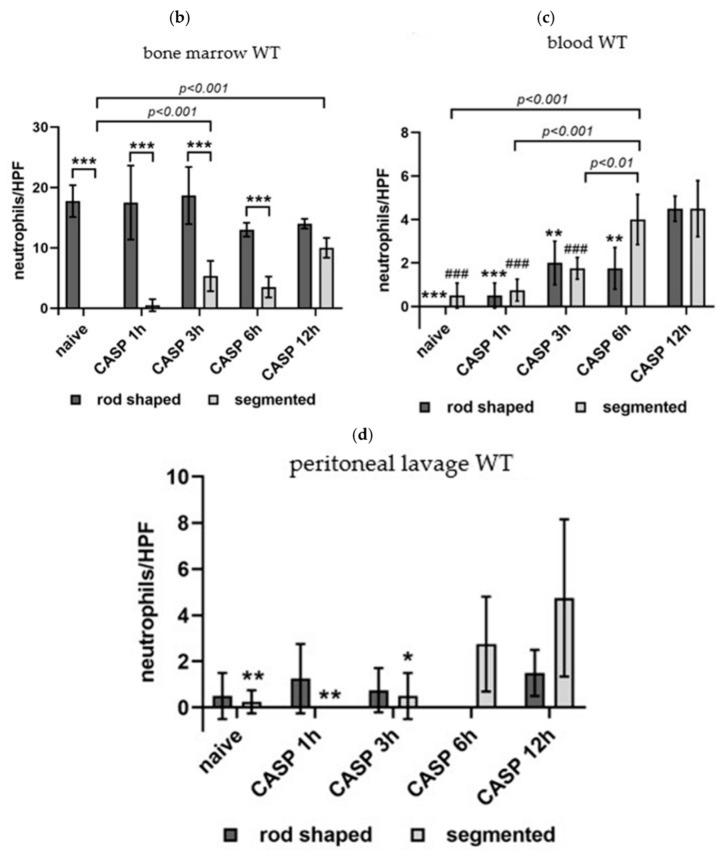
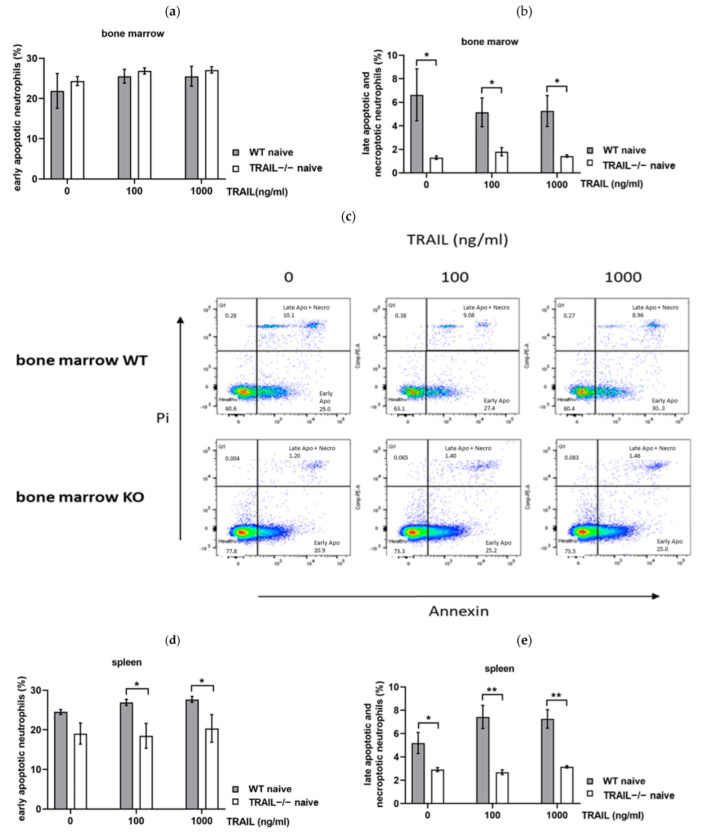
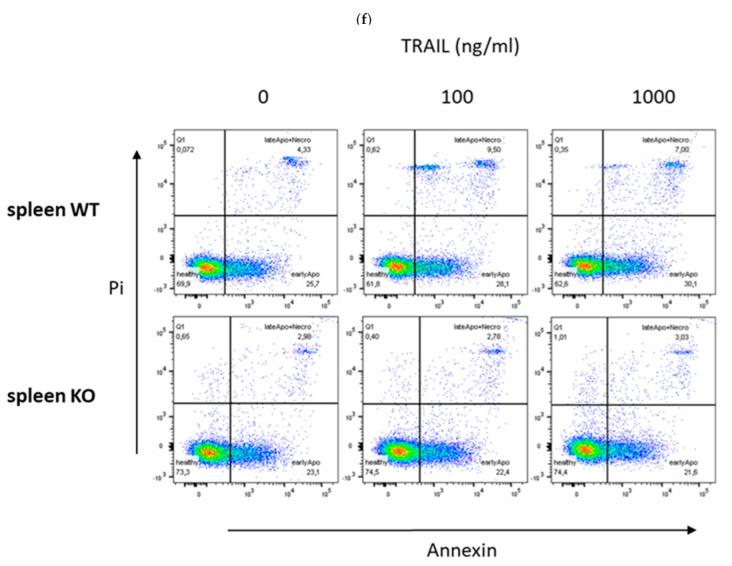
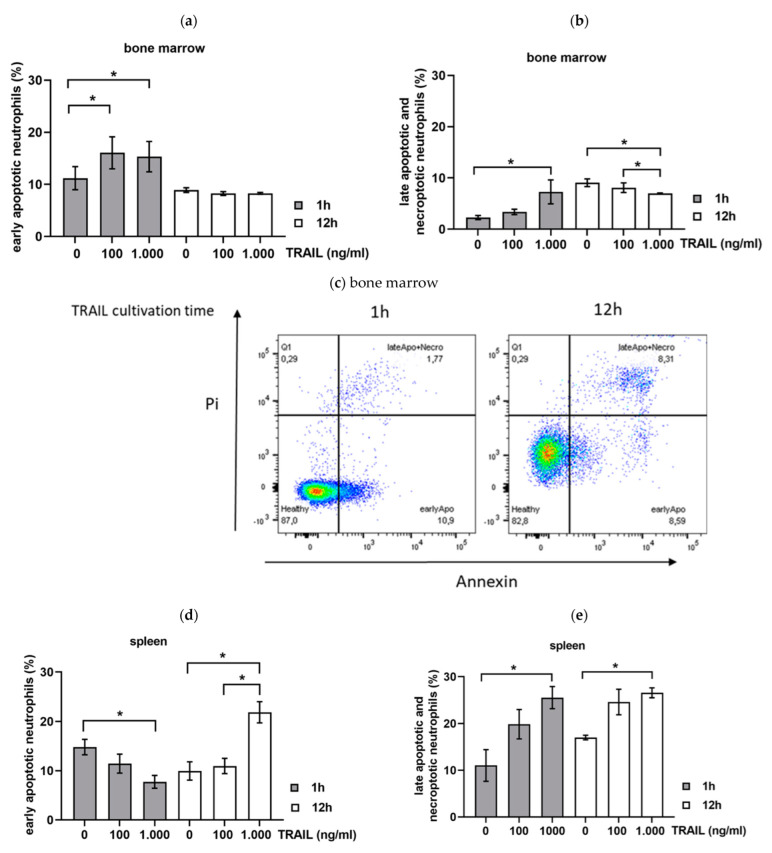
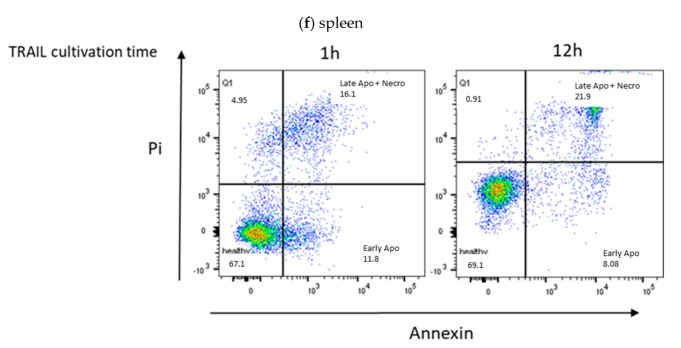
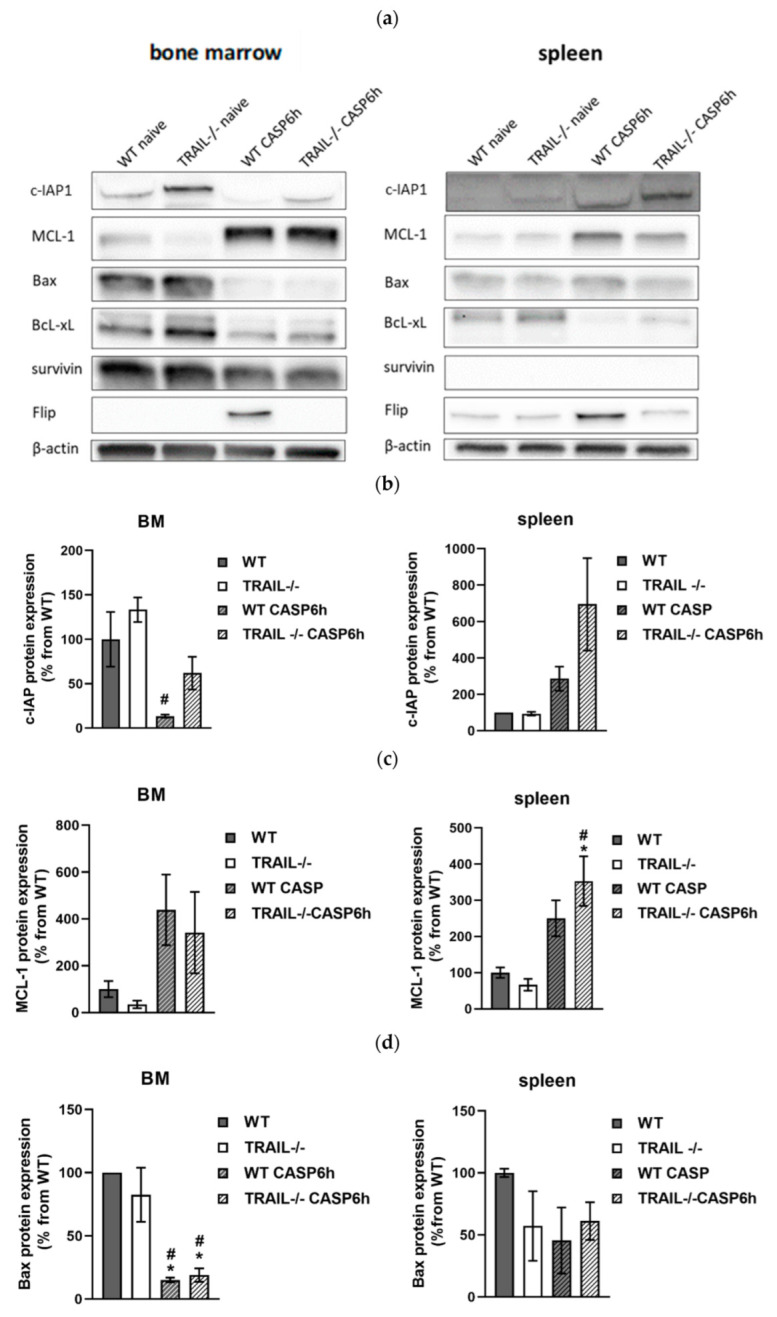
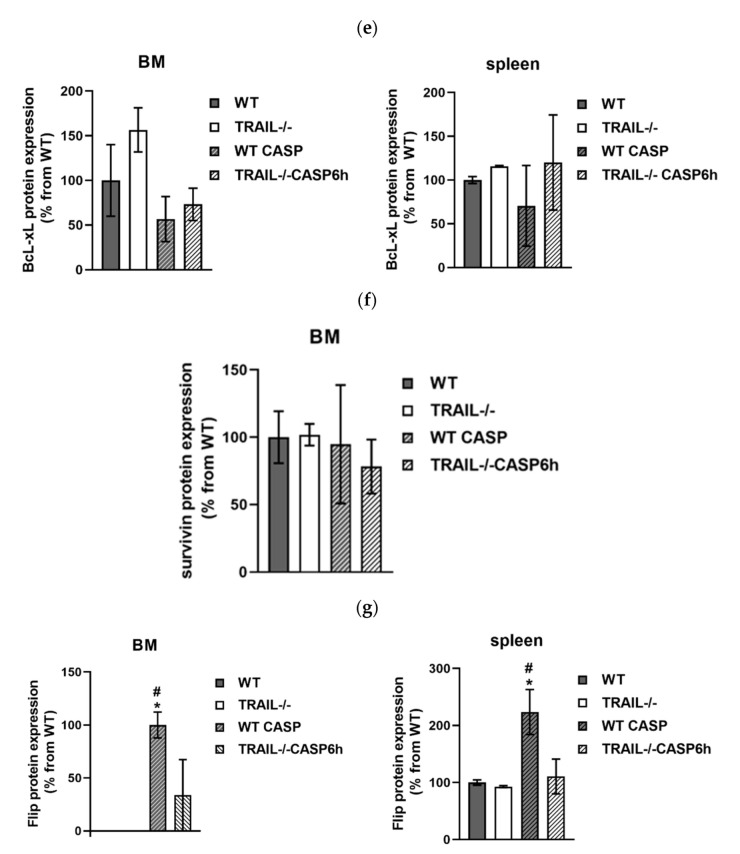
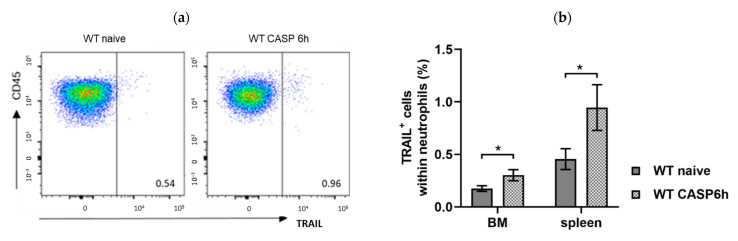
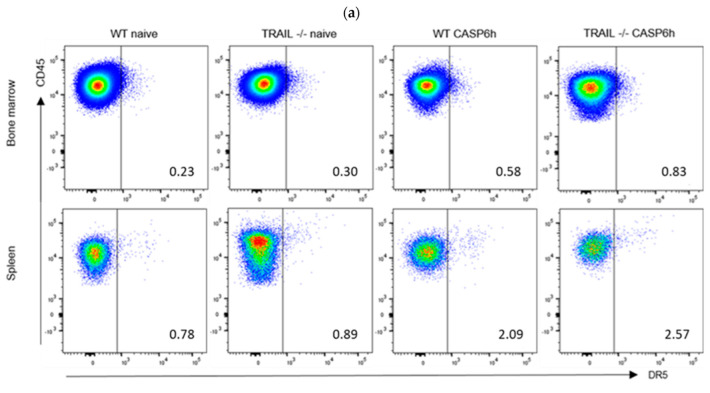
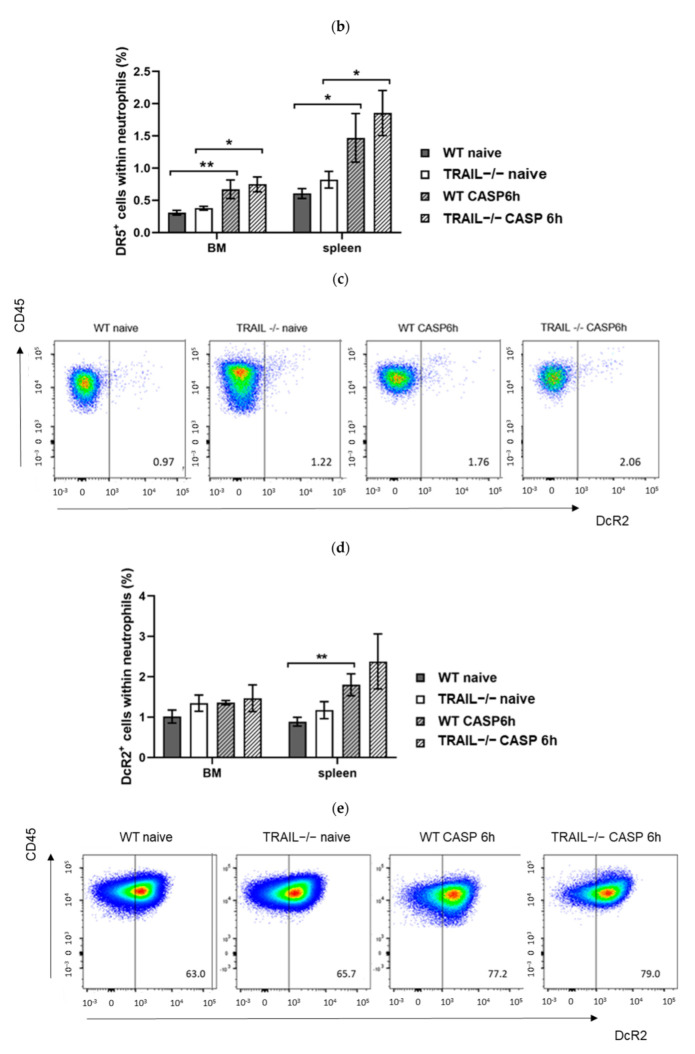
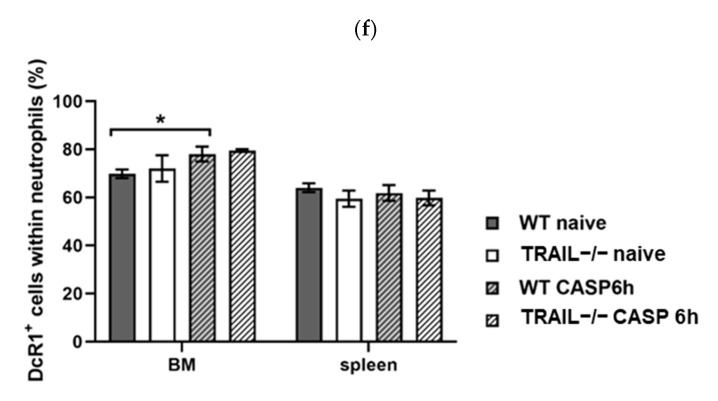
Despite intensive scientific efforts, the therapy of peritonitis is presently limited to symptomatic measures, including infectious source control and broad-spectrum antibiotics. Promising therapeutic approaches to reduce morbidity and mortality are still missing. Within the early phase of abdominal sepsis, apoptosis of neutrophil granulocytes is inhibited, which is linked to tissue damage and septic shock. TNF-related apoptosis-inducing ligand (TRAIL) is a promising agent to stimulate neutrophil apoptosis. However, the underlying mechanisms have not been elucidated so far. The objective of the present study was to characterize the molecular mechanisms of TRAIL-stimulated apoptosis in early abdominal sepsis. Therefore, the murine sepsis model Colon ascendens stent peritonitis (CASP) was applied in wild type (WT) and TRAIL knock-out (TRAIL-/-) C57/BL6j mice. Neutrophil granulocytes were isolated from spleen, blood, bone marrow, and peritoneal lavage using magnetic-activated cell sorting. Neutrophil maturation was analyzed by light microscopy, and apoptotic neutrophils were quantified by fluorescence-activated cell sorting (FACS). Western blot and FACS were used to investigate expression changes in apoptotic proteins and TRAIL receptors. The impact of TRAIL-induced apoptosis was studied in vitro. In septic mice (CASP 6 h), the number of neutrophils in the BM was reduced but increased in the blood and peritoneal lavage. This was paralleled by an increased maturation of neutrophils from rod-shaped to segmented neutrophils (right shift). In vitro, extrinsic TRAIL stimulation did not alter the apoptosis level of naïve neutrophils but stimulated apoptosis in neutrophils derived from septic WT and TRAIL-/- mice. Neutrophils of the bone marrow and spleen showed enhanced protein expression of anti-apoptotic Flip, c-IAP1, and McL-1 and reduced expression levels of pro-apoptotic Bax in neutrophils, which might correlate with apoptosis inhibition in these cells. CASP increased the expression of intrinsic TRAIL in neutrophils derived from the bone marrow and spleen. This might be explained by an increased expression of the TRAIL receptors DR5, DcR1, and DcR2 on neutrophils in sepsis. No differences were observed between septic or naïve WT and TRAIL-/- mice. In conclusion, the present study shows that neutrophil granulocytes are sensitive to TRAIL-stimulated apoptosis in the early stage of abdominal sepsis, emphasizing the promising role of TRAIL as a therapeutic agent.

Keywords: CASP; TRAIL; apoptosis; neutrophils; peritonitis; sepsis.


Conflict of interest statement

The authors declare no conflict of interest.

Figures

Figure 1
Figure 1
Influence of 6h CASP on the neutrophil ratio in lineage-negative Ly6G cells. (a) Representative FACS plots show staining of neutrophils derived from the bone marrow. (b) The numbers of neutrophils within DUMP cells of 5 mice each are shown for bone marrow (BM), spleen, peritoneal lavage (PL), and blood. Neutrophils of septic WT and TRAIL–/– mice were compared with naïve ones. Graphs show mean ± SEM (** p < 0.01, *** p < 0.001).
Figure 2
Figure 2
CASP induces a reactive left shift of neutrophil granulocytes. Neutrophil granulocytes of untreated WT and septic WT mice 1 h, 3 h, 6 h, and 12 h after CASP induction were counted in high-power fields (HPF) of smear slides (n = 5). (a) Representative smear slides of naïve WT and septic WT after 12 h CASP stained with Hemacolor (original magnification 400×). (b) Maturation of neutrophil granulocytes during CASP in BM (*** p < 0.001), (c) blood (* p < 0.01 and ** p < 0.001 versus WT CASP 12 h rod-shaped; ### p < 0.001 versus WT CASP 12 h segmented), and (d) peritoneal lavage (* p < 0.05 and ** p < 0.01 versus WT CASP 12 h segmented). Graphs show mean ± SEM.
Figure 2
Figure 2
CASP induces a reactive left shift of neutrophil granulocytes. Neutrophil granulocytes of untreated WT and septic WT mice 1 h, 3 h, 6 h, and 12 h after CASP induction were counted in high-power fields (HPF) of smear slides (n = 5). (a) Representative smear slides of naïve WT and septic WT after 12 h CASP stained with Hemacolor (original magnification 400×). (b) Maturation of neutrophil granulocytes during CASP in BM (*** p < 0.001), (c) blood (* p < 0.01 and ** p < 0.001 versus WT CASP 12 h rod-shaped; ### p < 0.001 versus WT CASP 12 h segmented), and (d) peritoneal lavage (* p < 0.05 and ** p < 0.01 versus WT CASP 12 h segmented). Graphs show mean ± SEM.
Figure 3
Figure 3
Recombinant TRAIL did not stimulate apoptosis in neutrophils derived from naïve mice in vitro. Neutrophils isolated from bone marrow (a,b) and spleen (d,e) of naïve WT and TRAIL–/– mice (n = 5 each) were stimulated with different concentrations of TRAIL (0 ng/mL, 100 ng/mL, 1000 ng/mL) in vitro. Representative FACS plots show staining of neutrophils derived from the bone marrow (c) and the spleen (f). The level of early (a,c) and late (b,d) apoptosis in neutrophils with and without TRAIL treatment are shown. Graphs show means ± SEM (* p < 0.05, ** p < 0.01).
Figure 3
Figure 3
Recombinant TRAIL did not stimulate apoptosis in neutrophils derived from naïve mice in vitro. Neutrophils isolated from bone marrow (a,b) and spleen (d,e) of naïve WT and TRAIL–/– mice (n = 5 each) were stimulated with different concentrations of TRAIL (0 ng/mL, 100 ng/mL, 1000 ng/mL) in vitro. Representative FACS plots show staining of neutrophils derived from the bone marrow (c) and the spleen (f). The level of early (a,c) and late (b,d) apoptosis in neutrophils with and without TRAIL treatment are shown. Graphs show means ± SEM (* p < 0.05, ** p < 0.01).
Figure 4
Figure 4
Impact of TRAIL stimulation on apoptosis in neutrophils derived from BM and spleen of septic WT mice. Neutrophils of septic WT mice 6 h after CASP induction (n = 5) were cultured for 1 and 12 h with and without recombinant TRAIL in vitro. (a) Percentage of early apoptotic and (b) late apoptotic and necroptotic neutrophils of BM, (d) early apoptotic and (e) late apoptotic and necroptotic neutrophils of the spleen are shown (n = 5 each). Representative FACS plots show staining of neutrophils derived from the bone marrow (c) and the spleen (f). Graphs show mean ± SEM (* p < 0.05).
Figure 4
Figure 4
Impact of TRAIL stimulation on apoptosis in neutrophils derived from BM and spleen of septic WT mice. Neutrophils of septic WT mice 6 h after CASP induction (n = 5) were cultured for 1 and 12 h with and without recombinant TRAIL in vitro. (a) Percentage of early apoptotic and (b) late apoptotic and necroptotic neutrophils of BM, (d) early apoptotic and (e) late apoptotic and necroptotic neutrophils of the spleen are shown (n = 5 each). Representative FACS plots show staining of neutrophils derived from the bone marrow (c) and the spleen (f). Graphs show mean ± SEM (* p < 0.05).
Figure 5
Figure 5
Effect of 6h CASP on the expression of pro- and anti-apoptotic proteins. (a) Representative Western blots show protein expression in neutrophils derived from the BM and spleen of naïve and septic WT or TRAIL–/–mice. Quantification of the expression level of c-IAP (b), MCL-1 (c), Bax (d), BcL-xL (e), survivin (f), and Flip (g). Graphs show mean ± SEM (* p < 0.05; versus WT # p < 0.05 versus TRAIL–/–).
Figure 5
Figure 5
Effect of 6h CASP on the expression of pro- and anti-apoptotic proteins. (a) Representative Western blots show protein expression in neutrophils derived from the BM and spleen of naïve and septic WT or TRAIL–/–mice. Quantification of the expression level of c-IAP (b), MCL-1 (c), Bax (d), BcL-xL (e), survivin (f), and Flip (g). Graphs show mean ± SEM (* p < 0.05; versus WT # p < 0.05 versus TRAIL–/–).
Figure 6
Figure 6
Impact of 6h CASP on the expression of TRAIL in neutrophils from BM and spleen. TRAIL was stained and assessed by FACS. (a) Representative FACS plots show TRAIL-positive neutrophils. (b) Quantification of TRAIL expression in neutrophils of naïve and septic WT mice (n = 5 each). Graphs show mean ± SEM (* p < 0.05).
Figure 7
Figure 7
Effect of 6h CASP treatment on the expression of TRAIL receptors. TRAIL receptors DR5, DcR1, and DcR2 were stained and assessed by FACS. Representative FACS plots show (a) DR5 staining in neutrophils derived from BM and spleen, (c) DcR2 staining in neutrophils of the spleen, and (e) DcR1 staining in neutrophils of the BM. Quantification of (b) DR5, (d) DcR2, and (f) DcR1 expression in neutrophils of the BM and spleen of n = 5 animals in each group. Neutrophils of septic WT and TRAIL–/– mice were compared with naïve ones. Graphs show mean ± SEM (* p < 0.05, ** p < 0.01).
Figure 7
Figure 7
Effect of 6h CASP treatment on the expression of TRAIL receptors. TRAIL receptors DR5, DcR1, and DcR2 were stained and assessed by FACS. Representative FACS plots show (a) DR5 staining in neutrophils derived from BM and spleen, (c) DcR2 staining in neutrophils of the spleen, and (e) DcR1 staining in neutrophils of the BM. Quantification of (b) DR5, (d) DcR2, and (f) DcR1 expression in neutrophils of the BM and spleen of n = 5 animals in each group. Neutrophils of septic WT and TRAIL–/– mice were compared with naïve ones. Graphs show mean ± SEM (* p < 0.05, ** p < 0.01).

Similar articles

Cited by

References

    1. Rudd K.E., Johnson S.C., Agesa K.M., Shackelford K.A., Tsoi D., Kievlan D.R., Colombara D.V., Ikuta K.S., Kissoon N., Finfer S., et al. Global, regional, and national sepsis incidence and mortality, 1990–2017: Analysis for the Global Burden of Disease Study. Lancet. 2020;395:200–211. doi: 10.1016/S0140-6736(19)32989-7. - DOI - PMC - PubMed
    1. Salomao R., Brunialti M.K., Rapozo M.M., Baggio-Zappia G.L., Galanos C., Freudenberg M. Bacterial sensing, cell signaling, and modulation of the immune response during sepsis. Shock. 2012;38:227–242. doi: 10.1097/SHK.0b013e318262c4b0. - DOI - PubMed
    1. Hotchkiss R.S., Karl I.E. The pathophysiology and treatment of sepsis. N. Engl. J. Med. 2003;348:138–150. doi: 10.1056/NEJMra021333. - DOI - PubMed
    1. Novotny A.R., Reim D., Assfalg V., Altmayr F., Friess H.M., Emmanuel K., Holzmann B. Mixed antagonist response and sepsis severity-dependent dysbalance of pro- and anti-inflammatory responses at the onset of postoperative sepsis. Immunobiology. 2012;217:616–621. doi: 10.1016/j.imbio.2011.10.019. - DOI - PubMed
    1. Wiley S.R., Schooley K., Smolak P.J., Din W.S., Huang C.P., Nicholl J.K., Sutherland G.R., Smith T.D., Rauch C., Smith C.A., et al. Identification and characterization of a new member of the TNF family that induces apoptosis. Immunity. 1995;3:673–682. doi: 10.1016/1074-7613(95)90057-8. - DOI - PubMed