. 2023 Mar 18;12(6):932.
doi: 10.3390/cells12060932.

The LINC Complex Inhibits Excessive Chromatin Repression

Affiliations

The LINC Complex Inhibits Excessive Chromatin Repression

Daria Amiad Pavlov et al. Cells. .

Abstract

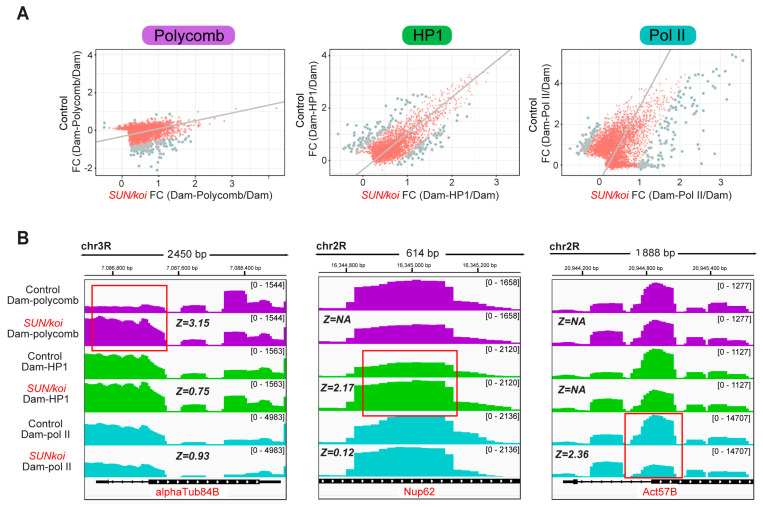
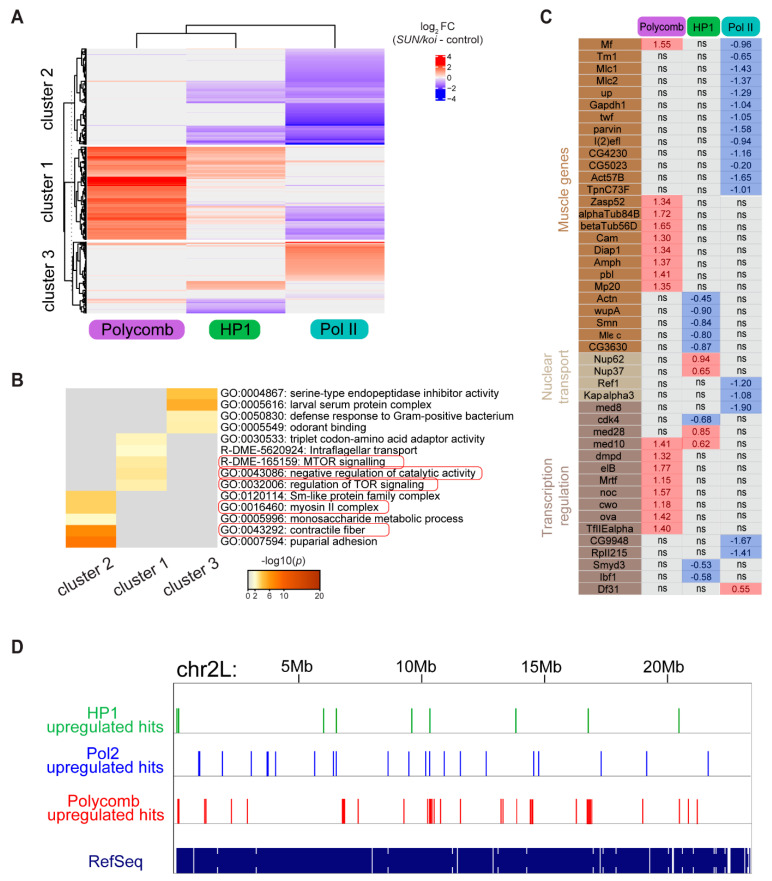
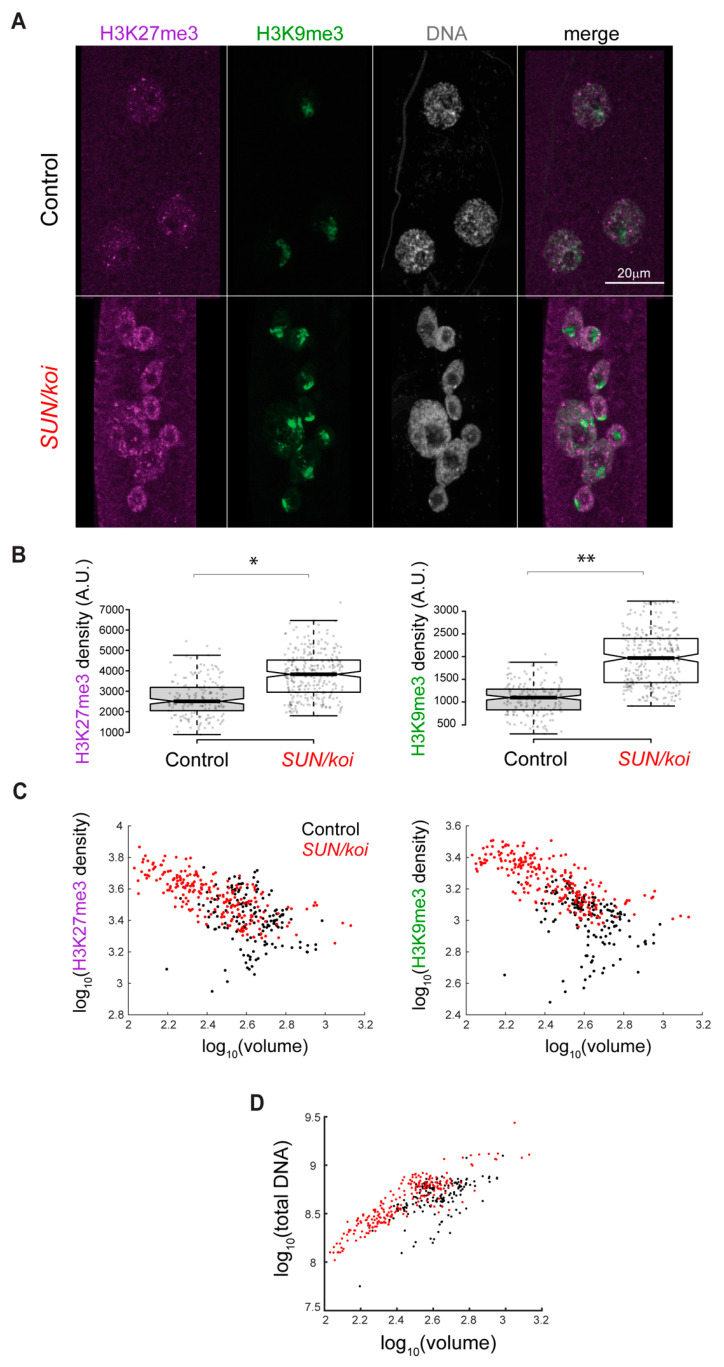
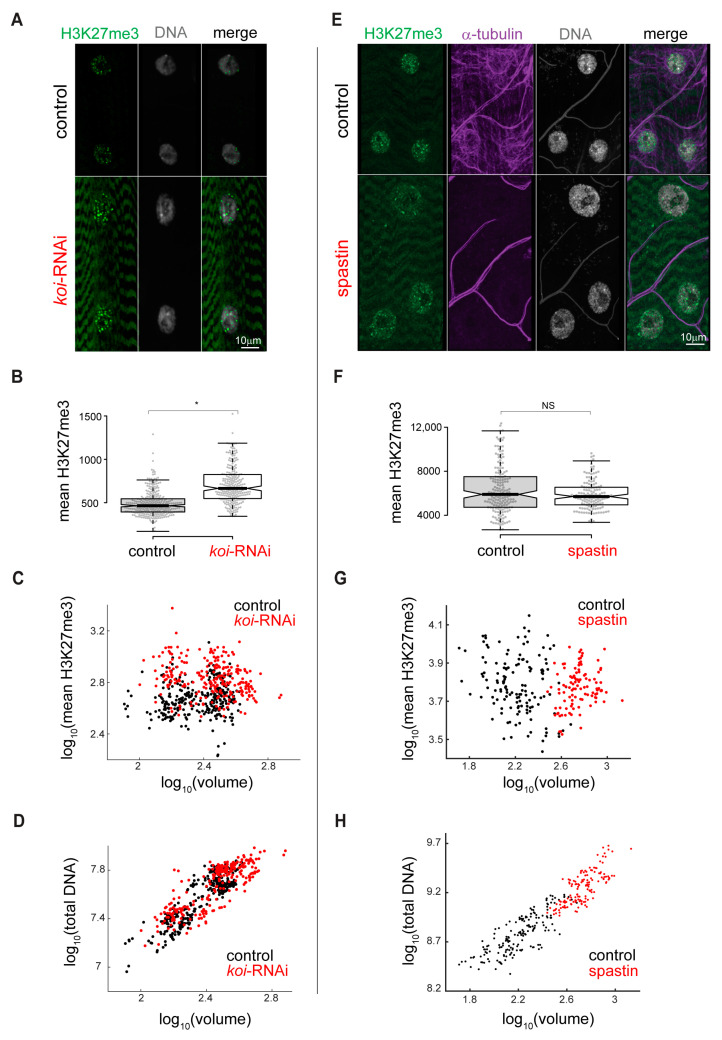
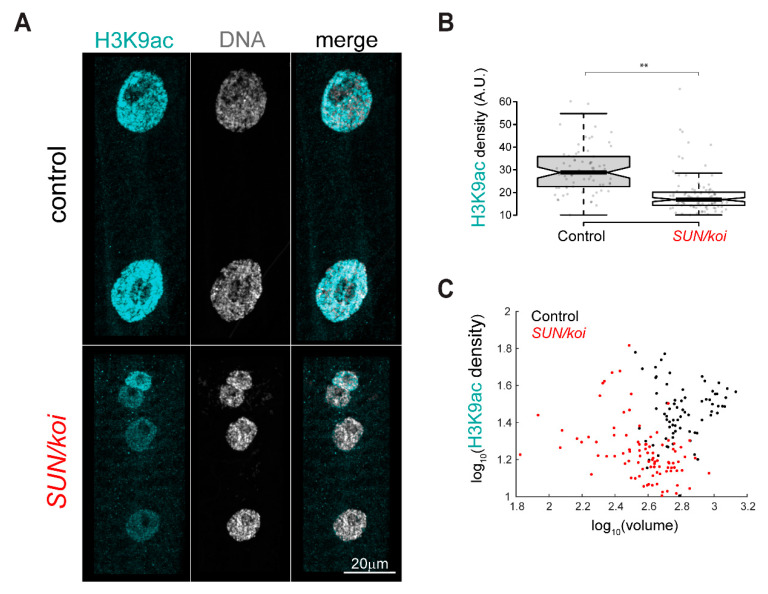
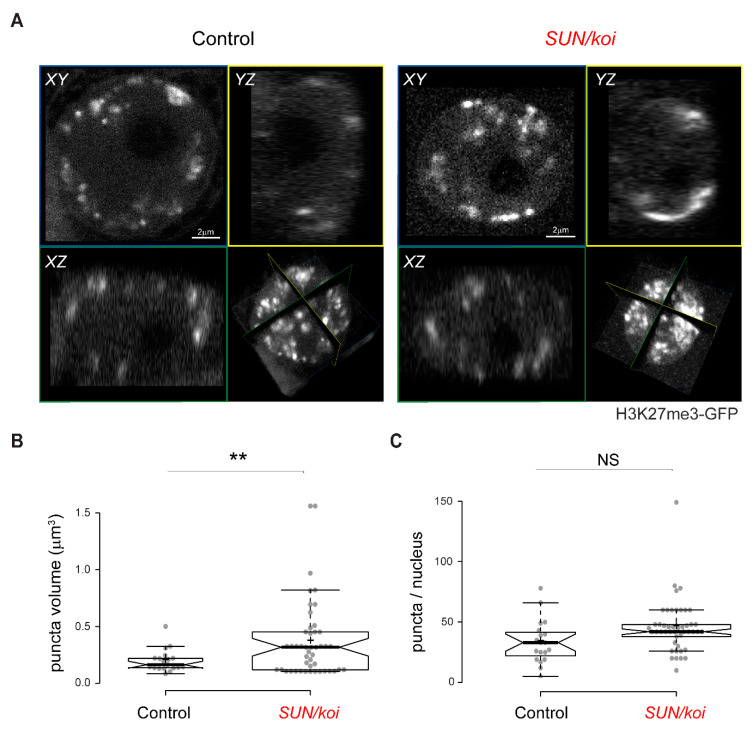
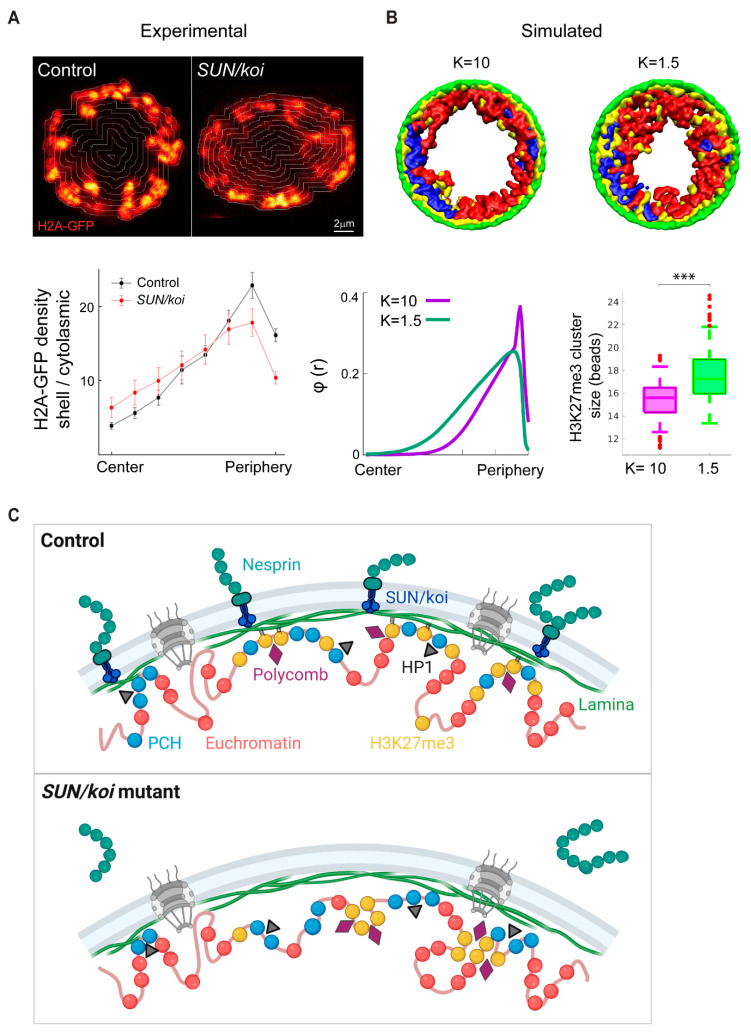
The Linker of Nucleoskeleton and Cytoskeleton (LINC) complex transduces nuclear mechanical inputs suggested to control chromatin organization and gene expression; however, the underlying mechanism is currently unclear. We show here that the LINC complex is needed to minimize chromatin repression in muscle tissue, where the nuclei are exposed to significant mechanical inputs during muscle contraction. To this end, the genomic binding profiles of Polycomb, Heterochromatin Protein1 (HP1a) repressors, and of RNA-Pol II were studied in Drosophila larval muscles lacking functional LINC complex. A significant increase in the binding of Polycomb and parallel reduction of RNA-Pol-II binding to a set of muscle genes was observed. Consistently, enhanced tri-methylated H3K9 and H3K27 repressive modifications and reduced chromatin activation by H3K9 acetylation were found. Furthermore, larger tri-methylated H3K27me3 repressive clusters, and chromatin redistribution from the nuclear periphery towards nuclear center, were detected in live LINC mutant larval muscles. Computer simulation indicated that the observed dissociation of the chromatin from the nuclear envelope promotes growth of tri-methylated H3K27 repressive clusters. Thus, we suggest that by promoting chromatin-nuclear envelope binding, the LINC complex restricts the size of repressive H3K27 tri-methylated clusters, thereby limiting the binding of Polycomb transcription repressor, directing robust transcription in muscle fibers.

Keywords: LINC complex; chromatin repression; epigenetics; muscle; nuclear mechanobiology.


Conflict of interest statement

The authors declare no conflict of interest.

Figures

Figure 1
Figure 1
Increased Polycomb and altered HP1a and RNA-Pol II occupancies in LINC mutated muscle fibers. (A) PCA regression on Dam-Polycomb (Cbx8, a component of the Prc1 subcomplex, (left)), Dam-HP1a (middle), Dam-Pol II (RpII215, the catalytic subunit of RNA-Pol II, (right)) gene occupancy, normalized to Dam alone, in control versus SUN/koi mutated muscle fibers. Gray dots represent genes with significantly altered binding profile when cut-off criteria are set to FDR < 0.05, Z-score > 1.96, GATC sites > 1. (B) Dam-Polycomb, Dam-HP1a, and Dam-Pol II, occupancy, normalized to Dam alone, for the alphaTub84B (left), Nup62 (middle), and Act57B (right) genes. Each gene presents a statistically significant altered occupancy in only one chromatin factor upon SUN/koi mutation (highlighted with red box) and the corresponding Zpca scores are listed for each gene.
Figure 2
Figure 2
Polycomb, HP1a and RNA-Pol II binding regulate distinct group of genes in the LINC mutated muscle fibers, with overall increased Polycomb repression and decreased RNA-Pol II activation. (A) The difference in SUN/koi and control fold change occupancy represented as heatmap for significantly altered genes in the Polycomb, HP1a, and RNA-Pol II groups. Non-significant genes are labeled in gray. K-means gene clustering predicts downregulated genes in Cluster 1 (increased Polycomb binding), and Cluster 2 (decreased RNA-Pol II binding), and heterogenous genes in cluster 3. (B) GO enrichment analysis (heatmap of p-values) on the three clusters of genes identified in (A). (C) The difference in SUN/koi and control fold change occupancy for specific genes of interest; ns is not significant. (D) Representative image of the distribution of the upregulated HP1a, RNA-Pol II and Polycomb hits on chromosome 2 L from DamID analysis, indicating increased clustering of Polycomb-upregulated genes along the genome.
Figure 3
Figure 3
Increased repressive H3K27me3 and H3K9me3 chromatin density, inversely correlated with nuclear volume, in SUN/koi mutated muscle fibers. (A) Muscle nuclei labeled with H3K27me3 (purple), H3K9me3 (green) and Hoechst for total DNA (gray). (B) Quantification of mean nuclear fluorescence intensity shows increased H3K27me3 and H3K9me3 in SUN/koi mutated muscle fibers. (C) Mean nuclear fluorescence intensity is plotted against the corresponding nuclear volume (log10 scale) for each epigenetic mark. Significant difference in the linear mixed model fit between the SUN/koi and control groups, for both repressive marks (p < 0.01). Similar analysis comparing only the larger nuclei (overlapping in SUN/koi and control groups) shows no significant difference between the fits, suggesting that mostly the smaller nuclei in the SUN/koi mutant contribute to the increased H3K27me3 and H3K9me3 repression. N = 5 larvae, n = 177 nuclei in control, N = 5 larvae, n = 295 nuclei in SUN/koi. For statistical significance * p < 0.05, ** p < 0.01. (D) Total DNA intensity plotted versus nuclear volume (log10 scale) for SUN/koi (red) and control (black). Linear mixed model analysis confirms significant difference between the SUN/koi and control fits (p < 0.01), with left-ward shift in the total DNA—nuclear volume relationship for the SUN/koi group. N = 5 larvae, n = 177 nuclei in control, N = 5 larvae, n = 295 nuclei in SUN/koi.
Figure 4
Figure 4
Increased H3K27me3 repression induced in temporal SUN/koi knockdown targeted to mature muscle fibers, but not in temporal disruption of the microtubule network. (A) Elevated H3K27me3 levels (green) and preserved DNA density (gray) in nuclei of mature muscle SUN/koi-RNAi. (B) Quantification of mean nuclear H3K27me3 intensity shows 45% increase in SUN/koi-RNAi group (p = 0.011, * statistically significant). (C) No correlation between mean nuclear H3K27me3 fluorescence intensity and the corresponding nuclear volume (log10 scale) in control (black) or SUN/koi-RNAi (red) groups (D) Preserved linear scaling between total DNA and nuclear volume (log10 scale) in SUN/koi-RNAi group. N = 5 larvae, n = 308 nuclei in control, N = 5 larvae, n = 250 nuclei in SUN/koi-RNAi. (E) Muscle nuclei of control and 1-day spastin overexpression demonstrate preserved H3K27me3 levels (green) upon MT network disruption (α-Tubulin label in purple), and preserved DNA density (gray), despite elevated nuclear volume. No change in mean H3K27me3 florescence intensity (NS=not statistically significant) (F) and its scaling with nuclear volume ((G), log10 scale) is maintained upon spastin overexpression. (H) Proportional increase in DNA intensity and nuclear volume (log10 scale) results in preserved global DNA density upon spastin over-expression. n = 5 larvae, n = 174 nuclei in control, N = 5 larvae, n = 140 nuclei in spastin.
Figure 5
Figure 5
Reduced active H3K9ac chromatin density in SUN/koi mutated muscle fibers, independent of nuclear volume. (A) Muscle nuclei labeled with H3K9ac (cyan) and Hoechst for total DNA (gray). (B) Quantification of mean nuclear fluorescence intensity shows decreased H3K9ac in SUN/koi mutated muscle fibers. (C) Mean nuclear H3K9ac intensity is plotted against the corresponding nuclear volume (log10 scale) and shows no significant correlation with nuclear volume between the control and SUN/koi groups (left). N = 5 larvae, n = 73 in control, N = 4 larvae, n = 103 nuclei in SUN/koi. ** p < 0.01.
Figure 6
Figure 6
Live 3D imaging of H3K27me3 mintbody distribution indicates increased spread of the repressive mark in SUN/koi mutant muscle nuclei. (A) Middle confocal planes of control (left) and SUN/koi (right) muscle nuclei show punctuated repressive regions throughout the nucleus. Increased mean puncta volume (B) and unchanged number of puncta per nucleus (C) in the SUN/koi mutant group. NS =not significant. N = 4 larvae, n = 19 nuclei in control, N = 4 larvae, n = 46 nuclei in SUN/koi (** p < 0.01).
Figure 7
Figure 7
Experimental and computational evidence for chromatin redistribution towards the center as the mechanism for increased repressive clustering in the LINC mutant. (A) Radial chromatin distribution analysis from live, 3D imaging. Middle confocal planes of control (left) and SUN/koi (right) muscle nuclei labeled with H2A-GFP. Mean chromatin density is quantified for the radial shells and demonstrate decreased peripheral chromatin density with a central shift in the SUN/koi mutants (red, N = 4 larvae, n = 11 nuclei) compared to control (black, N = 3 larvae, n = 10 nuclei). (B) Computational model to describe the Drosophila chromosomes with a flexible bead-spring polymer chain containing three distinct regions: euchromatin (red), pericentromeric heterochromatin (blue), and H3K27me3 modification (yellow). The polymers are confined by a spherical wall comprising immobile lamin beads (green). The yellow (H3K27me3) beads are attracted to the green (laminar) beads and their bonding strength is modeled by a dynamic, harmonic (spring-like) potential K. Simulation snapshots (XY plane view), and quantification of the radial chromatin bead density demonstrate that for strong bonding of the yellow (H3K27me3) and green (laminar) beads, K = 10, most of the yellow clusters are located near the lamina, while for weak bonding, K = 1.5, the yellow clusters, diffuse within the spherical volume, resulting in a central chromatin shift. Box plots show increased H3K27me3 bead cluster size in the nucleoplasm with decreased bonding strength K (p < 0.001; *** statistically significant). (C) Schematic model to represent the mechanism for LINC mediated inhibition of chromatin repression. SUN/koi mutation decreases repressive chromatin binding to the lamina, resulting in increased H3K27me3 clustering in the nucleoplasm and redistribution of chromatin inward from the periphery (created with BioRender.com).

Similar articles

Cited by

References

    1. Kirby T.J., Lammerding J. Emerging Views of the Nucleus as a Cellular Mechanosensor. Nat. Cell Biol. 2018;20:373–381. doi: 10.1038/s41556-018-0038-y. - DOI - PMC - PubMed
    1. Lityagina O., Dobreva G. The LINC Between Mechanical Forces and Chromatin. Front. Physiol. 2021;12:1242. doi: 10.3389/fphys.2021.710809. - DOI - PMC - PubMed
    1. Poulet A., Duc C., Voisin M., Desset S., Tutois S., Vanrobays E., Benoit M., Evans D.E., Probst A.V., Tatout C. The LINC Complex Contributes to Heterochromatin Organisation and Transcriptional Gene Silencing in Plants. J. Cell Sci. 2017;130:590–601. doi: 10.1242/jcs.194712. - DOI - PubMed
    1. Wagh K., Ishikawa M., Garcia D.A., Stavreva D.A., Upadhyaya A., Hager G.L. Mechanical Regulation of Transcription: Recent Advances. Trends Cell Biol. 2021;31:457–472. doi: 10.1016/j.tcb.2021.02.008. - DOI - PMC - PubMed
    1. Chang W., Worman H.J., Gundersen G.G. Accessorizing and Anchoring the LINC Complex for Multifunctionality. J. Cell Biol. 2015;208:11–22. doi: 10.1083/jcb.201409047. - DOI - PMC - PubMed

Publication types

MeSH terms

Grants and funding

This research was supported by grants from “The French Muscular Dystrophy Association (AFM-Téléthon)” grant # 22339, and grant # 24142, and Israel Science Foundation (ISF) grant # 750/17. S. Safran is grateful for the support of the Volkswagen Foundation and the Perlman Family Foundation.

LinkOut - more resources