. 2023 Mar 2;12(3):620.
doi: 10.3390/antiox12030620.

Hyperoxia Disrupts Lung Lymphatic Homeostasis in Neonatal Mice

Affiliations

Hyperoxia Disrupts Lung Lymphatic Homeostasis in Neonatal Mice

Nithyapriya Shankar et al. Antioxidants (Basel). .

Abstract

Inflammation causes bronchopulmonary dysplasia (BPD), a common lung disease of preterm infants. One reason this disease lacks specific therapies is the paucity of information on the mechanisms regulating inflammation in developing lungs. We address this gap by characterizing the lymphatic phenotype in an experimental BPD model because lymphatics are major regulators of immune homeostasis. We hypothesized that hyperoxia (HO), a major risk factor for experimental and human BPD, disrupts lymphatic endothelial homeostasis using neonatal mice and human dermal lymphatic endothelial cells (HDLECs). Exposure to 70% O2 for 24-72 h decreased the expression of prospero homeobox 1 (Prox1) and vascular endothelial growth factor c (Vegf-c) and increased the expression of heme oxygenase 1 and NAD(P)H dehydrogenase [quinone]1 in HDLECs, and reduced their tubule formation ability. Next, we determined Prox1 and Vegf-c mRNA levels on postnatal days (P) 7 and 14 in neonatal murine lungs. The mRNA levels of these genes increased from P7 to P14, and 70% O2 exposure for 14 d (HO) attenuated this physiological increase in pro-lymphatic factors. Further, HO exposure decreased VEGFR3+ and podoplanin+ lymphatic vessel density and lymphatic function in neonatal murine lungs. Collectively, our results validate the hypothesis that HO disrupts lymphatic endothelial homeostasis.

Keywords: bronchopulmonary dysplasia; human dermal lymphatic endothelial cells; hyperoxia; lymphangiogenesis; lymphatic function.


Conflict of interest statement

The authors declare no conflict of interest.

Figures
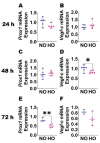
Figure 1
Figure 1
Effects of HO exposure on the expression of lymphangiogenic molecules in HDLECs. RNA was extracted at the indicated time points from cells grown on six-well plates to 60–70% confluence and exposed to NO (21% O2 and 5% CO2) or HO (70% O2 and 5% CO2) for up to 72 h. The RNA was later transcribed to cDNA and subjected to real-time RT-PCR analysis to quantify the mRNA levels of Prox1 (A,C,E) and Vegf-c (B,D,F) at 24 h (A,B), 48 h (C,D), and 72 h (E,F). Values represent the median with range (n = 3–6/group). Significant differences between exposures are indicated by *, p < 0.05, **, p < 0.01 (t-test).
Figure 2
Figure 2
Effects of HO exposure on HDLEC tubule formation. Tubule formation assay was performed at the indicated time points on cells grown on six-well plates to 60% confluence and exposed to NO (21% O2 and 5% CO2) or HO (70% O2 and 5% CO2) for up to 72 h. (A, B, D, E, G and H). Representative photographs showing tubule formation of NO (A,D,G) and HO (B,E,H) exposed cells at 24 h (A,B), 48 h (D,E), and 72 h (G,H). Scale bar = 100 µm. C, F, and I. Quantification of tubule number at 24 h (C), 48 h (F), and 72 h (I). Values are presented as the median with the range (n = 4–5/group). Significant differences between exposures are indicated by *, p < 0.05, **, p < 0.01 (t-test).
Figure 3
Figure 3
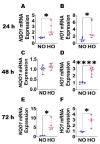
Effects of HO exposure on the expression of antioxidant enzymes in HDLECs. RNA was extracted at the indicated time points from cells grown on six-well plates to 60–70% confluence and exposed to NO (21% O2 and 5% CO2) or HO (70% O2 and 5% CO2) for up to 72 h. The RNA was later transcribed to cDNA and subjected to real-time RT-PCR analysis to quantify the mRNA levels of NQO1 (A,C,E) and HO1 (B,D,F) at 24 h (A,B), 48 h (C,D), and 72 h (E,F). Values represent the median with range (n = 3–6/group). Significant differences between exposures are indicated by *, p < 0.05, ****, p < 0.0001 (t-test).
Figure 4
Figure 4
Expression of lymphangiogenic molecules in HO-exposed neonatal murine lungs. Gene expression studies were carried out by RT-PCR analyses on whole lung RNA isolates from WT mice exposed to NO (21% O2) or HO (70% O2) for 7 and 14 d. (AB): the quantification of Prox1 (A) and Vegf-c (B) mRNA levels. Values are presented as the median with the range (n = 3/group). Significant differences between exposures are indicated by *, p < 0.05, **, p < 0.01, and ***, p < 0.001 (ANOVA).
Figure 5
Figure 5
Lung VEGFR3+ lymphatic density in neonatal mice exposed to HO. The lung lymphatic density was determined by quantifying VEGFR3+ lung vessels (arrows) on P14 in WT mice exposed to 21% O2 (NO) or 70% O2 (HO) from P1 to P14. (AB). Representative VEGFR3+ (red), αSMA (green), and DAPI (blue) immunofluorescence-stained lung sections from mice exposed to NO (A) and HO (B) for 14 d. (C). Representative lung section from NO exposed animals stained with secondary antibodies only (negative control). Scale bar = 100 µm. (D). Quantification of VEGFR3+ lung vessels. Values are presented as the median with the range (n = 4/group). Significant differences between exposures are indicated by **, p < 0.01 (t-test).
Figure 6
Figure 6
Lung PDPN+ lymphatic density in neonatal mice exposed to HO. The lung lymphatic density was determined by quantifying PDPN+ lung vessels (arrows) on P14 in WT mice exposed to 21% O2 (NO) or 70% O2 (HO) from P1 to P14. (AB). Representative PDPN+ (green) and DAPI (blue) immunofluorescence-stained lung vessels from mice exposed to NO (A) and HO (B) for 14 d. (C). Representative lung section from NO exposed animals stained with secondary antibody only (negative control). Scale bar = 100 µm. (D). The quantification of PDPN+ lung vessels. Values are presented as the median with the range (n = 4/group). Significant differences between exposures are indicated by **, p < 0.01 (t-test).
Figure 7
Figure 7
Lung PDPN+ lymphatic density in neonatal mice exposed to HO. The lung lymphatic density was determined by quantifying PDPN+ lung vessels (arrows) on P7 in WT mice exposed to 21% O2 (NO) or 70% O2 (HO) from P1 to P7. (AB). Representative PDPN+ (green) and DAPI (blue) immunofluorescence-stained lung vessels from mice exposed to NO (A) and HO (B) for 7 d. (C). Representative lung section from NO exposed animals stained with secondary antibody only (negative control). Scale bar = 100 µm. (D). Quantification of PDPN+ lung vessels. Values are presented as the median with the range (n = 3/group). Significant differences between exposures are indicated by *, p < 0.05 (t-test).
Figure 8
Figure 8
Pulmonary lymphatic flow in HO-exposed mice. The pulmonary lymphatic flow was determined by quantifying the mediastinal lymph node (mLN) uptake of dextran-568 on P21 in WT mice exposed to 21% O2 (NO) or 70% O2 (HO) from P1 to P14. (AB). Representative fluorescence microscopic images of mLNs from mice exposed to NO (A) and HO (B) 50 min after intra-tracheal administration of dextran-568 (red). (C). Quantitative analysis of mLN fluorescence intensity. Values are presented as the median with the range (n = 4–7/group). Significant differences between exposures are indicated by **, p < 0.01 (t-test).

Similar articles

Cited by

References

    1. Jobe A.H. Animal Models, Learning Lessons to Prevent and Treat Neonatal Chronic Lung Disease. Front. Med. 2015;2:49. doi: 10.3389/fmed.2015.00049. - DOI - PMC - PubMed
    1. Husain A.N., Siddiqui N.H., Stocker J.T. Pathology of arrested acinar development in postsurfactant bronchopulmonary dysplasia. Hum. Pathol. 1998;29:710–717. doi: 10.1016/S0046-8177(98)90280-5. - DOI - PubMed
    1. Coalson J.J. Pathology of new bronchopulmonary dysplasia. Semin. Neonatol. SN. 2003;8:73–81. doi: 10.1016/S1084-2756(02)00193-8. - DOI - PubMed
    1. Thébaud B., Goss K.N., Laughon M., Whitsett J.A., Abman S.H., Steinhorn R.H., Aschner J.L., Davis P.G., McGrath-Morrow S.A., Soll R.F., et al. Bronchopulmonary dysplasia. Nat. Rev. Dis. Prim. 2019;5:78. doi: 10.1038/s41572-019-0127-7. - DOI - PMC - PubMed
    1. Lapcharoensap W., Bennett M.V., Xu X., Lee H.C., Dukhovny D. Hospitalization costs associated with bronchopulmonary dysplasia in the first year of life. J. Perinatol. Off. J. Calif. Perinat. Assoc. 2019;40:130–137. doi: 10.1038/s41372-019-0548-x. - DOI - PMC - PubMed