. 2023 Feb 21;14(3):213.
doi: 10.3390/insects14030213.

Current and Future Habitat Suitability Models for Four Ticks of Medical Concern in Illinois, USA

Affiliations

Current and Future Habitat Suitability Models for Four Ticks of Medical Concern in Illinois, USA

Heather L Kopsco et al. Insects. .

Abstract

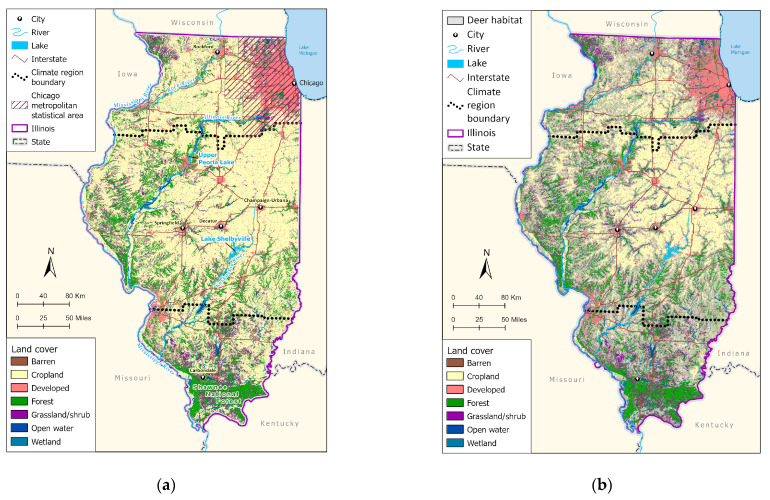
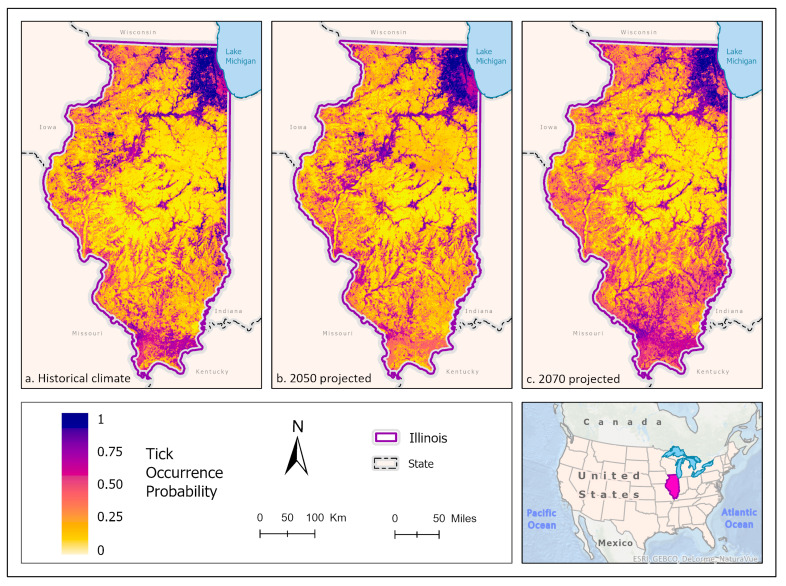
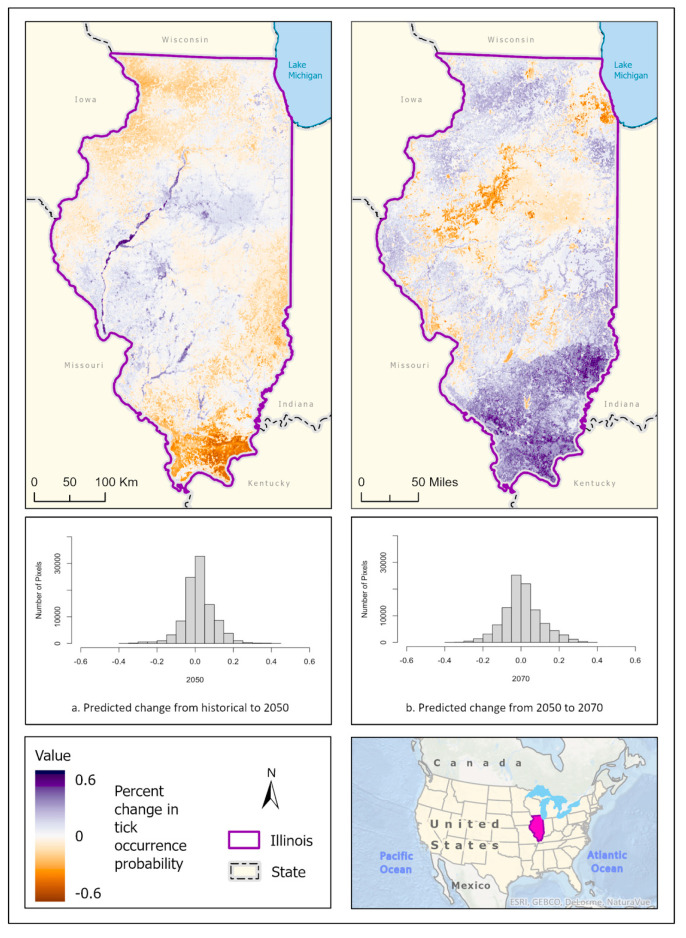
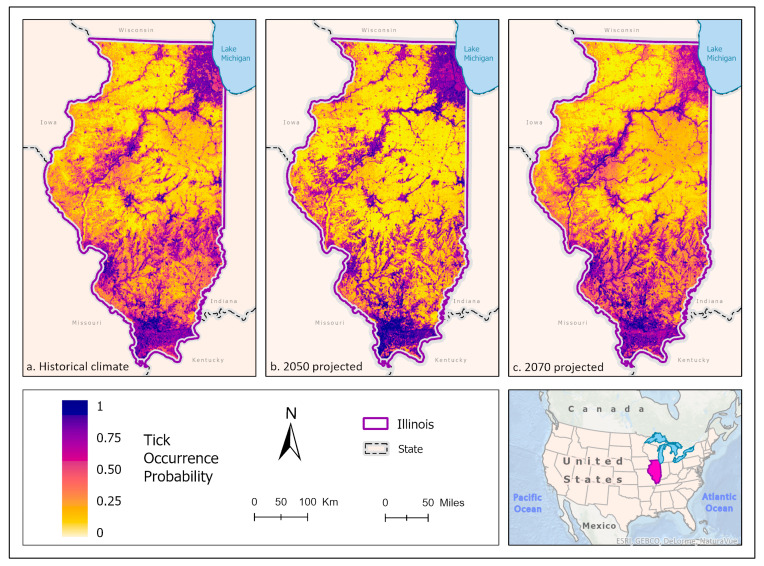
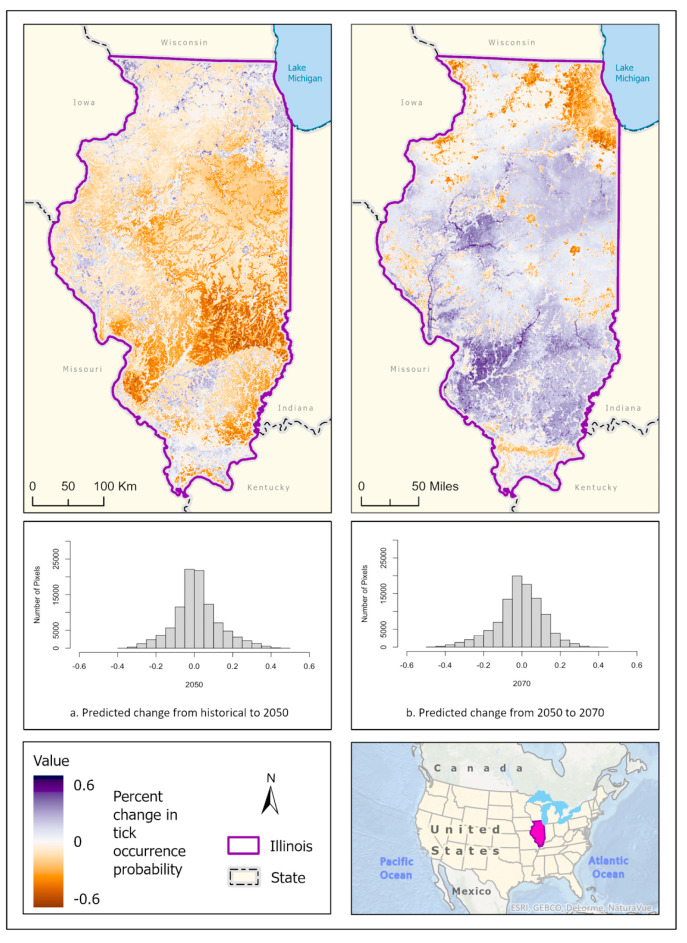
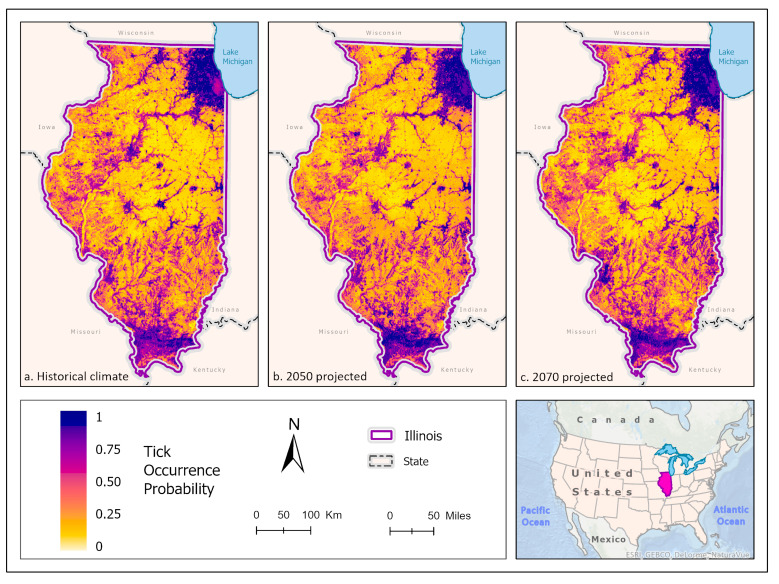
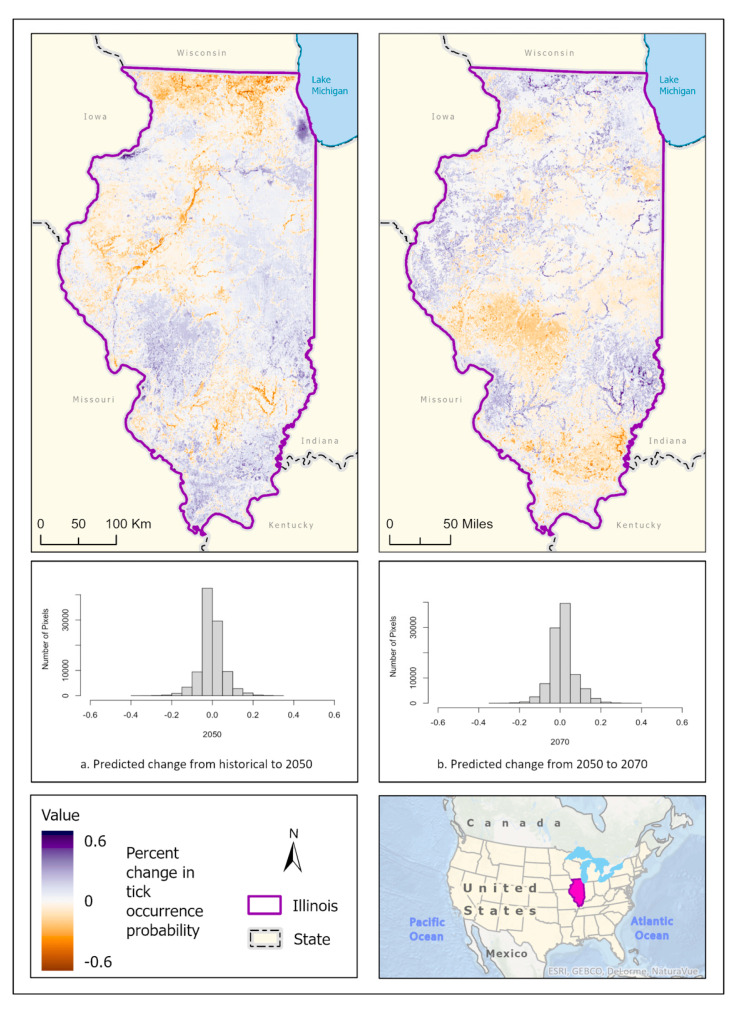
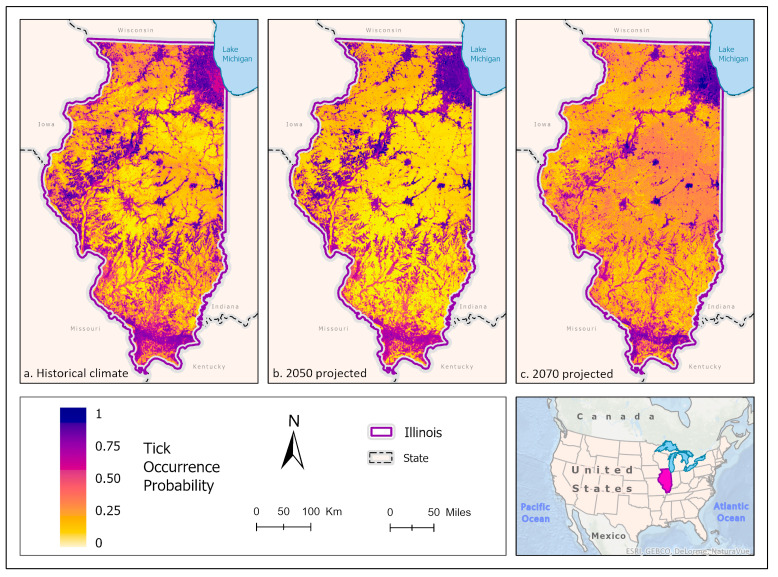
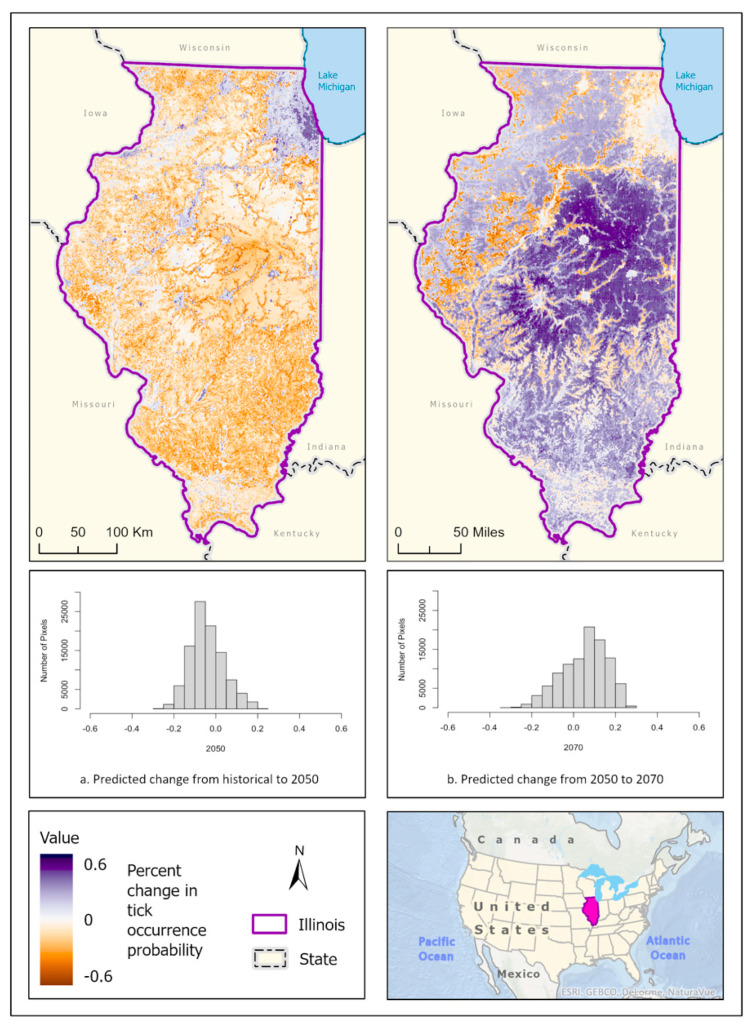
The greater U.S. Midwest is on the leading edge of tick and tick-borne disease (TBD) expansion, with tick and TBD encroachment into Illinois occurring from both the northern and the southern regions. To assess the historical and future habitat suitability of four ticks of medical concern within the state, we fit individual and mean-weighted ensemble species distribution models for Ixodes scapularis, Amblyomma americanum, Dermacentor variabilis, and a newly invading species, Amblyomma maculatum using a variety of landscape and mean climate variables for the periods of 1970-2000, 2041-2060, and 2061-2080. Ensemble model projections for the historical climate were consistent with known distributions of each species but predicted the habitat suitability of A. maculatum to be much greater throughout Illinois than what known distributions demonstrate. The presence of forests and wetlands were the most important landcover classes predicting the occurrence of all tick species. As the climate warmed, the expected distribution of all species became strongly responsive to precipitation and temperature variables, particularly precipitation of the warmest quarter and mean diurnal range, as well as proximity to forest cover and water sources. The suitable habitat for I. scapularis, A. americanum, and A. maculatum was predicted to significantly narrow in the 2050 climate scenario and then increase more broadly statewide in the 2070 scenario but at reduced likelihoods. Predicting where ticks may invade and concentrate as the climate changes will be important to anticipate, prevent, and treat TBD in Illinois.

Keywords: Illinois; climate; habitat suitability models; species distribution models; ticks.


Conflict of interest statement

The authors declare no conflict of interest.

Figures

Figure 1
Figure 1
(a) National Land Cover Database [54] aggregated landcover classes for Illinois. Climate region boundaries are derived from the National Oceanic and Atmospheric Administration U.S. Climate Divisional Dataset [39]. (b) NLCD aggregated land cover with white-tailed deer habitat overlay [53].
Figure 2
Figure 2
(a) Mean-weighted ensemble prediction of the probability of I. scapularis occurrence in Illinois under historical climate conditions. (b) Mean-weighted ensemble of predicted probability of I. scapularis occurrence in Illinois in 2050 projected climate Coupled Model Intercomparison Project phase 6 (CMIP6)/ EC-Earth3-Veg Shared Socioeconomic Pathway (SSP) 585 (average from 2041 to 2060). (c) Mean-weighted ensemble of future predicted probability of I. scapularis occurrence in Illinois in 2070 projected climate (CMIP6)/ EC-Earth3-Veg Shared Socioeconomic Pathway (SSP) 585 average from 2061 to 2080). Darker colors indicate a higher likelihood of tick presence, per the tick occurrence probability scale. Inset map indicates the location of Illinois within the United States/North America.
Figure 3
Figure 3
Percent change in the likelihood of I. scapularis occurrence between the historical climate and 2050 (left) and from 2050 to 2070 (right). Red shades indicate a reduced likelihood of occurrence (negative change), and blue shades indicate an increased likelihood of occurrence (positive change). The histograms represent the number of pixels (y−axis) containing the binned percentage likelihood change (x−axis) of I. scapularis suitable habitat across the map. Inset map indicates the location of Illinois within the United States/North America.
Figure 4
Figure 4
(a) Mean-weighted ensemble prediction of the probability of A. americanum occurrence in Illinois under historical climate conditions. (b) Mean-weighted ensemble of predicted probability of A. americanum occurrence in Illinois in 2050 projected climate Coupled Model Intercomparison Project phase 6 (CMIP6)/EC-Earth3-Veg Shared Socioeconomic Pathway (SSP) 585 (average from 2041 to 2060). (c) Mean-weighted ensemble of future predicted probability of A. americanum occurrence in Illinois in the 2070 projected climate (CMIP6)/EC-Earth3-Veg Shared Socioeconomic Pathway (SSP) 585 (average from 2061 to 2080). Darker colors indicate a higher likelihood of tick presence per the tick occurrence probability scale. Inset map indicates the location of Illinois within the United States/North America.
Figure 5
Figure 5
Percent change in the likelihood of A. americanum occurrence between the historical climate and 2050 (left) and from 2050 to 2070 (right). Red shades indicate a reduced likelihood of occurrence (negative change), and blue shades indicate an increased likelihood of occurrence (positive change). The histograms represent the number of pixels (y−axis) containing the binned percentage likelihood change (x−axis) of A. americanum suitable habitat across the map. Inset map indicates the location of Illinois within the United States/North America.
Figure 6
Figure 6
(a) Mean-weighted ensemble prediction of the probability of D. variabilis occurrence in Illinois under historical climate conditions. (b) Mean-weighted ensemble of predicted probability of D. variabilis occurrence in Illinois in 2050 projected climate Coupled Model Intercomparison Project phase 6 (CMIP6)/EC-Earth3-Veg Shared Socioeconomic Pathway (SSP) 585 (average from 2041 to 2060). (c) Mean-weighted ensemble of future predicted probability of D. variabilis occurrence in Illinois in 2070 projected climate (CMIP6)/EC-Earth3-Veg Shared Socioeconomic Pathway (SSP) 585 (average from 2061 to 2080). Darker colors indicate a higher likelihood of tick presence, per the tick occurrence probability scale. Inset map indicates the location of Illinois within the United States/North America.
Figure 7
Figure 7
Percent change in the likelihood of D. variabilis occurrence between the historical climate and 2050 (left) and from 2050 to 2070 (right). Red shades indicate a reduced likelihood of occurrence (negative change), and blue shades indicate an increased likelihood of occurrence (positive change). The histograms represent the number of pixels (y−axis) containing the binned percentage likelihood (x−axis) of D. variabilis suitable habitat across the map. Inset map indicates the location of Illinois within the United States/North America.
Figure 8
Figure 8
(a) Mean-weighted ensemble prediction of the probability of A. maculatum occurrence in Illinois under historical climate conditions. (b) Mean-weighted ensemble of predicted probability of A. maculatum occurrence in Illinois in 2050 projected climate Coupled Model Intercomparison Project phase 6 (CMIP6)/EC-Earth3-Veg Shared Socioeconomic Pathway (SSP) 585 (average from 2041 to 2060). (c) Mean-weighted ensemble of future predicted probability of A. maculatum occurrence in Illinois in 2070 projected climate (CMIP6)/EC-Earth3-Veg Shared Socioeconomic Pathway (SSP) 585 (average from 2061 to 2080). Darker colors indicate a higher likelihood of tick presence per the tick occurrence probability scale. Inset map indicates the location of Illinois within the United States/North America.
Figure 9
Figure 9
Percent change in the likelihood of A. maculatum occurrence between the historical climate and 2050 (left) and from 2050 to 2070 (right). Red shades indicate a reduced likelihood of occurrence (negative change), and blue shades indicate an increased likelihood of occurrence (positive change). The histograms represent the number of pixels (y−axis) containing the binned percentage likelihood (x−axis) of A. maculatum suitable habitat across the map. Inset map indicates the location of Illinois within the United States/North America.

Similar articles

Cited by

References

    1. Diuk-Wasser M.A., VanAcker M.C., Fernandez M.P. Impact of Land Use Changes and Habitat Fragmentation on the Eco-Epidemiology of Tick-Borne Diseases. J. Med. Entomol. 2021;58:1546–1564. doi: 10.1093/jme/tjaa209. - DOI - PubMed
    1. Savage H.M., Burkhalter K.L., Godsey M.S., Jr., Panella N.A., Ashley D.C., Nicholson W.L., Lambert A.J. Bourbon Virus in Field-Collected Ticks, Missouri, USA. Emerg. Infect. Dis. 2017;23:2017–2022. doi: 10.3201/eid2312.170532. - DOI - PMC - PubMed
    1. Paddock C.D., Goddard J. The Evolving Medical and Veterinary Importance of the Gulf Coast Tick (Acari: Ixodidae) J. Med. Entomol. 2015;52:230–252. doi: 10.1093/jme/tju022. - DOI - PubMed
    1. Raghavan R.K., Koestel Z.L., Boorgula G., Hroobi A., Ganta R., Harrington J., Jr., Goodin D., Stich R.W., Anderson G. Unexpected Winter Questing Activity of Ticks in the Central Midwestern United States. PLoS ONE. 2021;16:e0259769. doi: 10.1371/journal.pone.0259769. - DOI - PMC - PubMed
    1. Molaei G., Eisen L.M., Price K.J., Eisen R.J. Range Expansion of Native and Invasive Ticks, a Looming Public Health Threat. J. Infect. Dis. 2022;226:370–373. doi: 10.1093/infdis/jiac249. - DOI - PMC - PubMed