. 2023 May;299(5):104650.
doi: 10.1016/j.jbc.2023.104650. Epub 2023 Mar 25.

Laminin switches terminal differentiation fate of human trophoblast stem cells under chemically defined culture conditions

Affiliations

Laminin switches terminal differentiation fate of human trophoblast stem cells under chemically defined culture conditions

Victoria Karakis et al. J Biol Chem. 2023 May.

Abstract

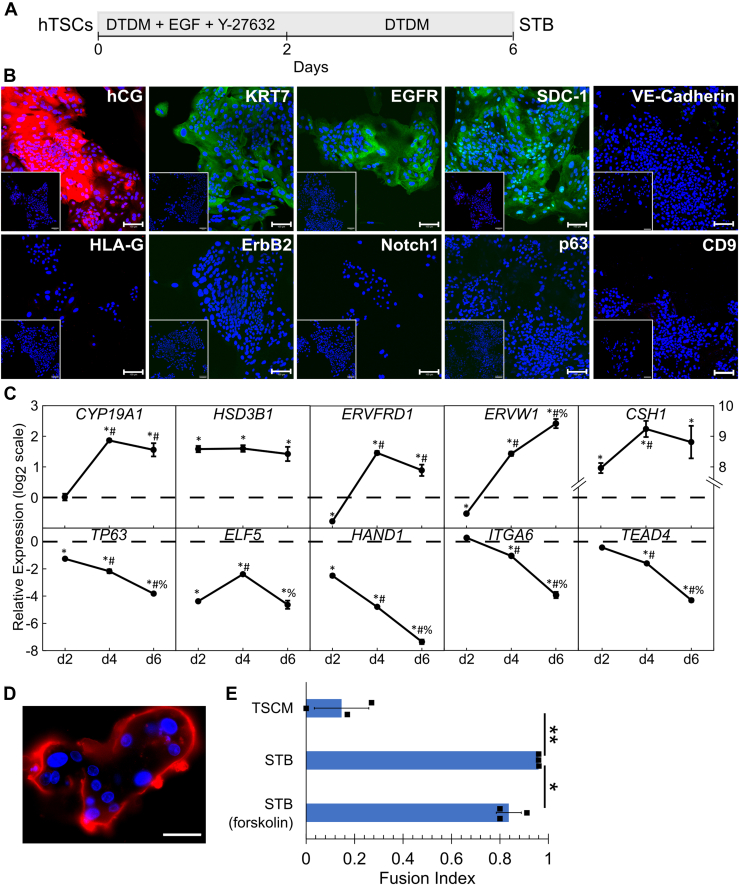
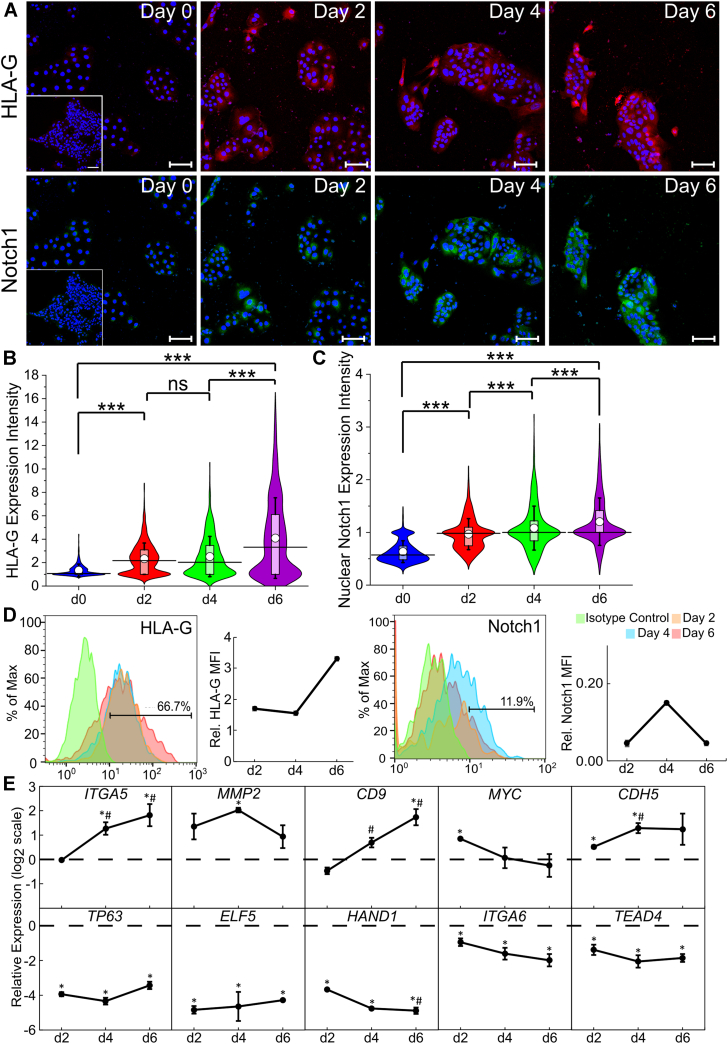
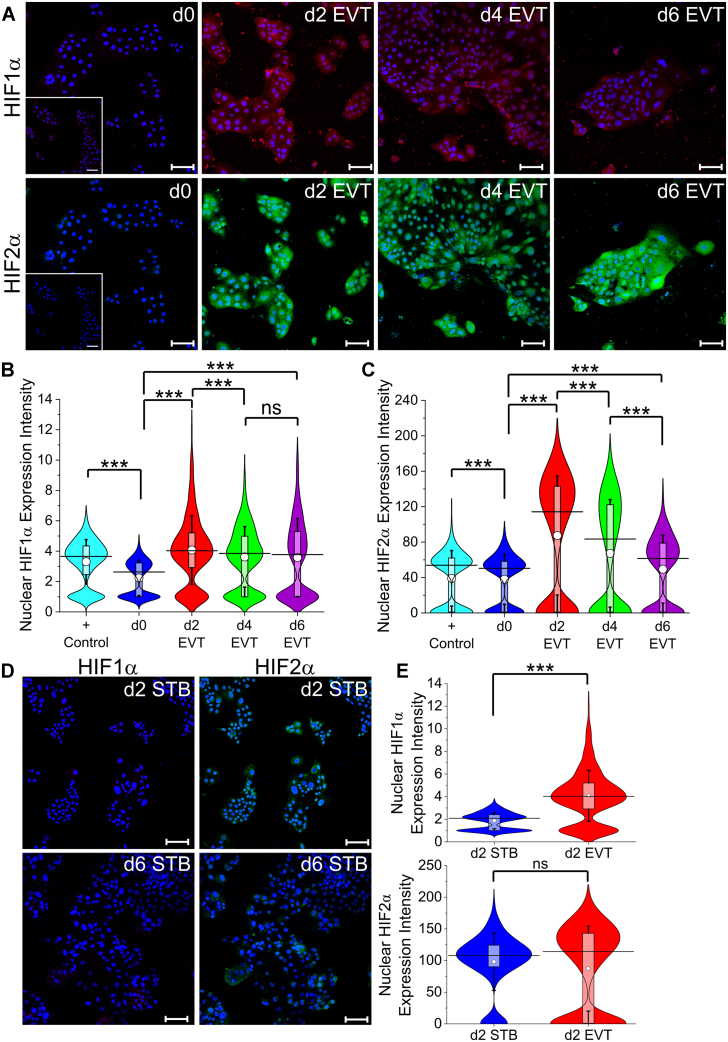
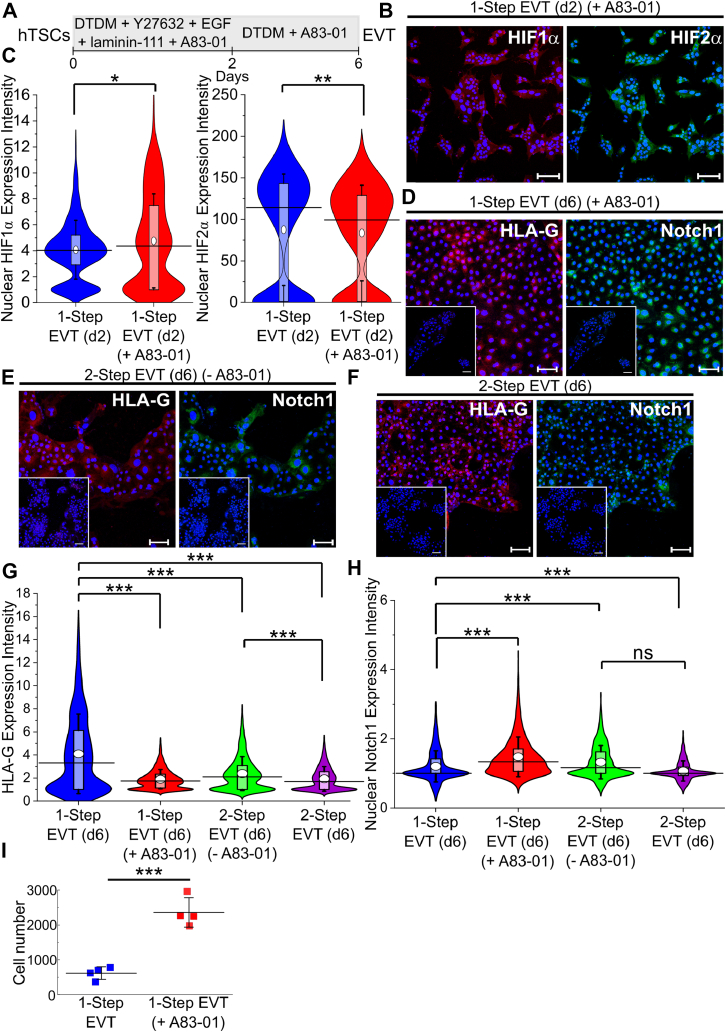
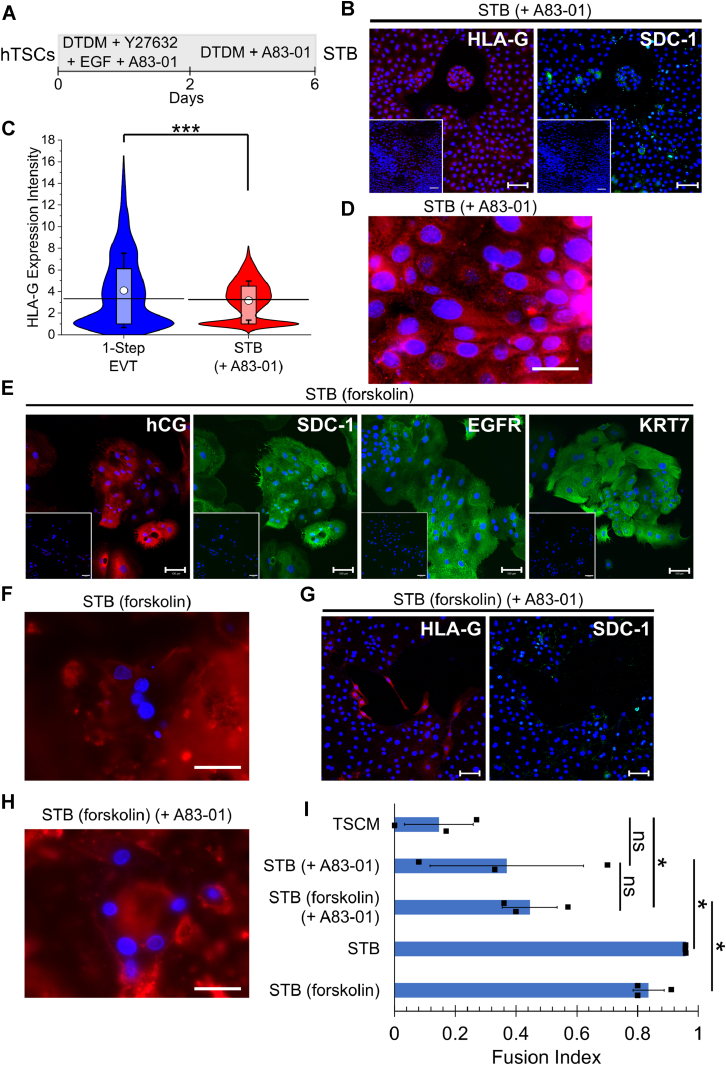
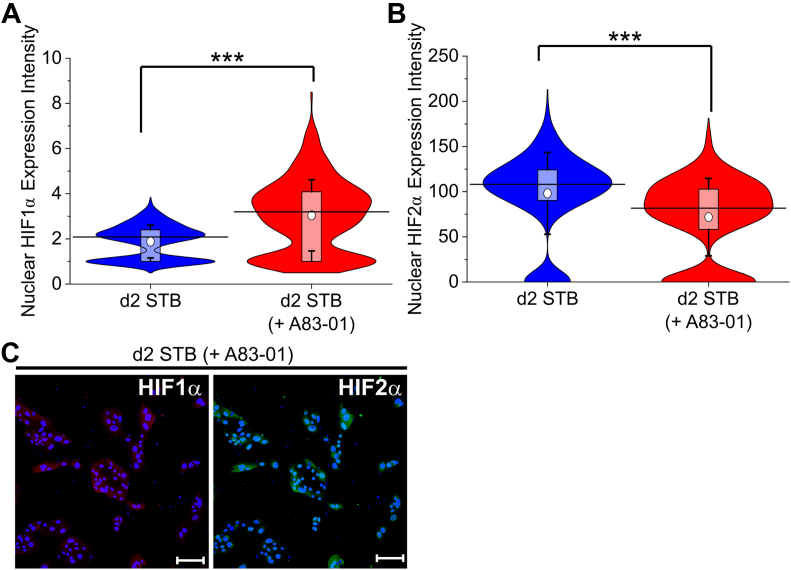
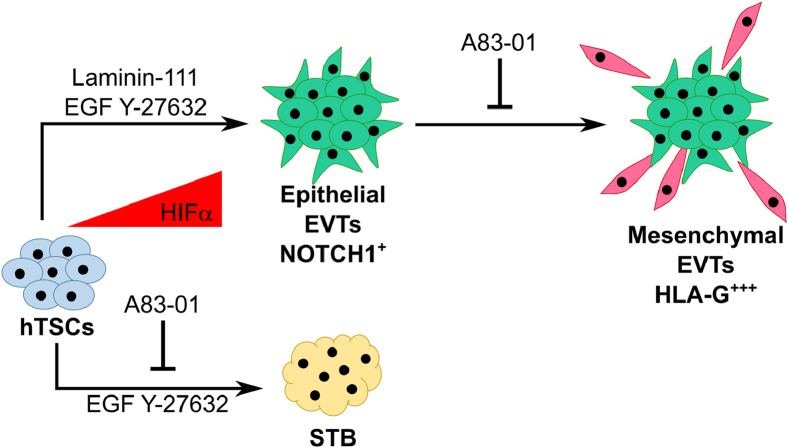
Human trophoblast stem cells (hTSCs) have emerged as a powerful tool to model early placental development in vitro. Analogous to the epithelial cytotrophoblast in the placenta, hTSCs can differentiate into cells of the extravillous trophoblast (EVT) lineage or the multinucleate syncytiotrophoblast (STB). Here we present a chemically defined culture system for STB and EVT differentiation of hTSCs. Notably, in contrast to current approaches, we neither utilize forskolin for STB formation nor transforming growth factor-beta (TGFβ) inhibitors or a passage step for EVT differentiation. Strikingly, the presence of a single additional extracellular cue-laminin-111-switched the terminal differentiation of hTSCs from STB to the EVT lineage under these conditions. In the absence of laminin-111, STB formation occurred, with cell fusion comparable to that obtained with differentiation mediated by forskolin; however, in the presence of laminin-111, hTSCs differentiated to the EVT lineage. Protein expression of nuclear hypoxia-inducible factors (HIF1α and HIF2α) was upregulated during EVT differentiation mediated by laminin-111 exposure. A heterogeneous mixture of Notch1+ EVTs in colonies and HLA-G+ single-cell EVTs were obtained without a passage step, reminiscent of heterogeneity in vivo. Further analysis showed that inhibition of TGFβ signaling affected both STB and EVT differentiation mediated by laminin-111 exposure. TGFβ inhibition during EVT differentiation resulted in decreased HLA-G expression and increased Notch1 expression. On the other hand, TGFβ inhibition prevented STB formation. The chemically defined culture system for hTSC differentiation established herein facilitates quantitative analysis of heterogeneity that arises during hTSC differentiation and will enable mechanistic studies in vitro.

Keywords: differentiation; extravillous trophoblast; placenta; syncytiotrophoblast; trophoblast; trophoblast stem cells.


Conflict of interest statement

Conflict of interest The authors declare that they have no conflicts of interest with the contents of this article.

Figures

Figure 1
Figure 1
Chemically defined conditions for STB differentiation in the absence of forskolin.A, schematic of protocol for hTSC differentiation to STB. B, confocal images of CT30 hTSCs on day 6 of STB differentiation, staining for hCG, KRT7, EGFR, SDC-1, VE-Cadherin, HLA-G, ErbB2, Notch1, p63, and CD9. Nuclei were stained with DAPI. Inset is the respective isotype control. C, gene expression of CYP19A1, HSD3B1, ERVFRD1, ERVW1, CSH1, TP63, ELF5, HAND1, ITGA6, and TEAD4 of CT30 hTSCs on day 2, day 4, and day 6 of STB differentiation compared to undifferentiated hTSCs (dashed line). Three biological replicates were used (Error bars, S.E., ∗p < 0.05 for comparison with undifferentiated hTSCs, #p < 0.05 for comparison with cells at day 2, %p < 0.05 for comparison with cells at day 4). D, fluorescent image of CT30 hTSCs on day 6 of STB differentiation. Nuclei were stained with DAPI. Membrane was stained with Di-8-ANEPPS cell membrane stain. The scale bar represents 50 μm. E, fusion efficiency of CT30 hTSCs on day 6 of STB differentiation using the method described in Panel A and the method using forskolin as previously described (32) compared to CT30 hTSCs cultured in TSCM. Fusion index is calculated as (N-S)/T where N is the number of nuclei in the syncytia, S is the number of syncytia, and T is the total number of nuclei counted. Nuclei were stained with DAPI. Membrane was stained with Di-8-ANEPPS cell membrane stain. Three measurements from two biological replicates were used to calculate fusion index (∗p < 0.05, ∗∗p < 0.005, Error bars, S.D., n = 3). The scale bars represent 100 μm for all images unless specified otherwise. hTSC, human trophoblast stem cell; STB, syncytiotrophoblast; TSCM, trophoblast stem cell medium.
Figure 2
Figure 2
Presence of laminin-111 switches hTSC differentiation from STB to EVT fate.A, schematic of protocol for hTSC differentiation to EVT. B, confocal images of CT30 hTSCs on day 6 of EVT differentiation, staining for HLA-G and Notch1. Nuclei were stained with DAPI. Inset is the respective isotype control. Outcrop is the magnified image. C, confocal images of CT30 hTSCs on day 6 of EVT differentiation, staining for VE-cadherin, CD9, ErbB2, KRT7, EGFR, p63, hCG, and SDC-1. Nuclei were stained with DAPI. Inset is the respective isotype control. D, quantitative analysis of Notch1 expression intensity of CT30 hTSCs on day 6 of EVT differentiation from the bottom (HLA-G+) and top (HLA-G++++) 25% of HLA-G expression intensity cells (n = 534, each). Analysis was performed in MATLAB and 2 biological replicates were used. The white circle represents the mean and the black bar represents the median (∗∗p < 0.005). E, quantitative analysis of HLA-G expression intensity of CT30 hTSCs on day 6 of EVT differentiation grouped into two categories: cells with no neighboring cells within a radius of 50 μm (n = 248) labeled as d6 single cells or cells with at least one or more neighboring cells within a 50 μm radius (n = 1061) labeled as d6 colonies. Analysis was performed in MATLAB and two biological replicates were used. The white circle represents the mean and the black bar represents the median (∗∗∗p < 0.0005). F, quantitative analysis of Notch1 expression intensity of CT30 hTSCs on day 6 of EVT differentiation grouped into two categories: cells with no neighboring cells within a radius of 50 μm (n = 300) labeled as d6 single cells or cells with at least one or more neighboring cells within a 50 μm radius (n = 1428) labeled as d6 colonies. Analysis was performed in MATLAB and two biological replicates were used. The white circle represents the mean and the black bar represents the median (∗∗∗p < 0.0005). The scale bars represent 100 μm for all images. EVT, extravillous trophoblast; hTSC, human trophoblast stem cell; STB, syncytiotrophoblast.
Figure 3
Figure 3
Assessment of temporal changes in EVT differentiation.A, confocal images of CT30 hTSCs on day 0, day 2, day 4, and day 6 of EVT differentiation, staining for HLA-G and Notch1. Nuclei were stained with DAPI. Inset is the respective isotype control. B, quantitative analysis of HLA-G expression intensity of CT30 hTSCs on day 0 (n = 1805), day 2 (n = 2179), day 4 (n = 897), and day 6 (n = 1309) of EVT differentiation. Analysis was performed in MATLAB and two biological replicates were used. The white circle represents the mean and the black bar represents the median (ns, not significant, ∗∗∗p < 0.0005). C, quantitative analysis of Notch1 expression intensity of CT30 on day 0 (n = 1805), day 2 (n = 2179), day 4 (n = 897), and day 6 (n = 1728) of EVT differentiation. Analysis was performed in MATLAB and two biological replicates were used. The white circle represents the mean and the black bar represents the median (∗∗∗p < 0.0005). D, flow cytometry histogram of HLA-G and Notch1 expression of CT30 hTSCs on day 2, day 4, and day 6 of EVT differentiation compared to an isotype control and their relative mean fluorescence intensity (MFI). E, gene expression of ITGA5, MMP2, CD9, MYC, CDH5, TP63, ELF5, HAND1, ITGA6, and TEAD4 of CT30 hTSCs on day 2, day 4, and day 6 of EVT differentiation compared to undifferentiated hTSCs (dashed line). Three biological replicates were used (Error bars, S.E., ∗p < 0.05 for comparison with undifferentiated hTSCs, #p < 0.05 for comparison with cells at day 2, %p < 0.05 for comparison with cells at day 4). The scale bars represent 100 μm for all images. EVT, extravillous trophoblast; hTSC, human trophoblast stem cell.
Figure 4
Figure 4
Expression of HIF1α and HIF2α is upregulated during EVT differentiation mediated by laminin-111.A, confocal images of CT30 hTSCs on day 0, day 2, day 4, and day 6 of EVT differentiation, staining for HIF1α and HIF2α. Nuclei were stained with DAPI. Inset is the respective isotype control. B, quantitative analysis of HIF1α expression intensity of CT30 hTSCs on day 0 (n = 1298), day 2 (n = 1591), day 4 (n = 1514), and day 6 (n = 2462) of EVT differentiation. Positive control is hTSCs cultured in TSCM with the addition of 10 μM deferoxamine for 2 days. Analysis was performed in MATLAB and two biological replicates were used. The white circle represents the mean and the black bar represents the median (ns, not significant, ∗∗∗p < 0.0005). C, quantitative analysis of HIF2α expression intensity of CT30 hTSCs on day 0 (n = 1298), day 2 (n = 1591), day 4 (n = 1514), and day 6 (n = 1640) of EVT differentiation. Positive control is hTSCs cultured in TSCM with the addition of 10 μM deferoxamine for 2 days. Analysis was performed in MATLAB and two biological replicates were used. The white circle represents the mean and the black bar represents the median (∗∗∗p < 0.0005). D, confocal images of CT30 hTSCs on day 2 and day 6 of STB differentiation, staining for HIF1α and HIF2α. Nuclei were stained with DAPI. E, quantitative analysis of HIF1α and HIF2α expression intensity of CT30 hTSCs on day 2 of STB (n = 638) and EVT (n = 1591) differentiation. Analysis was performed in MATLAB and two biological replicates were used. The white circle represents the mean and the black bar represents the median (ns, not significant, ∗∗∗p < 0.0005). Data for d2 EVT are the same as in panels B and C. The scale bars represent 100 μm for all images. EVT, extravillous trophoblast; HIF, hypoxia-inducible factor; hTSC, human trophoblast stem cell; TSCM, trophoblast stem cell medium.
Figure 5
Figure 5
A defined system enables investigation of TGFβ signaling in EVT differentiation.A, schematic of protocol for hTSC differentiation to EVT using the one-step method described in Figure 2A, in the presence of the TGFβ inhibitor A83-01. B, confocal images of CT30 hTSCs on day 2 of EVT differentiation using the method described in Figure 2A (labeled one-step) in the presence of the TGFβ inhibitor, A83-01, staining for HIF1α and HIF2α. Nuclei were stained with DAPI. C, quantitative analysis of HIF1α and HIF2α expression intensity of CT30 hTSCs on day 2 of EVT differentiation using the method described in Figure 2A in the absence (one-step, n = 1591) or presence of the TGFβ inhibitor, A83-01 (n = 627). Analysis was performed in MATLAB and two biological replicates were used. The white circle represents the mean and the black bar represents the median (∗p < 0.05, ∗∗p < 0.005). Data for d2 EVT is the same as used in Figure 4, and Fig. S7. D, confocal image of CT30 hTSCs on day 6 of EVT differentiation using the method described in Figure 2A (one-step) in the presence of the TGFβ inhibitor, A83-01, staining for HLA-G and Notch1. Nuclei were stained with DAPI. E, confocal image of CT30 hTSCs on day 6 of EVT differentiation using the method as previously described (32) (labeled two-step) in the absence of the TGFβ inhibitor, A83-01, staining for HLA-G and Notch1. Nuclei were stained with DAPI. F, confocal image of CT30 hTSCs on day 6 of EVT differentiation using the method as previously described (32) (two-step) which includes the TGFβ inhibitor, A83-01, staining for HLA-G and Notch1. Nuclei were stained with DAPI. G, quantitative analysis of HLA-G expression intensity of CT30 hTSCs on day 6 of EVT differentiation using the method described in Figure 2A (one-step) in the absence (n = 1309) or presence of the TGFβ inhibitor, A83-01 (n = 4219), and the method as previously described (32) (two-step) in the presence (n = 4950) and absence (n = 3311) of A83-01. Analysis was performed in MATLAB and two biological replicates were used. The white circle represents the mean and the black bar represents the median (∗∗∗p < 0.0005). Data for one-step EVT in the absence of A83-01 is same as used in Figure 3, Figs. S5, and S7. H, quantitative analysis of Notch1 expression intensity of CT30 hTSCs on day 6 of EVT differentiation using the method described in Figure 2A (one-step) in the absence (n = 1728) or presence of the TGFβ inhibitor, A83-01 (n = 4219), and the method as previously described (32) (one-step) in the presence (n = 4950) and absence (n = 3311) of A83-01. Analysis was performed in MATLAB and two biological replicates were used. The white circle represents the mean and the black bar represents the median (ns, not significant, ∗∗∗p < 0.0005). Data for one-step EVT in the absence of A83-01 is same as used in Figure 3, Figs. S5, and S7. I, quantitative analysis of the cell number of CT29 and CT30 hTSCs on day 6 of EVT differentiation using the method described in Figure 2A (one-step) in the presence and absence of A83-01 (n = 2 × 2 cell lines = 4). Analysis was performed in MATLAB and two biological replicates were used. The black bar represents the mean (∗∗∗p < 0.0005). The scale bars represent 100 μm for all images. EVT, extravillous trophoblast; HIF, hypoxia-inducible factor; hTSC, human trophoblast stem cell; TGF, transforming growth factor.
Figure 6
Figure 6
A defined system enables investigation of TGFβ signaling in STB differentiation.A, schematic of protocol for hTSC differentiation to STB in the presence of a TGFβ inhibitor, A83-01. B, confocal image of CT30 hTSCs on day 6 of STB differentiation using the method described in Figure 1A in the presence of A83-01, staining for HLA-G and SDC-1. Nuclei were stained with DAPI. C, quantitative analysis of HLA-G expression intensity of CT30 hTSCs on day 6 of EVT differentiation using the method described in Figure 2A (1-Step; n = 1309) or STB differentiation using the method described in Figure 1A in the presence of a TGFβ inhibitor, A83-01 (n = 6922). Analysis was performed in MATLAB and two biological replicates were used. The white circle represents the mean and the black bar represents the median (∗∗∗p < 0.0005). Data for one-step EVT is same as used in Figures 3 and 5, Figs. S3, and S7. D, fluorescent image of CT30 hTSCs on day 6 of STB differentiation using the method described in Figure 1A in the presence of A83-01. Nuclei were stained with DAPI. Membrane was stained with Di-8-ANEPPS cell membrane stain. The scale bar represents 50 μm. E, confocal images of CT30 hTSCs on day 6 of STB differentiation using the method using forskolin as previously described (32), staining for hCG, SDC-1, EGFR, and KRT7. Nuclei were stained with DAPI. F, fluorescent image of CT30 hTSCs on day 6 of STB differentiation using the method using forskolin as previously described (32). Nuclei were stained with DAPI. Membrane was stained with Di-8-ANEPPS cell membrane stain. The scale bar represents 50 μm. G, confocal images of CT30 hTSCs on day 6 of STB differentiation using the method using forskolin as previously described (32) in the presence of the TGFβ inhibitor, A83-01, staining for HLA-G and SDC-1. Nuclei were stained with DAPI. H, fluorescent image of CT30 hTSCs on day 6 of STB differentiation using the method using forskolin as previously described (32) in the presence of the TGFβ inhibitor, A83-01. Nuclei were stained with DAPI. Membrane was stained with Di-8-ANEPPS cell membrane stain. The scale bar represents 50 μm. I, fusion efficiency of CT30 hTSCs on day 6 of STB differentiation using the method described in Figure 1A and the method using forskolin as previously described (32) in the presence and absence of the TGFβ inhibitor, A83-01 compared to CT30 hTSCs cultured in TSCM. Nuclei were stained with DAPI. Membrane was stained with Di-8-ANEPPS cell membrane stain. Three measurements from two biological replicates were used to calculate fusion index. Data for TSCM, STB, and STB (forskolin) is same as used in Figure 1 (ns, not significant, ∗p < 0.05, Error bars, SD, n = 3). The scale bars represent 100 μm for all images unless specified otherwise. hTSC, human trophoblast stem cell; STB, syncytiotrophoblast; TGF, transforming growth factor; TSCM, trophoblast stem cell medium.
Figure 7
Figure 7
TGFβ inhibition upregulates HIF1α.A, quantitative analysis of HIF1α expression intensity of CT30 hTSCs on day 2 of STB differentiation using the method described in Figure 1A in the absence (n = 638) or presence (n = 627) of a TGFβ inhibitor, A83-01. Analysis was performed in MATLAB and two biological replicates were used. The white circle represents the mean and the black bar represents the median (∗∗∗p < 0.0005). Data for d2 STB are the same as used in Figure 4. B, Quantitative analysis of HIF2α expression intensity of CT30 hTSCs on day 2 of STB differentiation using the method described in Figure 1A in the absence (n = 638) or presence (n = 627) of a TGFβ inhibitor, A83-01. Analysis was performed in MATLAB and two biological replicates were used. The white circle represents the mean and the black bar represents the median (∗∗∗p < 0.0005). Data for d2 STB are the same as used in Figure 4. C, confocal images of CT30 hTSCs on day 2 of STB differentiation using the method described in Figure 1A in the presence of a A83-01, staining for HIF1α and HIF2α. Nuclei were stained with DAPI. The scale bars represent 100 μm for all images. HIF, hypoxia-inducible factor; hTSC, human trophoblast stem cell; STB, syncytiotrophoblast; TGF, transforming growth factor.
Figure 8
Figure 8
Laminin-111 switches the terminal trophoblast differentiation fate from STB to EVT. EVT, extravillous trophoblast; STB, syncytiotrophoblast.

Similar articles

References

    1. Aplin J.D. Developmental cell biology of human villous trophoblast: current research problems. Int. J. Dev. Biol. 2010;54:323–329. - PubMed
    1. Knöfler M., Vasicek R., Schreiber M. Key regulatory transcription factors involved in placental trophoblast development - a review. Placenta. 2001;22:S83–S92. - PubMed
    1. Knöfler M., Haider S., Saleh L., Pollheimer J., Gamage T.K.J.B., James J. Human placenta and trophoblast development: key molecular mechanisms and model systems. Cell. Mol. Life Sci. 2019;76:3479–3496. - PMC - PubMed
    1. Loregger T., Pollheimer J., Knöfler M. Regulatory transcription factors controlling function and differentiation of human trophoblast - a review. Placenta. 2003;24:S104–S110. - PubMed
    1. Caniggia I., Winter J., Lye S.J., Post M. Oxygen and placental development during the first trimester: implications for the pathophysiology of pre-eclampsia. Placenta. 2000;21:S25–S30. - PubMed

Publication types

MeSH terms