PR-DUB safeguards Polycomb repression through H2AK119ub1 restriction
- PMID: 36959757
- PMCID: PMC10542648
- DOI: 10.1111/cpr.13457
PR-DUB safeguards Polycomb repression through H2AK119ub1 restriction
Abstract
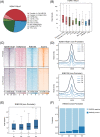
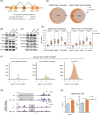
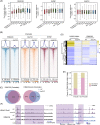
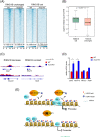
Polycomb group (PcG) proteins are critical chromatin regulators for cell fate control. The mono-ubiquitylation on histone H2AK119 (H2AK119ub1) is one of the well-recognized mechanisms for Polycomb repressive complex 1 (PRC1)-mediated transcription repression. Unexpectedly, the specific H2AK119 deubiquitylation complex composed by additional sex comb-like proteins and BAP1 has also been genetically characterized as Polycomb repressive deubiquitnase (PR-DUB) for unclear reasons. However, it remains a mystery whether and how PR-DUB deficiency affects chromatin states and cell fates through impaired PcG silencing. Here through a careful epigenomic analysis, we demonstrate that a bulk of H2AK119ub1 is diffusely distributed away from promoter regions and their enrichment is positively correlated with PRC1 occupancy. Upon deletion of Asxl2 in mouse embryonic stem cells (ESCs), a pervasive gain of H2AK119ub1 is coincident with increased PRC1 sampling at chromatin. Accordingly, PRC1 is significantly lost from a subset of highly occupied promoters, leading to impaired silencing of associated genes before and after lineage differentiation of Asxl2-null ESCs. Therefore, our study highlights the importance of genome-wide H2AK119ub1 restriction by PR-DUB in safeguarding robust PRC1 deposition and its roles in developmental regulation.
© 2023 The Authors. Cell Proliferation published by Beijing Institute for Stem Cell and Regenerative Medicine and John Wiley & Sons Ltd.
Conflict of interest statement
The authors declare no conflict of interest.
Figures


Similar articles
-
PR-DUB preserves Polycomb repression by preventing excessive accumulation of H2Aub1, an antagonist of chromatin compaction.Genes Dev. 2022 Oct 1;36(19-20):1046-1061. doi: 10.1101/gad.350014.122. Epub 2022 Nov 10. Genes Dev. 2022. PMID: 36357125 Free PMC article.
-
BAP1 enhances Polycomb repression by counteracting widespread H2AK119ub1 deposition and chromatin condensation.Mol Cell. 2021 Sep 2;81(17):3526-3541.e8. doi: 10.1016/j.molcel.2021.06.020. Epub 2021 Jun 28. Mol Cell. 2021. PMID: 34186021 Free PMC article.
-
Histone H2AK119 Mono-Ubiquitination Is Essential for Polycomb-Mediated Transcriptional Repression.Mol Cell. 2020 Feb 20;77(4):840-856.e5. doi: 10.1016/j.molcel.2019.11.021. Epub 2019 Dec 26. Mol Cell. 2020. PMID: 31883952 Free PMC article.
-
Polycomb-dependent histone H2A ubiquitination links developmental disorders with cancer.Trends Genet. 2022 Apr;38(4):333-352. doi: 10.1016/j.tig.2021.07.011. Epub 2021 Aug 20. Trends Genet. 2022. PMID: 34426021 Review.
-
Goldilocks meets Polycomb.Genes Dev. 2022 Oct 1;36(19-20):1043-1045. doi: 10.1101/gad.350248.122. Genes Dev. 2022. PMID: 36460465 Free PMC article. Review.
Cited by
-
Histone H2A deubiquitinase BAP1 is essential for endothelial cell differentiation from human pluripotent stem cells.In Vitro Cell Dev Biol Anim. 2024 Jul 8. doi: 10.1007/s11626-024-00935-x. Online ahead of print. In Vitro Cell Dev Biol Anim. 2024. PMID: 38976206
-
Human ASXL1-Mutant Hematopoiesis Is Driven by a Truncated Protein Associated with Aberrant Deubiquitination of H2AK119.Blood Cancer Discov. 2024 May 1;5(3):202-223. doi: 10.1158/2643-3230.BCD-23-0235. Blood Cancer Discov. 2024. PMID: 38359087 Free PMC article.
References
-
- Schuettengruber B, Bourbon HM, Di Croce L, Cavalli G. Genome regulation by Polycomb and trithorax: 70 years and counting. Cell. 2017;171(1):34‐57. - PubMed
-
- Piunti A, Shilatifard A. The roles of Polycomb repressive complexes in mammalian development and cancer. Nat Rev Mol Cell Biol. 2021;22(5):326‐345. - PubMed
-
- Loubiere V, Martinez AM, Cavalli G. Cell fate and developmental regulation dynamics by Polycomb proteins and 3D genome architecture. Bioessays. 2019;41(3):e1800222. - PubMed
-
- Di Croce L, Helin K. Transcriptional regulation by Polycomb group proteins. Nat Struct Mol Biol. 2013;20(10):1147‐1155. - PubMed
MeSH terms
Substances
Grants and funding
LinkOut - more resources
Full Text Sources
Molecular Biology Databases
Research Materials

