. 2023 Mar 22;14(1):1449.
doi: 10.1038/s41467-023-36774-9.

MicroRNA156 conditions auxin sensitivity to enable growth plasticity in response to environmental changes in Arabidopsis

Affiliations

MicroRNA156 conditions auxin sensitivity to enable growth plasticity in response to environmental changes in Arabidopsis

Qing Sang et al. Nat Commun. .

Abstract

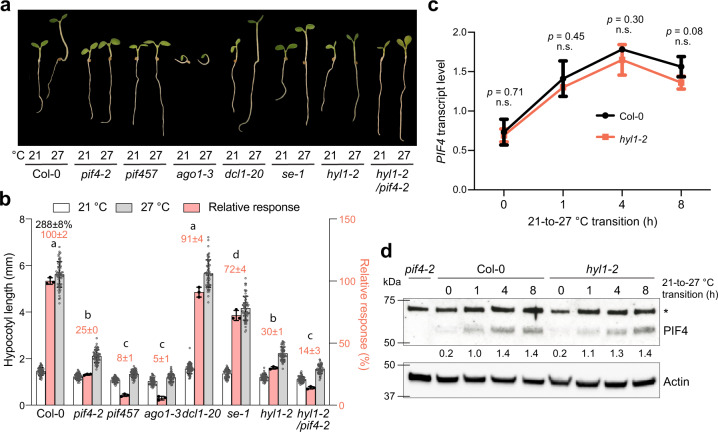
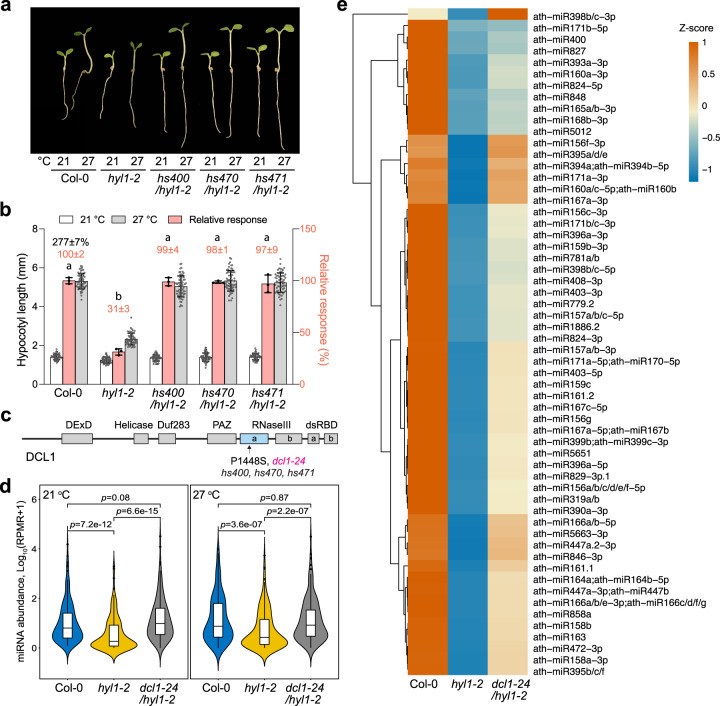
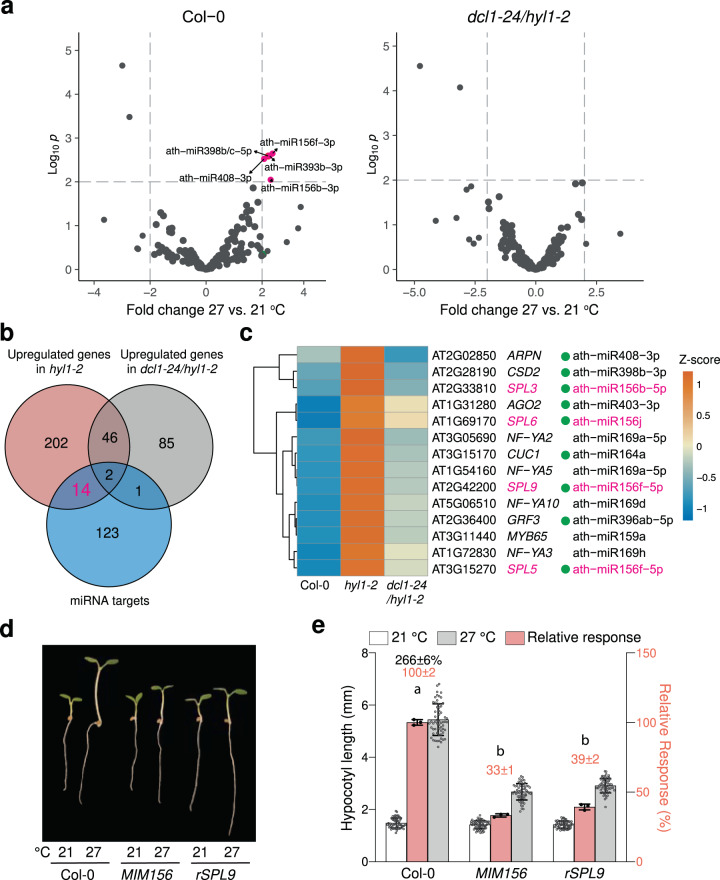
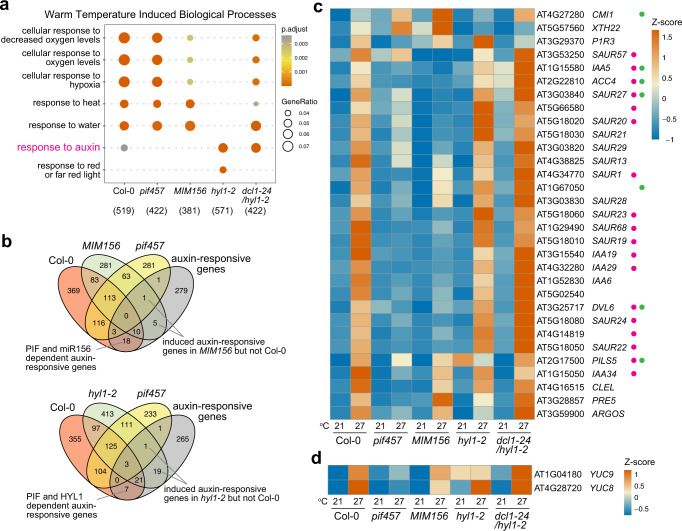
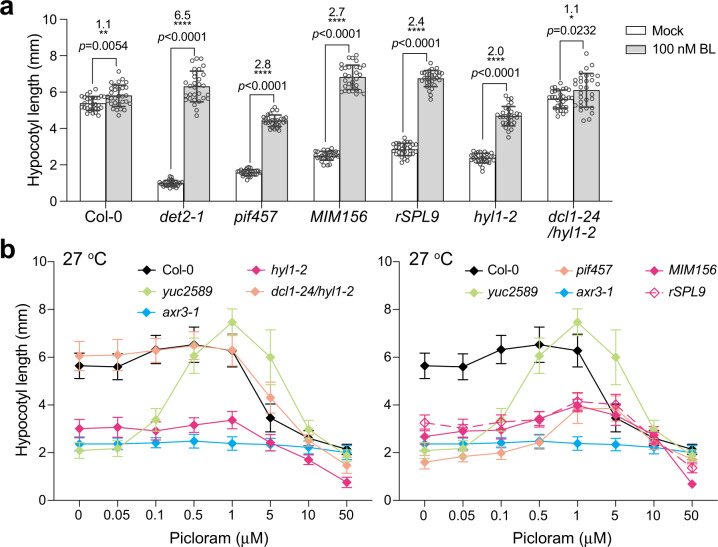
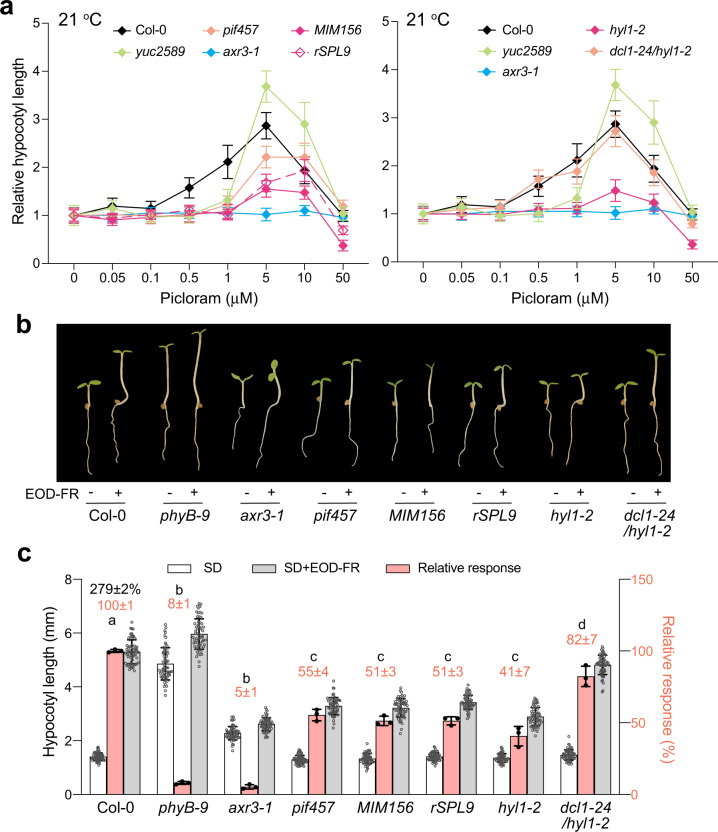
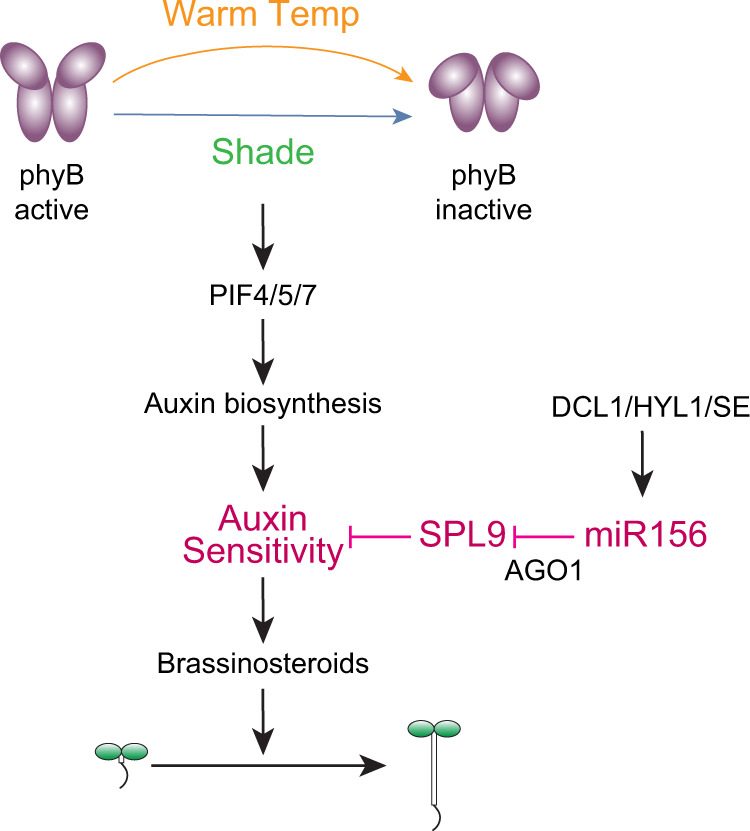
MicroRNAs (miRNAs) play diverse roles in plant development, but whether and how miRNAs participate in thermomorphogenesis remain ambiguous. Here we show that HYPONASTIC LEAVES 1 (HYL1)-a key component of miRNA biogenesis-acts downstream of the thermal regulator PHYTOCHROME INTERACTING FACTOR 4 in the temperature-dependent plasticity of hypocotyl growth in Arabidopsis. A hyl1-2 suppressor screen identified a dominant dicer-like1 allele that rescues hyl1-2's defects in miRNA biogenesis and thermoresponsive hypocotyl elongation. Genome-wide miRNA and transcriptome analysis revealed microRNA156 (miR156) and its target SQUAMOSA PROMOTER-BINDING-PROTEIN-LIKE 9 (SPL9) to be critical regulators of thermomorphogenesis. Surprisingly, perturbation of the miR156/SPL9 module disengages seedling responsiveness to warm temperatures by impeding auxin sensitivity. Moreover, miR156-dependent auxin sensitivity also operates in the shade avoidance response at lower temperatures. Thus, these results unveil the miR156/SPL9 module as a previously uncharacterized genetic circuit that enables plant growth plasticity in response to environmental temperature and light changes.


Conflict of interest statement

The authors declare no competing interests.

Figures

Fig. 1
Fig. 1. HYL1 is required for thermomorphogenesis.
a Representative images of 4-d-old Col-0, pif4-2, pif457, ago1-3, dcl1-20, se-1, hyl1-2, and hyl1-2/pif4-2 seedlings grown under 50 μmol m−2 s−1 R light at either 21 °C or 27 °C. b Hypocotyl length measurements of the seedlings in (a) and their relative responses to the higher temperature. The open and gray bars represent hypocotyl length measurements at 21 °C and 27 °C, respectively. Error bars for the hypocotyl measurements represent s.d. (n = 60 seedlings). The black number above the Col-0 columns represents the percent increase in hypocotyl length (mean ± s.d., n = 3 biological replicates) at 27 °C compared with 21 °C. The pink bars show the relative response, which is defined as the hypocotyl response to 27 °C of a mutant relative to that of Col-0 (set at 100%). Pink numbers show the mean ± s.d. values of the relative responses. Different lowercase letters above the bars denote statistically significant differences in the relative responses (ANOVA, Tukey’s HSD, p < 0.01, n = 3 biological replicates). Error bars for the relative responses represent the s.d. of three biological replicates. The centers of all error bars indicate the mean values. c qRT-PCR analysis of the PIF4 transcript levels in 4-d-old Col-0 and hyl1-2 seedlings grown under 50 μmol m−2 s−1 R light at the indicated time points during the 21-to-27 °C transition. The transcript levels were quantified relative to those of PP2A. Error bars represent the s.d. of three biological replicates. The centers of the error bars represent the mean values. Statistical significance was analyzed using a two-tailed Student’s t-test. d Immunoblot analyses of PIF4 protein levels in response to elevated temperature. Four-day-old Col-0 and hyl1-2 seedlings grown at 50 μmol m−2 s−1 R light at 21 °C were transferred to 27 °C under the same light conditions for up to 8 h, and samples were collected at the indicated time points. The dark-grown pif4-2 sample was used as a negative control. Actin was used as a loading control. The relative levels of PIF4, normalized to actin, are shown underneath the PIF4 immunoblots. The asterisk indicates nonspecific bands. The experiment was repeated three times with similar results. The source data underlying the hypocotyl measurements in (b), the qRT-PCR analysis in (c), and the immunoblots in (d) are provided in the Source Data file.
Fig. 2
Fig. 2. MicroRNA biogenesis is essential for thermomorphogenesis.
a Representative images of 4-d-old Col-0, hyl1-2, hs400/hyl1-2, hs470/hyl1-2, and hs471/hyl1-2 seedlings grown under 50 μmol m−2 s−1 R light at either 21 °C or 27 °C. b Hypocotyl length measurements of the seedlings in (a) and their relative responses to the warm temperature. The open and gray bars represent hypocotyl length measurements at 21 °C and 27 °C, respectively. Error bars for the hypocotyl measurements represent s.d. (n = 60 seedlings). The black number above the Col-0 columns represents the percent increase in hypocotyl length (mean ± s.d., n = 3 biological replicates) at 27 °C compared with 21 °C. The pink bars show the warm-temperature response of a mutant relative to that of Col-0 (set at 100%). Pink numbers show the mean ± s.d. values of the relative responses. Different lowercase letters above the bars denote statistically significant differences in the relative responses (ANOVA, Tukey’s HSD, p < 0.01, n = 3 biological replicates). Error bars for the relative responses represent the s.d. of three biological replicates. The centers of all error bars indicate the mean values. c Schematic illustration of the domain structure of DCL1 and the position of the suppressor dcl1-24 mutation. d Violin plots showing the relative global miRNA levels in Col-0, hyl1-2, and dcl1-24/hyl1-2 at 21 °C (left) and 27 °C (right). The miRNA levels were quantified relative to the respective reads from small RNA fragments derived from 45S rRNA. RPMR, reads per million of rRNA reads. In the box and whisker plots, the boxes represent the 25% to 75% quantiles, and the bars are equal to the median. Statistical significance was analyzed using a two-tailed Student’s t-test, n = 3 independent biological replicates. e Heatmap showing the relative levels of the 56 miRNAs downregulated in hyl1-2 and rescued in dcl1-24/hyl1-2 at 27 °C. The source data underlying the hypocotyl measurements in (b) are provided in the Source Data file.
Fig. 3
Fig. 3. Thermomorphogenesis requires miR156.
a Volcano plots showing differentially accumulated (two-tailed p < 0.01, and fold change >2) miRNAs in 4-d-old Col-0 and dcl1-24/hyl1-2 seedlings grown under 50 μmol m−2 s−1 R light between 21 °C and 27 °C. Statistical significance was analyzed using multiple t-tests with correction for multiple comparisons. b Venn diagram depicting that 14 miRNA targets were upregulated in hyl1-2 and rescued in dcl1-1/hy1-2. c Heatmap showing the relative expression levels of the 14 HYL1-regulated miRNA targets identified in (b) in 4-d-old Col-0, hyl1-2, and dcl1-24/hy1-2 seedlings grown under 50 μmol m−2 s−1 R light at 27 °C. The green dots indicate that the corresponding miRNAs were among the 56 downregulated miRNAs in hyl1-2 and rescued in dcl1-24/hyl1-2, as shown in Fig. 2e. miRNA156 and SPLs are highlighted in magenta. d Representative images of 4-d-old Col-0, MIM156, and rSPL9 seedlings grown under 50 μmol m−2 s−1 R light at either 21 °C or 27 °C. e Hypocotyl length measurements of the seedlings in (d) and their relative responses to the higher temperature. Error bars represent s.d. (n = 60 seedlings). The black number above the Col-0 columns represents the percent increase in hypocotyl length (mean ± s.d., n = 3 independent biological replicates) at 27 °C compared with 21 °C. The pink bars show the warm-temperature response of a mutant relative to that of Col-0 (set at 100%). Pink numbers show the mean ± s.d. of the relative responses. Different lowercase letters above the bars denote statistically significant differences in the relative responses (ANOVA, Tukey’s HSD, p < 0.01, n = 3 biological replicates). Error bars for the relative responses represent the s.d. of three biological replicates. The centers of the error bars indicate the mean. The source data underlying the hypocotyl measurements in (e) are provided in the Source Data file.
Fig. 4
Fig. 4. MiR156 potentiates the proper regulation of auxin-responsive genes by warm temperatures.
a GO enrichment analysis of the top warm-temperature-induced biological processes in Col-0, pif457, MIM156, hyl1-2, and dcl1-24/hyl1-2. A comparison of the enriched biological processes among the genetic backgrounds was performed using clusterProfiler, with the strict cutoff of p < 0.01 and FDR < 0.05. The numbers in parentheses indicate the number of warm-temperature-induced genes in each genotype. b Venn diagrams showing the numbers of warm-temperature-induced auxin-responsive genes (GO:0009733) in Col-0, pif457, hyl1-2, and MIM156. c Heatmap showing the relative expression levels of the 31 warm-temperature-upregulated auxin-responsive genes in Col-0, pif457, MIM156, hyl1-2, and dcl1-24/hyl1-2 at 21 °C and 27 °C. The magenta dots indicate the 18 auxin-responsive genes that are dependent on both PIFs and miR156. The green dots indicate the 7 auxin-responsive genes that are dependent on both PIFs and HYL1. d Heatmap showing the relative expression levels of YUC8 and YUC9 in Col-0, pif457, MIM156, hyl1-2, and dcl1-24/hyl1-2 at 21 °C and 27 °C.
Fig. 5
Fig. 5. Perturbation of miR156/SPL9 impedes auxin responsiveness at warm temperatures.
a miR156/SPL9 acts upstream of brassinosteroid biosynthesis in thermomorphogenesis. Hypocotyl length measurements of 4-d-old Col-0, det2-1, pif457, MIM156, rSPL9, hyl1-2, and dcl1-24/hyl1-2 grown under 50 μmol m−2 s−1 R light at 27 °C with or without 100 nM brassinolide (BL). Error bars represent the s.d. of at least 30 seedlings. The centers of the error bars indicate the mean. The fold changes and the p values between the treated and mock control seedlings for each genotype are shown above the columns. Statistical significance was analyzed using two-tailed Student’s t-tests (*p < 0.05, **p < 0.01, ****p < 0.0001), n = at least 30 seedlings. b Auxin dosage response curves showing that miR156 is required for the hypocotyl’s responsiveness to auxin at 27 °C. Hypocotyl length measurements of 4-d-old Col-0, yuc2589, axr3-1, pif457, MIM156, rSPL9, hyl1-2, and dcl1-24/hyl1-2 seedlings grown under 50 μmol m−2 s−1 R light at 27 °C and treated with a concentration series of picloram from 0 to 50 μM. Error bars represent the s.d., n = at least 30 seedlings. The centers of the error bars indicate the mean. The source data underlying the hypocotyl measurements in (a) and (b) are provided in the Source Data file.
Fig. 6
Fig. 6. MiR156-dependent auxin sensitivity is required for the shade avoidance response.
a Auxin dosage response curves showing that miR156 is required for the hypocotyl’s responsiveness to auxin at 21 °C. Hypocotyl length measurements of 4-d-old Col-0, yuc2589, axr3-1, pif457, MIM156, rSPL9, hyl1-2, and dcl1-24/hyl1-2 seedlings grown under 50 μmol m−2 s−1 R light at 21 °C and treated with a concentration series of picloram from 0 to 50 μM. Hypocotyl length was calculated relative to that without picloram treatment for each genotype. Error bars represent the s.d., n = at least 30 seedlings. The centers of the error bars indicate the mean. b Images of 4-d-old Col-0, phyB-9, axr3-1, pif457, MIM156, rSPL9, hyl1-2, and dcl1-24/hyl1-2 seedlings grown at 21 °C under the short-day condition of 8 h of 100 μmol m−2 s−1 white light and 16 h of dark with or without a 15 min end-of-day FR (EOD-FR) light treatment. c Hypocotyl length measurements of seedlings in (a) and their relative response to the EOD-FR treatment. The black number above the Col-0 columns represents the percent increase in hypocotyl length (mean ± s.d., n = 3 biological replicates) by the EOD-FR treatment. The pink bars show the EOD-FR response of a mutant relative to that of Col-0 (set at 100%). Pink numbers show the mean ± s.d. of the relative responses. Different lowercase letters above the bars denote statistically significant differences in the relative responses (ANOVA, Tukey’s HSD, p < 0.01, n = 3 biological replicates). Error bars for the relative responses represent the s.d. of three biological replicates. The centers of all error bars indicate the mean. The source data underlying the hypocotyl measurements in (a) and (c) are provided in the Source Data file.
Fig. 7
Fig. 7. Model for miR156-enabled phenotypic plasticity to temperature and light changes.
Environmental light and temperature changes perceived by the photoreceptor and thermosensor PHYB trigger profound modulations in plant architecture via the master growth regulators PIFs and PIF-induced auxin synthesis and signaling. This study unveils a previously unknown control of auxin sensitivity licensed by miR156. Auxin sensitivity is antagonized primarily by SPL9. In light- and temperature-elicited hypocotyl elongation responses during Arabidopsis seedling establishment, miR156 enables auxin sensitivity by repressing SPL9. We propose that miR156-dependent auxin sensitivity constitutes a genetic circuit gating light and temperature responses by the endogenous developmental program. This critical role of miR156 makes the basic components involved in miRNA biogenesis and function, such as DCL1, HYL1, SE, and AGO1, necessary elements for the plant’s phenotypic plasticity in response to environmental temperature and light changes.

Similar articles

Cited by

References

    1. Lande R. Adaptation to an extraordinary environment by evolution of phenotypic plasticity and genetic assimilation. J. Evol. Biol. 2009;22:1435–1446. doi: 10.1111/j.1420-9101.2009.01754.x. - DOI - PubMed
    1. Delker C, Quint M, Wigge PA. Recent advances in understanding thermomorphogenesis signaling. Curr. Opin. Plant Biol. 2022;68:102231. doi: 10.1016/j.pbi.2022.102231. - DOI - PubMed
    1. Casal JJ, Balasubramanian S. Thermomorphogenesis. Annu. Rev. Plant Biol. 2019;70:321–346. doi: 10.1146/annurev-arplant-050718-095919. - DOI - PubMed
    1. Nicotra AB, et al. Plant phenotypic plasticity in a changing climate. Trends Plant Sci. 2010;15:684–692. doi: 10.1016/j.tplants.2010.09.008. - DOI - PubMed
    1. Schlenker W, Roberts MJ. Nonlinear temperature effects indicate severe damages to U.S. crop yields under climate change. Proc. Natl. Acad. Sci. USA. 2009;106:15594–15598. doi: 10.1073/pnas.0906865106. - DOI - PMC - PubMed

Publication types

MeSH terms