. 2023 Mar 21;6(1):301.
doi: 10.1038/s42003-023-04658-9.

ClpC2 protects mycobacteria against a natural antibiotic targeting ClpC1-dependent protein degradation

Affiliations

ClpC2 protects mycobacteria against a natural antibiotic targeting ClpC1-dependent protein degradation

Gabrielle Taylor et al. Commun Biol. .

Abstract

Mycobacterium tuberculosis Clp proteases are targeted by several antitubercular compounds, including cyclomarin A (CymA). CymA exerts its toxicity by binding to AAA + chaperone ClpC1. Here, we show that CymA can also bind a partial homologue of ClpC1, known as ClpC2, and we reveal the molecular basis of these interactions by determining the structure of the M. tuberculosis ClpC2:CymA complex. Furthermore, we show deletion of clpC2 in Mycobacterium smegmatis increases sensitivity to CymA. We find CymA exposure leads to a considerable upregulation of ClpC2 via a mechanism in which binding of CymA to ClpC2 prevents binding of ClpC2 to its own promoter, resulting in upregulation of its own transcription in response to CymA. Our study reveals that ClpC2 not only senses CymA, but that through this interaction it can act as a molecular sponge to counteract the toxic effects of CymA and possibly other toxins targeting essential protease component ClpC1 in mycobacteria.


Conflict of interest statement

The authors declare no competing interests.

Figures

Fig. 1
Fig. 1. The antitubercular compound CymA binds to Mtb ClpC2.
a Structural formula of cyclomarin A (CymA). b Domain organisation of Mtb ClpC1 alongside its partial homologue ClpC2. ClpC1 NTD, N-terminal domain (cyan); AAA, ATPases Associated with diverse cellular Activities (shades of grey); MD, middle domain (black). The ClpC1 partial homologue, ClpC2, is coloured according to sequence homology to ClpC1 NTD: homologous region (cyan); non-homologous region (light blue). c, d Injection profiles and binding isotherms for ITC titrations of ClpC11–145 against CymA (c) and ClpC2 against CymA (d). The dissociation constant is indicated within each panel. Measurements were performed at 37 °C titrating aliquots of 50 μM ClpC11–145 (c) or ClpC2 (d) to 5 μM CymA. N and KD values are the mean ± standard deviation from three independent experiments.
Fig. 2
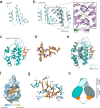
Fig. 2. Crystal structure of the ClpC2 N-terminal domain and of the ClpC2 C-terminal domain in complex with CymA.
a Crystal structure of the N-terminal domain of ClpC2 (ClpC24–72). b ClpC24–72 forms a homodimer in the crystallographic asymmetric unit (left panel) with each monomer coloured in light blue or light teal. In the right panel is a close-up view of the dimeric interface between ClpC2 monomers coloured according to the conservation of residues. Dashed lines suggest electrostatic interactions. c Overall structure of ClpC2 C-terminal domain (ClpC294–252; cyan) bound to CymA (orange). d The unbiased mFo-DFc Fourier map of CymA at 3.0 σ was calculated following molecular replacement using PDB 3WDC as a search model excluding ligands. e ClpC294–252 (cyan) bound to CymA (orange) is superimposed onto ClpC1 NTD bound to CymA (PDB 3WDC; grey) showing a root mean square deviation (RMSD) of 2.0 Å. f CymA (orange, stick representation) bound to ClpC294–252 (surface representation), coloured according to hydrophobicity. g Detailed molecular interactions between CymA and ClpC2 C-terminal domain. Shown in stick representation are the residues of ClpC2 (cyan) that are in close proximity to CymA (orange) with suggested hydrogen bond interactions represented by dashed lines and water molecules represented as red spheres. h A cartoon model of ClpC2 dimer colour-coded according to the presented ClpC2 crystal structures.
Fig. 3
Fig. 3. ClpC2 protects Msm against CymA toxicity.
a A clpC2 knockout (ΔclpC2) strain was prepared in Msm. The ΔclpC2 (red diamonds), parent (WT, black squares) as well as ΔclpC2 strains complemented with clpC2 WT (comclpC2 WT, grey circles) or complemented with clpC2 F99A (comclpC2 F99A, blue triangles) were grown to exponential phase, then diluted to an OD600 of 0.005 before monitoring the OD600 of the cultures grown in either the absence or presence of 150 nM CymA. Error bars depict the standard deviation from three biological replicates. b The effect of CymA on cellular ClpC2 protein levels was analysed by Western blot. Msm culture was grown to an OD600 of 0.5 in 7H9 medium at 37 °C before adding 150 nM CymA. Cells were harvested, then lysed at the indicated time points following addition of CymA. RpoB is included as a loading control. c The counteractive effect of ClpC2 in a CymA-stimulated FITC-casein degradation assay. The proteolytic activity of 0.5 µM ClpC1 hexamer/0.8 µM ClpP1P2 tetradecamer was stimulated by 2 µM CymA and the rate of degradation was determined following the addition of increasing concentrations of ClpC2. The rate of degradation is normalised so that 0% stimulation is the proteolytic activity in the absence of CymA and 100% stimulation is equivalent to the maximum CymA-induced stimulation above basal activity. Error bars represent standard deviation from three independent experiments. d Quantitative Western blot was employed to analyse the ratio of ClpC1 (open circles) to ClpC2 (filled squares) following addition of CymA. Msm culture was grown to an OD600 of 0.5 in 7H9 medium at 37 °C before adding 150 nM CymA. Samples were harvested at the indicated time points following addition of CymA and ClpC1 or ClpC2 proteins quantified by immunoblotting in reference to a protein standard curve using purified ClpC1 and ClpC2 protein. ClpC1 and ClpC2 protein levels are normalised relative to ClpC1 at timepoint 0 h. Representative blots are shown in Supplementary Fig. 3. Error bars depict standard deviation from biological triplicates. e Expression levels of clpC2 in the absence and presence of 150 nM CymA as analysed by RT-qPCR. Msm cultures were grown to an OD600 of 0.5 followed by a one-hour incubation in either the absence or presence of 150 nM CymA. clpC2 gene expression was normalised to the housekeeping gene rpoB. Error bars represent standard deviation of technical triplicates from three biological replicates. Statistical analysis by two-tailed unpaired Student’s t test; P value = 0.0015.
Fig. 4
Fig. 4. ClpC2 acts as a transcription factor regulating its own expression.
a The luciferase gene under the control of the clpC2 promoter was introduced into the genomes of both WT and ΔclpC2 strains via an integrative vector (see Supplementary Fig 5). Cells were harvested following the addition of CymA and the total RNA was extracted in preparation for luciferase transcript levels analysis by RT-qPCR. Luciferase transcript levels are normalised to the housekeeping gene rpoB and expression levels are expressed relative to the wild-type strain grown in the absence of CymA. Error bars depict standard deviation from three biological replicates with statistical significance determined by two-tailed unpaired Student’s t test. b Alignment of DNA sequences immediately upstream of the clpC2 open reading frame in a selection of actinobacteria. The start codon for clpC2 and homologues is shaded in light green. Pseudopalindromic sequence regions upstream of the start codon are shaded in light blue. The sequence logo is displayed above the alignment. Mtb, Mycobacterium tuberculosis; Msm, Mycobacterium smegmatis; Mma, Modestobacter marinus; Ser, Saccharopolyspora erythraea; Rer, Rhodococcus erythropolis; Gsi, Gordonia sihwensis; Nas, Nocardia asteroids. c ClpC2 DNA-binding activity was analysed by electrophoretic mobility shift assay (EMSA). 1–25 nM ClpC2 was added to 0.5 nM DNA that includes the putative clpC2 operator sequence. Data are representative of three independent experiments. d The binding of DNA to ClpC2 was analysed in the absence (filled squares) and presence (open circles) of 1 µM CymA. Gel band intensity was quantified by densitometry to determine the fraction of DNA bound to ClpC2. Representative gels are shown in Supplementary Fig. 8. Error bars represent the standard deviation of three independent experiments.
Fig. 5
Fig. 5. CymA interferes with Mtb ClpC2 binding to its promoter DNA.
a Surface representation of ClpC294–252-CymA coloured according to residue conservation produced using ConSurf. CymA is coloured in orange and shown in stick representation. b Structure of ClpC294–252 depicting surface charge and shown in the same orientation as in a. c Close-up of the suggested DNA recognition helix shown in the forefront. Arginines suggested to contribute to DNA-binding are shown in stick representation. d Comparison of ClpC2 WT and ClpC2 R185A/R189A double mutant in an electrophoretic mobility shift assay. ClpC2 variants were titrated against 0.5 nM DNA probe and loaded onto a 12% polyacrylamide gel. Data are representative of three independent experiments.
Fig. 6
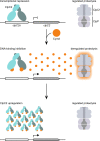
Fig. 6. ClpC2 response to CymA exposure helps protect mycobacteria from CymA-induced toxicity.
ClpC2 binds to its own operator site (clpC2o) performing the role of a transcriptional repressor under standard growth conditions. Upon exposure to CymA, both ClpC1 and ClpC2 bind CymA leading to both aberrant ClpC1P activity as well as the lifting of clpC2 gene repression resulting in the upregulation of ClpC2. The increased ClpC2 protein levels bind the available CymA, preventing the toxic consequences of CymA interaction with ClpC1.

Similar articles

Cited by

References

    1. Jassal M, Bishai WR. Extensively drug-resistant tuberculosis. Lancet Infect. Dis. 2009;9:19–30. doi: 10.1016/S1473-3099(08)70260-3. - DOI - PubMed
    1. Portelli, S., Phelan, J. E., Ascher, D. B., Clark, T. G. & Furnham, N. Understanding molecular consequences of putative drug resistant mutations in Mycobacterium tuberculosis. Sci. Rep.8, 10.1038/s41598-018-33370-6 (2018). - PMC - PubMed
    1. Chakaya J, et al. Global tuberculosis report 2020 - reflections on the global TB burden, treatment and prevention efforts. Int. J. Infect. Dis. 2021;113:S7–S12. doi: 10.1016/j.ijid.2021.02.107. - DOI - PMC - PubMed
    1. Kashongwe IM, et al. Outcomes and adverse events of pre- and extensively drug-resistant tuberculosis patients in Kinshasa, Democratique Republic of the Congo: a retrospective cohort study. Plos One. 2020;15:e0236264. doi: 10.1371/journal.pone.0236264. - DOI - PMC - PubMed
    1. Ghazy, R. M. et al. A systematic review and meta-analysis of the catastrophic costs incurred by tuberculosis patients. Sci. Rep.12, 10.1038/s41598-021-04345-x (2022). - PMC - PubMed

Publication types

MeSH terms