Combined Multiomics and In Silico Approach Uncovers PRKAR1A as a Putative Therapeutic Target in Multi-Organ Dysfunction Syndrome
- PMID: 36936296
- PMCID: PMC10018728
- DOI: 10.1021/acsomega.3c00020
Combined Multiomics and In Silico Approach Uncovers PRKAR1A as a Putative Therapeutic Target in Multi-Organ Dysfunction Syndrome
Abstract
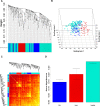
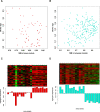
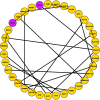
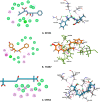
Despite all epidemiological, clinical, and experimental research efforts, therapeutic concepts in sepsis and sepsis-induced multi-organ dysfunction syndrome (MODS) remain limited and unsatisfactory. Currently, gene expression data sets are widely utilized to discover new biomarkers and therapeutic targets in diseases. In the present study, we analyzed MODS expression profiles (comprising 13 sepsis and 8 control samples) retrieved from NCBI-GEO and found 359 differentially expressed genes (DEGs), among which 170 were downregulated and 189 were upregulated. Next, we employed the weighted gene co-expression network analysis (WGCNA) to establish a MODS-associated gene co-expression network (weighted) and identified representative module genes having an elevated correlation with age. Based on the results, a turquoise module was picked as our hub module. Further, we constructed the PPI network comprising 35 hub module DEGs. The DEGs involved in the highest-confidence PPI network were utilized for collecting pathway and gene ontology (GO) terms using various libraries. Nucleotide di- and triphosphate biosynthesis and interconversion was the most significant pathway. Also, 3 DEGs within our PPI network were involved in the top 5 significantly enriched ontology terms, with hypercortisolism being the most significant term. PRKAR1A was the overlapping gene between top 5 significant pathways and GO terms, respectively. PRKAR1A was considered as a therapeutic target in MODS, and 2992 ligands were screened for binding with PRKAR1A. Among these ligands, 3 molecules based on CDOCKER score (molecular dynamics simulated-based score, which allows us to rank the binding poses according to their quality and to identify the best pose for each system) and crucial interaction with human PRKAR1A coding protein and protein kinase-cyclic nucleotide binding domains (PKA RI alpha CNB-B domain) via active site binding residues, viz. Val283, Val302, Gln304, Val315, Ile327, Ala336, Ala337, Val339, Tyr373, and Asn374, were considered as lead molecules.
© 2023 The Authors. Published by American Chemical Society.
Conflict of interest statement
The authors declare no competing financial interest.
Figures


Similar articles
-
An Integrative in silico Study to Discover Key Drivers in Pathogenicity of Focal and Segmental Glomerulosclerosis.Kidney Blood Press Res. 2022;47(6):410-422. doi: 10.1159/000524133. Epub 2022 Mar 18. Kidney Blood Press Res. 2022. PMID: 35306494
-
Essential Genes and MiRNA-mRNA Network Contributing to the Pathogenesis of Idiopathic Pulmonary Arterial Hypertension.Front Cardiovasc Med. 2021 May 5;8:627873. doi: 10.3389/fcvm.2021.627873. eCollection 2021. Front Cardiovasc Med. 2021. PMID: 34026864 Free PMC article.
-
Identification of key genes for hypertrophic cardiomyopathy using integrated network analysis of differential lncRNA and gene expression.Front Cardiovasc Med. 2022 Aug 4;9:946229. doi: 10.3389/fcvm.2022.946229. eCollection 2022. Front Cardiovasc Med. 2022. PMID: 35990977 Free PMC article.
-
Comprehensive analysis and identification of key genes and signaling pathways in the occurrence and metastasis of cutaneous melanoma.PeerJ. 2020 Nov 19;8:e10265. doi: 10.7717/peerj.10265. eCollection 2020. PeerJ. 2020. PMID: 33240619 Free PMC article.
-
The identification of key genes and pathways in hepatocellular carcinoma by bioinformatics analysis of high-throughput data.Med Oncol. 2017 Jun;34(6):101. doi: 10.1007/s12032-017-0963-9. Epub 2017 Apr 21. Med Oncol. 2017. PMID: 28432618 Free PMC article.
References
-
- Singer M.; Deutschman C. S.; Seymour C. W.; Shankar-Hari M.; Annane D.; Bauer M.; Bellomo R.; Bernard G. R.; Chiche J.-D.; Coopersmith C. M.; Hotchkiss R. S.; Levy M. M.; Marshall J. C.; Martin G. S.; Opal S. M.; Rubenfeld G. D.; van der Poll T.; Vincent J.-L.; Angus D. C. The Third International Consensus Definitions for Sepsis and Septic Shock (Sepsis-3). JAMA, J. Am. Med. Assoc. 2016, 315, 801.10.1001/jama.2016.0287. - DOI - PMC - PubMed
-
- Rudd K. E.; Johnson S. C.; Agesa K. M.; Shackelford K. A.; Tsoi D.; Kievlan D. R.; Colombara D. V.; Ikuta K. S.; Kissoon N.; Finfer S.; Fleischmann-Struzek C.; Machado F. R.; Reinhart K. K.; Rowan K.; Seymour C. W.; Watson R. S.; West T. E.; Marinho F.; Hay S. I.; Lozano R.; Lopez A. D.; Angus D. C.; Murray C. J. L.; Naghavi M. Global, Regional, and National Sepsis Incidence and Mortality, 1990-2017: Analysis for the Global Burden of Disease Study. Lancet 2020, 395, 200–211. 10.1016/S0140-6736(19)32989-7. - DOI - PMC - PubMed
-
- Schultz M. J.; Dunser M. W.; Dunser A. M.; Dondorp N. K. J.; Adhikari S.; Iyer A.; Kwizera Y.; Lubell A.; Papali L.; Pisani B. D.; Riviello D. C.; Angus L. C.; Azevedo T.; Baker J. V.; Diaz E.; Festic R.; Haniffa R.; Jawa S. T.; Jacob N.; Kissoon R.; Lodha I.; Martin-Loeches G.; Lundeg D.; Misango M.; Mer S.; Mohanty S.; Murthy N.; Musa J.; Nakibuuka A.; Serpa Neto M.; Nguyen Thi Hoang B.; Nguyen Thien R.; Pattnaik J.; Phua J.; Preller P.; Povoa S.; Ranjit D.; Talmor J.; Thevanayagam C. L.; Thwaites C. L. Current Challenges in the Management of Sepsis in ICUs in Resource-Poor Settings and Suggestions for the Future. Intensive Care Med. 2017, 43, 612–624. 10.1007/s00134-017-4750-z. - DOI - PubMed
LinkOut - more resources
Full Text Sources

