. 2023 Mar 16;14(1):1466.
doi: 10.1038/s41467-023-37159-8.

Integrated transcriptome study of the tumor microenvironment for treatment response prediction in male predominant hypopharyngeal carcinoma

Affiliations

Integrated transcriptome study of the tumor microenvironment for treatment response prediction in male predominant hypopharyngeal carcinoma

Yang Zhang et al. Nat Commun. .

Abstract

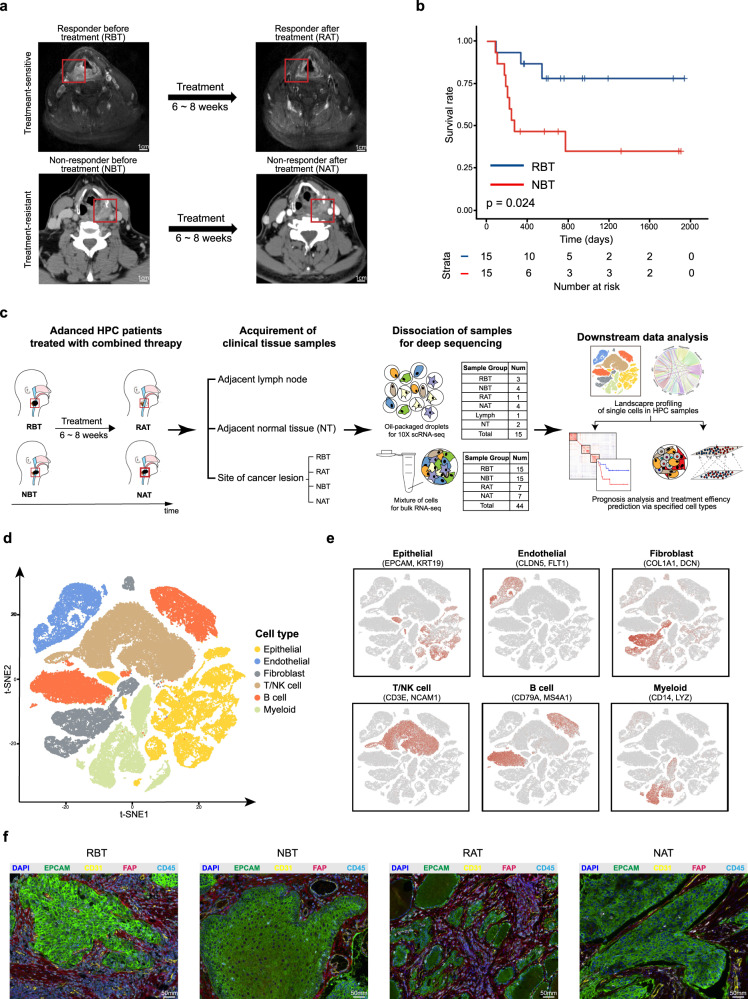
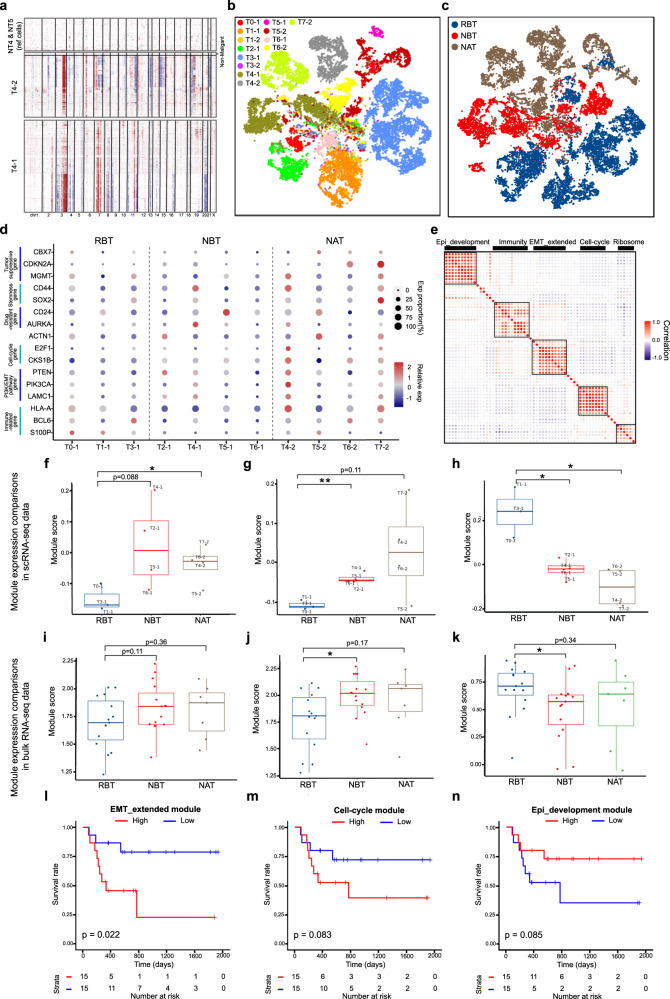
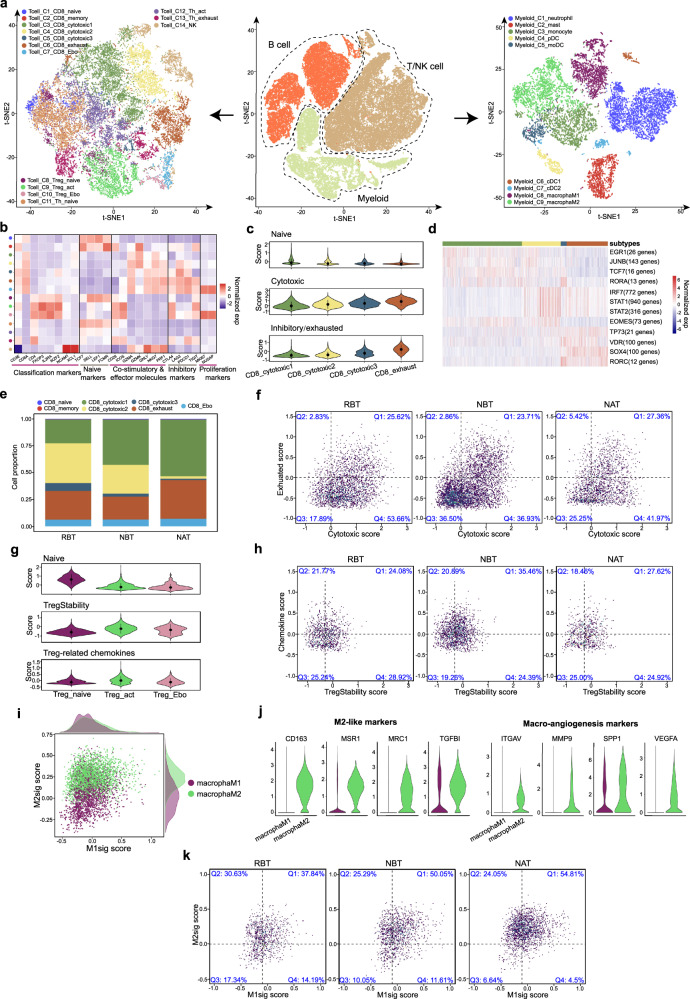
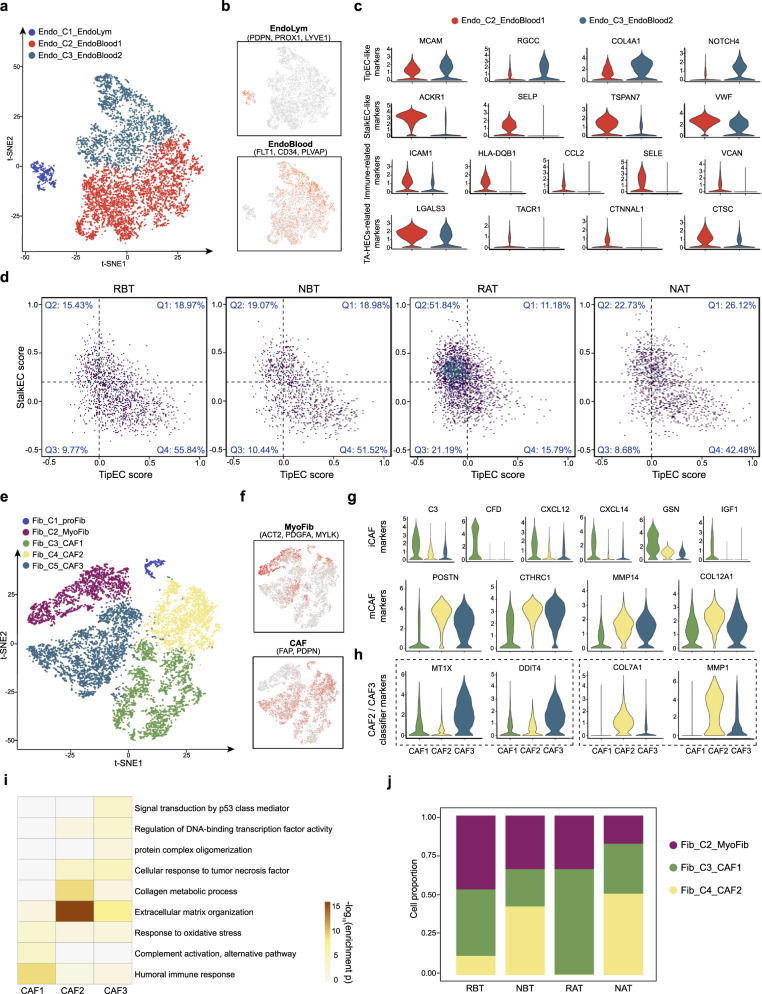
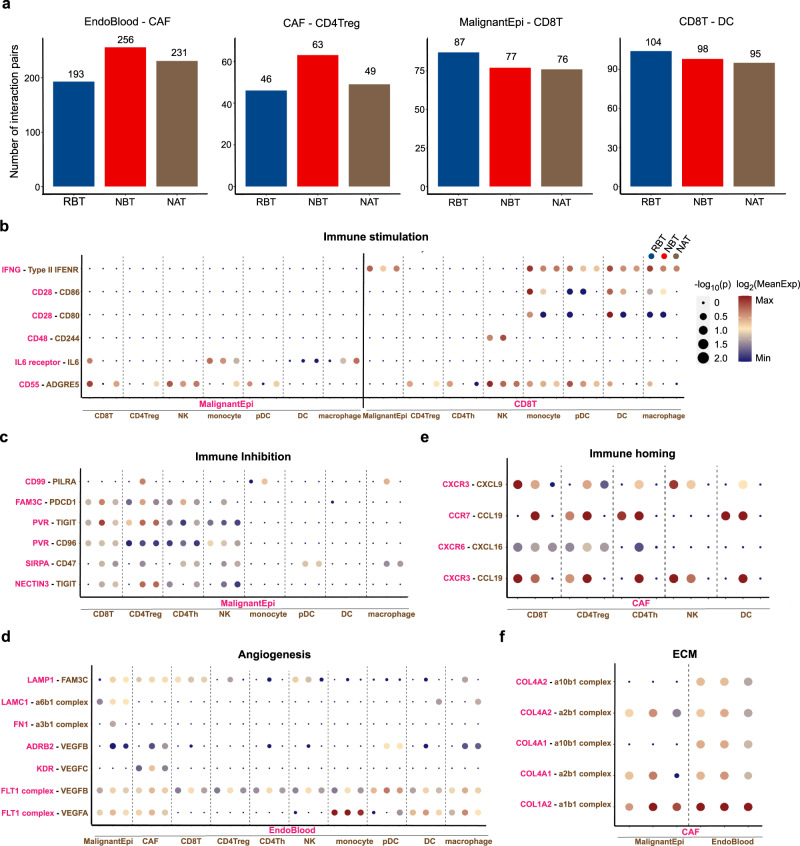
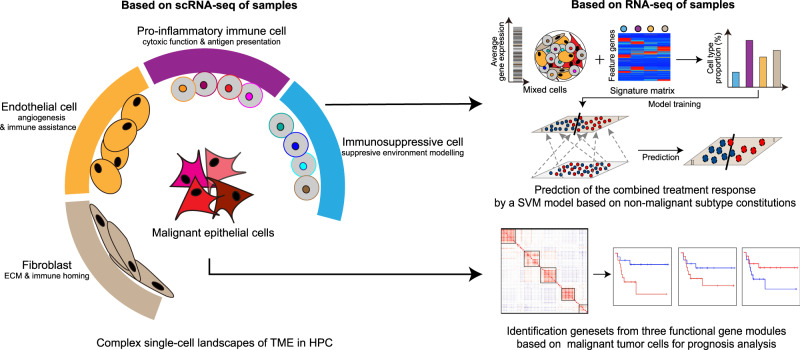
The efficacy of the first-line treatment for hypopharyngeal carcinoma (HPC), a predominantly male cancer, at advanced stage is only about 50% without reliable molecular indicators for its prognosis. In this study, HPC biopsy samples collected before and after the first-line treatment are classified into different groups according to treatment responses. We analyze the changes of HPC tumor microenvironment (TME) at the single-cell level in response to the treatment and identify three gene modules associated with advanced HPC prognosis. We estimate cell constitutions based on bulk RNA-seq of our HPC samples and build a binary classifier model based on non-malignant cell subtype abundance in TME, which can be used to accurately identify treatment-resistant advanced HPC patients in time and enlarge the possibility to preserve their laryngeal function. In summary, we provide a useful approach to identify gene modules and a classifier model as reliable indicators to predict treatment responses in HPC.


Conflict of interest statement

Two patents based on the study were submitted by Z.X., Y.Z., G.L., and M.T., which were entitled as “Featured gene sets based on scRNA-seq profiles of malignant tumor cells for the prognosis prediction of hypopharyngeal carcinoma” (application number, no 202310103758.7) and “A prediction method of the therapeutic efficacy for the combined treatment in advanced hypopharyngeal carcinoma based on the integration of single-cell and bulk transcriptome profiles” (application number, no 202310106947.X). The remaining authors declare no competing interests.

Figures

Fig. 1
Fig. 1. Clinical features and single-cell landscapes of collected HPC samples from different groups.
a Radiological features of patients with different responses to one cycle of the combined treatment enrolled in the study. Red boxes indicate the tumor lesions, and tags show the names of groups. b Kaplan–Meier plot of survival analysis for patients in RBT and NBT groups. P value was calculated by the log-rank test. c An experimental scheme diagram highlighting the overall study design and downstream analyses. d t-SNE plot of overall 89094 single cells grouped into six major cell types. Each dot represents one single cell, colored according to cell type. e Normalized expressions of canonical marker genes for each cell type. The depth of color from gray to red represents low to high expression. f Representative images of multiplex immunohistochemistry (mIHC) for HPC tumor samples from RBT, NBT, RAT, and NAT groups. Samples were performed with anti-EPCAM, anti-CD31, anti-FAP, and anti-CD45 antibodies for epithelial cells, endothelial cells, fibroblast cells and immune cells identification separately. DAPI was used as a nuclear counterstain. Images are representative of three biological replicates.
Fig. 2
Fig. 2. Characterization of functional gene modules from heterogeneous malignant tumor cells.
a Chromosomal landscape of inferred large-scale CNVs distinguishing malignant tumor cells from non-malignant epithelial cells in samples of T4-1 and T4-2. Amplifications (red) or deletions (blue) were inferred by averaging expression over 100-gene stretches on the indicated chromosomes. b t-SNE plot of 19207 malignant tumor cells colored by sample origins. c t-SNE plot of malignant tumor cells from RBT, NBT, and NAT colored by annotation groups. d Featured gene expression profiles of tumor cells across different samples from RBT, NBT, and NAT groups, separated by dashed vertical lines. e Heatmap depicting pairwise correlations of metagenes derived from 11 tumor samples from RBT, NBT and NAT groups. Clustering identified five underlying functional gene modules in malignant cells across samples. The dot size is proportional to the value of the correlation. Source data are provided as a Source Data file. fh Boxplots of module score in each sample across RBT (n = 3), NBT (n = 4) and NAT (n = 4) groups for EMT_extended module (f), Cell-cycle module (g), and Epi_development module (h) separately, using scRNA-seq data. ik Boxplots of module score in each sample across RBT (n = 15), NBT (n = 15), and NAT (n = 7) groups for EMT_extended module (i), Cell-cycle module (j) and Epi_development module (k) separately, using bulk RNA-seq data. P values were calculated by two-sided Student’s t test, P values ≤ 0.05 are represented as *, and ≤0.01 as **; the centers of boxplots correspond to median values, with the boxes and whiskers corresponding to the corresponding interquartile ranges and 1.5× interquartile ranges; colored dots denote each samples; source data are provided as a Source Data file (fk). ln Survival analyses of 30 patients from treatment-naive in our HPC cohort with high or low expression scores of EMT_extended module (l), Cell-cycle module (m), and Epi_development module (n) separately. Patients were stratified by the mean module scores. P values were calculated by log-rank test.
Fig. 3
Fig. 3. Detailed characterization of immune cells in TME of HPC.
a Identification of cell subtypes in immune cells. b Average gene expression heatmap of functional markers in T/NK subtypes. c Violin plots showing the expression scores of naive, cytotoxic, and inhibitory/exhausted signature gene sets of four CD8 + T-cell subtypes (n = 9989). Inside black points denote median values, and lines denote the corresponding interquartile ranges. d Heatmap showing the activity of TF regulons across four CD8 + T-cell subtypes. e Proportion differences of all CD8 + T subtypes among RBT, NBT, and NAT groups. f 2D density dot plots showing the changes of the cytotoxicity and exhaustion states of all CD8 + T cells among RBT, NBT and NAT groups. Cells were partitioned into four parts according to the mean scores of two states with quadrantal percentages shown in the plots. g Violin plots showing the expression scores of naive, TregStability and related chemokine signature gene sets of three CD4 + Treg cell subtypes (n = 4103). Inside black points denote median values and lines denote the corresponding interquartile ranges. Source data are provided as a Source Data file. h 2D density dot plots showing the changes of the TregStability and chemokines states of all Treg cells among RBT, NBT and NAT groups. Cells were partitioned into four parts according to the mean scores of two states, with quadrantal percentages shown in the plots. i Scatter plot showing the scores of M1 and M2 signatures for each macrophage cell. j Violin plots showing the expression levels of different marker genes between subtypes of macrophageM1 and macrophageM2. k 2D density dot plots showing the changes of the M1 and M2 signature states of all macrophages among RBT, NBT, and NAT groups. Cells were partitioned into four parts according to the mean scores of two states, with quadrantal percentages shown in the plots.
Fig. 4
Fig. 4. Detailed characterization of endothelial cells and fibroblasts in TME of HPC.
a t-SNE plot of endothelial cells annotated into three subtypes. Each dot represents one single cell, colored according to cell subtype. b Normalized expressions of canonical marker genes to distinguish lymphatic and vascular endothelium. The depth of color from gray to red represents low to high expression. c Violin plots showing the expression levels of TipEC-like, StalkEC-like, immune-related, and TA-HECs-related markers in subtypes of Endoblood1 and Endoblood2. d 2D density dot plots showing the changes of the StalkEC and TipEC states of Endoblood cells among RBT, NBT, and NAT groups. Cells were partitioned into four parts according to the mean scores of two states, with quadrantal percentages shown in the plots. e t-SNE plot of fibroblast cells annotated into five subtypes. Each dot representing one single cell, colored according to cell subtype. f Normalized expressions of canonical marker genes to distinguish MyoFib and CAF. The depth of color from gray to red represents low to high expression. g Violin plots showing the expression levels of iCAF and mCAF markers in subtypes of CAF1, CAF2, and CAF3. h Violin plots showing the expression levels of classifier markers among CAF1, CAF2, and CAF3. i Heatmap showing the selected signaling pathways (rows) with significant enrichment of GO and KEGG terms for CAF1, CAF2, and CAF3. Source data are provided as a Source Data file. j Cell proportion differences of three focused fibroblast subtypes among RBT, NBT, RAT, and NAT groups.
Fig. 5
Fig. 5. Comparison of intercellular interactions among three groups in HPC.
a Bar plots showing different intercellular interaction numbers among three groups for four cell type pairs, including EndoBlood and CAF, CAF and Treg, malignant epithelial (MalignantEpi) cells and CD8 + T cells, as well as CD8 + T cells and DCs. bf Selected ligand-receptor interaction profiles for five important biological functions, including immune stimulation (b), immune inhibition (c), angiogenesis (d), immune homing attracted by CAF (e), and extracellular matrix (ECM) modeling (f).The dot color from dark blue to dark red indicates the level of interaction. P values are presented by circle size (getting from one-sided permutation test). The means of the average expression levels of interacting molecule 1 in cluster 1 and interacting molecule 2 in cluster 2 are indicated by color. Source data are provided as a Source Data file.
Fig. 6
Fig. 6. Prediction of the combined treatment response based on non-malignant subtype compositions.
a Heatmap of the normalized cell abundance with fifteen subtypes estimated via CIBERSORTx and clinical records in our HPC cohort. All 44 samples from RBT, NBT, RAT, and NAT groups were deconvolved for estimation. b Average cell compositions in TME among four groups by dividing fifteen subtypes into two groups named as tumor-promoting subtypes and tumor-suppressive types. Error bars represent standard errors of cell constitutions in corresponding groups. The biological independent sample numbers in the four groups were 15, 15, 7, and 7, respectively. c Cartoon plot illustrating the processes for SVM construction from our HPC cohort and application for prospective trails in HPC. d Measurement for the prediction performance of SVM classifier model. The area under receive operating characteristic curve is 0.86 on the training samples. e Heatmap of the normalized cell abundance with 15 subtypes for additional 12 samples. Tag of correct represented the labels from prediction model and true clinical result were identical, while tag of incorrect represented the labels from the prediction model and true clinical result were different. A summary table was shown to summarize the separate and total correction rates. Source data are provided as a Source Data file. f Drug sensitivity of RO-3306 in malignant tumor cells among RBT, NBT, and NAT groups. t-SNE plots of tumor cells annotated into three groups (left top) and colored by normalized sensitivity scores (left bottom). Histogram plots show the distribution of normalized sensitivity scores for tumor cells in three groups, with dashed vertical lines representing the corresponding median scores. g Drug sensitivity of CAL-101 in malignant tumor cells among RBT, NBT and NAT groups. t-SNE plots of tumor cells annotated into three groups (left top) and colored by normalized sensitivity scores (left bottom). Histogram plots show the distribution of normalized sensitivity scores for tumor cells in three groups, with dashed vertical lines representing the corresponding median scores.
Fig. 7
Fig. 7. Schematic diagram of single-cell landscapes in HPC for analyses of prognosis and treatment response.
The complex landscape of TME in HPC was illustrated by high-solution scRNA-seq data, including heterogenous malignant tumor cells and various non-malignant cell types, which functioned in their specific ways. On the one hand, we established the relationship between functional gene sets from malignant cells for tumor prognosis inference. On the other hand, non-malignant cell compositions in TME deconvoluted from bulk RNA-seq data were trained for a quantitative SVM model to predict the response of combined treatments for advanced HPC patients with satisfactory correction rates.

Similar articles

Cited by

References

    1. Sung H, et al. Global cancer statistics 2020: GLOBOCAN estimates of incidence and mortality worldwide for 36 cancers in 185 countries. CA Cancer J. Clin. 2021;71:209–249. doi: 10.3322/caac.21660. - DOI - PubMed
    1. Curado MP, Hashibe M. Recent changes in the epidemiology of head and neck cancer. Curr. Opin. Oncol. 2009;21:194–200. doi: 10.1097/CCO.0b013e32832a68ca. - DOI - PubMed
    1. Cramer JD, Burtness B, Le QT, Ferris RL. The changing therapeutic landscape of head and neck cancer. Nat. Rev. Clin. Oncol. 2019;16:669–683. doi: 10.1038/s41571-019-0227-z. - DOI - PubMed
    1. Bradley PJ. Epidemiology of hypopharyngeal cancer. Adv. Otorhinolaryngol. 2019;83:1–14. - PubMed
    1. Garneau JC, Bakst RL, Miles BA. Hypopharyngeal cancer: a state of the art review. Oral. Oncol. 2018;86:244–250. doi: 10.1016/j.oraloncology.2018.09.025. - DOI - PubMed

Publication types