. 2023 Oct;17(10):1981-1999.
doi: 10.1002/1878-0261.13419. Epub 2023 Mar 27.

Ebselen oxide and derivatives are new allosteric HER2 inhibitors for HER2-positive cancers

Affiliations

Ebselen oxide and derivatives are new allosteric HER2 inhibitors for HER2-positive cancers

Lucas Blasquez et al. Mol Oncol. 2023 Oct.

Abstract

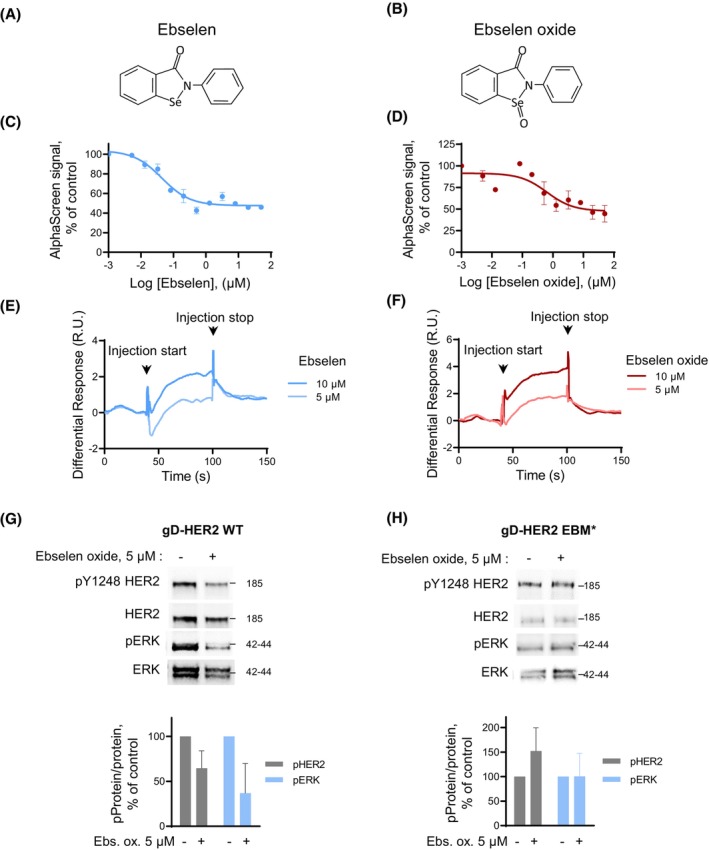
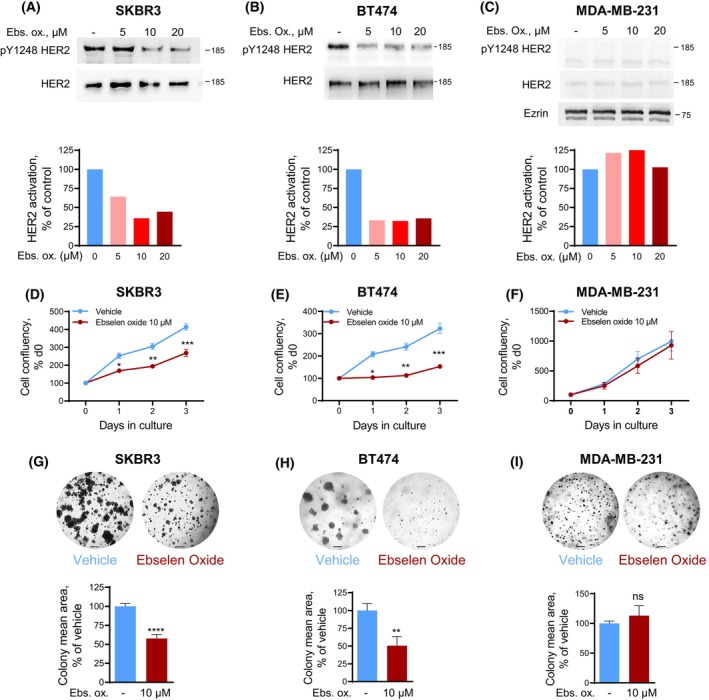
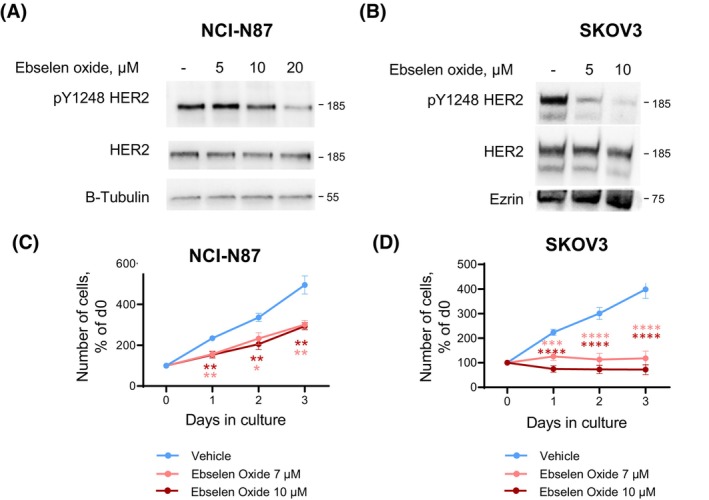
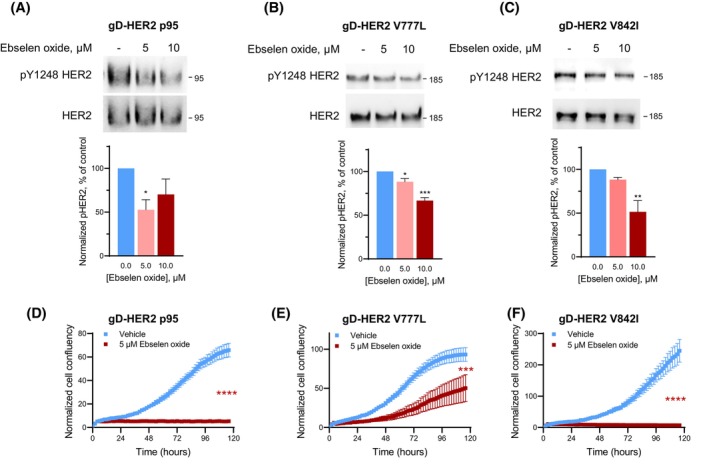
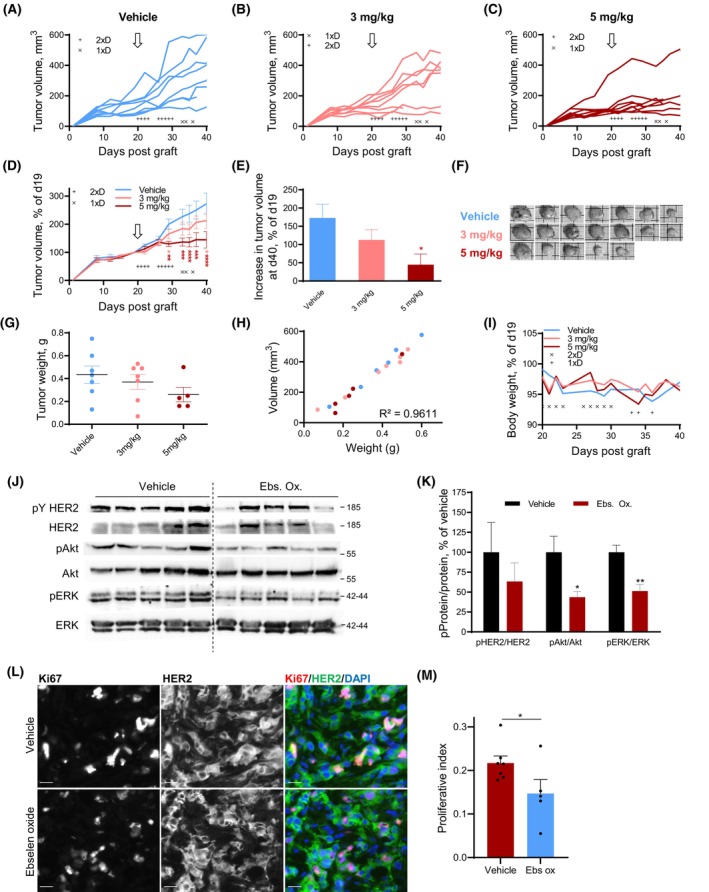
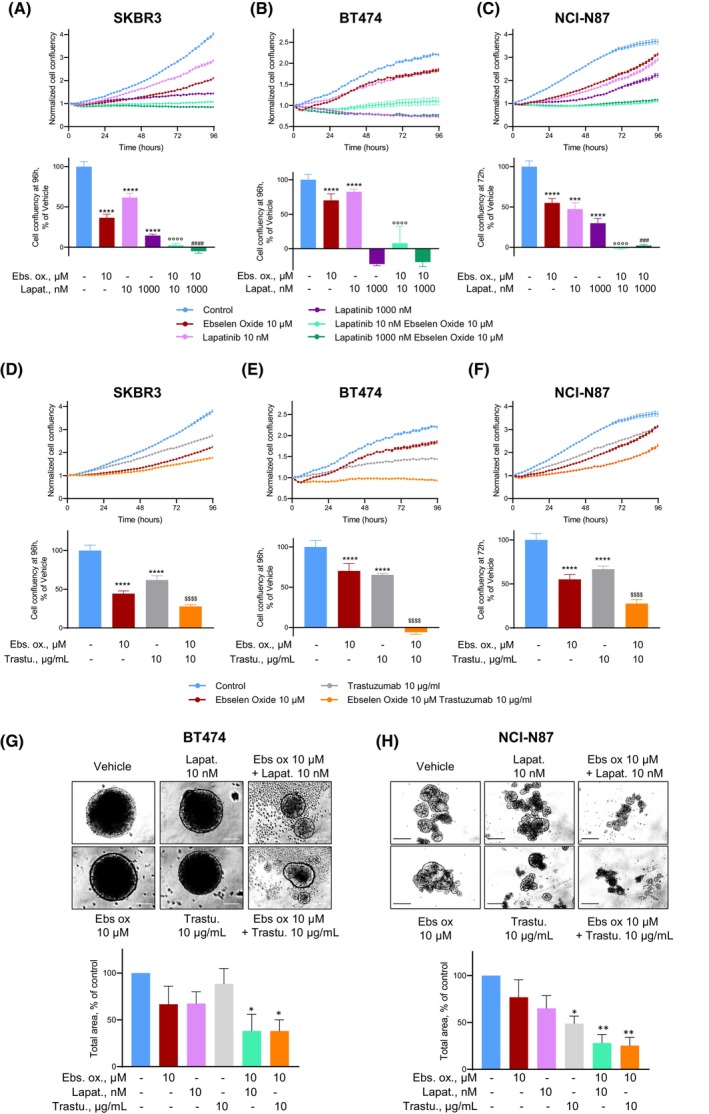
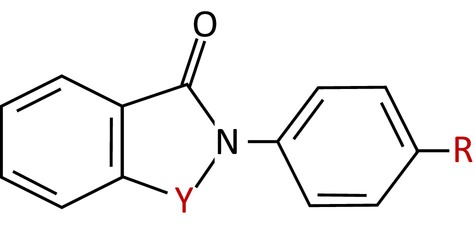
Human epidermal growth factor receptor 2 (ErbB2/HER2) is a tyrosine kinase receptor that is overexpressed in 25% of primary human breast cancers, as well as in multiple other cancers. HER2-targeted therapies improved progression-free and overall survival in patients with HER2+ breast cancers. However, associated resistance mechanisms and toxicity highlight the need for new therapeutic approaches for these cancers. We recently established that, in normal cells, HER2 is stabilized in a catalytically repressed state by direct interaction with members of the ezrin/radixin/moesin (ERM) family. In HER2-overexpressing tumors, the low expression of moesin contributes to the aberrant activation of HER2. Through a screen designed to find moesin-mimicking compounds, we identified ebselen oxide. We show that ebselen oxide, and some derivatives, conferred an efficient allosteric inhibition of overexpressed HER2, as well as mutated and truncated oncogenic forms of HER2, which are resistant to current therapies. Ebselen oxide selectively inhibited anchorage-dependent and -independent proliferation of HER2+ cancer cells and showed a significant benefit in combination with current anti-HER2 therapeutic agents. Finally, ebselen oxide significantly blocked HER2+ breast tumor progression in vivo. Collectively, these data provide evidence that ebselen oxide is a newly identified allosteric inhibitor of HER2 to be considered for therapeutic intervention on HER2+ cancers.

Keywords: HER2 tyrosine kinase receptor; additive effects; breast cancer; resistance; small molecule inhibitor; targeted therapy.


Conflict of interest statement

The authors declare no conflict of interest.

Figures

Fig. 1
Fig. 1
Ebselen oxide inhibits HER2 activation through binding to the ERM‐binding motif in the cytosolic juxtamembrane region of HER2. (A, B) Chemical structures of ebselen (A) and ebselen oxide (B). (C, D) Dose‐dependent inhibition of the interaction between the biotinylated peptide coding for the cytosolic juxtamembrane regions of HER2 (biot‐JMHER2, 5 nm) and the N‐terminal FERM domain of ezrin (GST‐FERME, 156 μm) in the presence of ebselen (C) or ebselen oxide (D) at increasing concentrations (0–50 μm) for 20 h measured by AlphaScreen®. A representative experiment is shown where data are mean ± sem (n = 2) out of 3 (C) or 2 (D) independent experiments. (E, F) Sensorgrams showing binding of ebselen (E) and ebselen oxide (F) to biot‐JMHER2 immobilized on a streptavidin‐coated sensor chip (surface immobilization level of 401 RU). Arrows indicate the beginning and the end of the injection. A representative experiment is shown out of 3 (E) or 2 (F) independent experiments. (G, H) Lysates from HBMECs transfected with vectors encoding gD‐tagged wild‐type HER2 (gD‐HER2‐WT) (G) or the mutant generated with alanine and glycine substitutions within the ERM‐binding motif (gD‐HER2‐EBM*) (H) and treated or not during 24 h with 5 μm ebselen oxide were analyzed by western blot using antibodies against activated HER2 (pY1248), HER2, activated ERK (pERK), and ERK. Representative blots and quantification of data are shown where data are mean ± sem [n = 3 (G); n = 2 (H)].
Fig. 2
Fig. 2
Ebselen oxide inhibits HER2 activation, cell proliferation, and anchorage‐independent growth of HER2+ breast cancer cells. (A–C) Lysates from HER2‐positive (SKBR3, A and BT474, B) or HER2‐negative (MDA‐MB‐231, C) breast cancer cells treated with ebselen oxide (0–20 μm) were analyzed by western blot using antibodies against pY1248 HER2, HER2 and ezrin and the optical density was quantified. Blot and quantification of a representative experiment are shown out of 4 (A), 5 (B), or 2 (C) independent experiments. (D–F) Proliferation curves of HER2‐positive (SKBR3, D or BT474, E) or HER2‐negative (MDA‐MB‐231, F) breast cancer cell lines treated with vehicle or 10 μm ebselen oxide assessed by MTT assay. A representative experiment is shown out of 5 (D), 4 (E), or 4 (F) independent experiments where data are mean ± SEM; 2‐way ANOVA (mixed‐effect analysis) followed by Bonferroni's multiple comparison test, *P < 0.05, **P < 0.01, ***P < 0.001. (G–I) Anchorage‐independent growth of SKBR3 (G), BT474 (H), or MDA‐MB‐231 (I) cells treated with vehicle or 10 μm ebselen oxide. Representative images and quantification of the colony mean area are shown where data are mean ± SEM (n = 2), unpaired t test, ****P < 0.0001 (n = 4–12) (G); (n = 2), unpaired t test, **P < 0.01 (n = 6–9 replicates) (H); (n = 2), unpaired t test, ns P = 0.4325 (n = 6–7 replicates) (I). Scale bars are 200 μm.
Fig. 3
Fig. 3
Ebselen oxide inhibits HER2 activation and HER2‐dependent proliferation in gastric and ovarian HER2+ cancer cells. (A) HER2‐positive NCI‐87 gastric cancer cells were treated with ebselen oxide (0–20 μm) for 24 h, lysed, and analyzed by western blot using anti‐pY1248‐HER2, HER2, and β‐tubulin antibodies. A representative western blot is shown out of 4 independent experiments. (B) HER2‐positive SKOV3 ovarian cancer cells were treated with ebselen oxide (0–10 μm) for 24 h, lysed, and analyzed by western blot using anti‐pY1248‐HER2, HER2, and ezrin antibodies. A western blot is shown (n = 1). (C, D) Proliferation curves of NCI‐N87 gastric (C) or SKOV3 ovarian (D) cancer cells treated with vehicle or 7–10 μm ebselen oxide measured by MTT assay. Data are mean ± SEM (n = 9–12) of three independent experiments. Where two‐way ANOVA followed by Dunnett's multiple comparison test, *P < 0.05, **P < 0.01, ***P < 0.001, and ****P < 0.0001.
Fig. 4
Fig. 4
Oncogenic p95, V777L, and V842I forms of HER2 are sensitive to treatment by ebselen oxide. (A–F) HBMECs transfected with vectors encoding gD‐tagged p95 (A, D), V777L (B, E), or V842I (C, F) HER2 altered forms were treated or not during 24 h with 5–10 μm ebselen oxide. (A–C) Lysates were then analyzed by western blot using antibodies against pY1248 HER2 and HER2. Representative blot and data quantification (mean ± SEM) are shown out of 3 (A), 3 (B), or 4 (C) independent experiments. One‐way ANOVA followed by Dunnett's multiple comparison test, *P < 0.05, **P < 0.01, ***P < 0.001. (D–F) Proliferation was assessed by Incucyte during 5 days. Data are mean ± SEM of a representative experiment out of two independent experiments. Two‐way ANOVA followed by Bonferroni's multiple comparison test, ***P < 0.001, ****P < 0.0001.
Fig. 5
Fig. 5
Ebselen oxide blocks the progression of HER2‐positive breast tumors in vivo. (A–L) 5 × 106 BT474 cells were orthotopically implanted in the mammary fat pad of NOD.Cg‐Prkdc scid/J mice, together with estradiol supplement. After 19 days, mice were randomized into three groups (n = 8 mice per group) and administered intraperitoneally with ebselen oxide (3 or 5 mg·kg−1) once (1 × D) or twice (2 × D) a day, as indicated for 5 days a week or vehicle (10% DMSO in PBS) during 3 weeks. (A–C) Individual tumor volume monitoring of vehicle‐ or ebselen oxide‐treated mice, as specified. Treatment schedule is indicated by × (once a day) or + (twice a day). The beginning of the treatment is indicated by an arrow. (D) Mean tumor volume of vehicle‐ or ebselen oxide‐treated mice, normalized to the initial volume at day 19. Data are mean ± SEM; two‐way ANOVA (mixed‐effect analysis) followed by Dunnett's multiple comparison test, *P < 0.05, **P < 0.01, ***P < 0.001, ****P < 0.0001. The beginning of the treatment is indicated by an arrow. (E) Increase in tumor volume at day 40 compared with day 19 for each condition. Data are mean ± SEM; one‐way ANOVA followed by Dunnett's multiple comparison test, *P < 0.05. (F) Pictures of tumors collected at the end of the experiment. (G) Scatter plot of final tumor weight displaying mean ± SEM; one‐way ANOVA followed by Bonferroni's multiple comparison test, P = 0.2682. (H) Analysis of the correlation between individual tumor volume and tumor weight. Pearson correlation analysis, r 2 = 0.9611. (I) Mean mice weight monitored 3 times a week during the treatment. Treatment schedule is indicated by × (once a day) or + (twice a day). (J) Western blot analysis of the tumor lysates from vehicle‐ or ebselen oxide‐treated mice (5 mg·kg−1) (n = 5 mice per group) using antibodies directed against activated HER2 (pY HER2), HER2, activated Akt (pAkt), Akt, activated ERK (pERK), ERK. (K) Quantification of the results presented in G where data are mean ± SEM (n = 5), unpaired t test *P < 0.05, **P < 0.01. (L) Representative images of tumor sections from vehicle‐ or ebselen oxide‐treated mice (5 mg·kg−1) immunolabeled with anti‐Ki67 (red) and anti‐HER2 (green) antibodies and counterstained with DAPI (blue). Scale bar is 20 μm. (M) Quantification of the proliferation index in sections from vehicle‐ or ebselen oxide‐treated mice (5 mg·kg−1) immunolabeled with anti‐Ki67 and anti‐HER2 antibodies and counterstained with DAPI where data are mean ± SEM (vehicle n = 7; ebselen oxide n = 5), unpaired t test *P < 0.05.
Fig. 6
Fig. 6
Additive effects of known anti‐HER2 agent and ebselen oxide. (A–C) Proliferation curves of HER2‐positive (SKBR3, A; BT474, B; NCI‐N87, C) cancer cell lines treated or not with ebselen oxide (10 μm), lapatinib (10–1000 nm), or combination of these agents, as indicated. Proliferation was assessed overtime by Incucyte during 4 days. Data are mean ± SD (n = 8–12) of a representative experiment out of 4 (A), 3 (B), or 2 (C) independent experiments. One‐way ANOVA followed by Sidak multiple comparison test, (*, compared with Vehicle; ° and #, respectively, compared with lapatinib 10 and 1000 nm) ***P < 0.001, ****P < 0.0001. (D‐F) Proliferation curves of HER2‐positive (SKBR3, D; BT474, E; NCI‐N87, F) cancer cell lines treated or not with ebselen oxide (10 μm), trastuzumab (10 μg·mL−1), or combination of these agents, as indicated. Proliferation was assessed by Incucyte during 4 days. Data are mean ± SD (n = 8–12) of a representative experiment out of two independent experiments. One‐way ANOVA followed by Sidak multiple comparison test, (*, compared with Vehicle; $, compared with trastuzumab) ***P < 0.001, ****P < 0.0001. (G, H) Anchorage‐independent growth of HER2‐positive (BT474, G or NCI‐N87, H) cancer cells treated or not ebselen oxide (10 μm), lapatinib (10 nm), trastuzumab (10 μg·mL−1), or a combination of these agents, as indicated. Images of a representative experiment out of 3 (G) or 4 (H) independent experiments and quantification of the colony total area are shown where data are mean ± SEM. One‐way ANOVA followed by multiple comparison test, *P < 0.05, **P < 0.01. Scale bars are 100 μm.
Fig. 7
Fig. 7
Pharmacophore of Ebselen‐like HER2 inhibitors. Structure of the defined pharmacophore of ebselen‐like HER2 inhibitors, where atoms in position Y can be either selenium (S) or selenium oxide (Se=O), and either hydrogen (H), chlorine (Cl), or methyl (CH3) but not methoxy group (OMe) nor trifluoromethyl (CF3) on position R.

Similar articles

Cited by

References

    1. Venur VA, Leone JP. Targeted therapies for brain metastases from breast cancer. Int J Mol Sci. 2016;17:1543. 10.3390/ijms17091543 - DOI - PMC - PubMed
    1. Kreutzfeldt J, Rozeboom B, Dey N, De P. The trastuzumab era: current and upcoming targeted HER2+ breast cancer therapies. American journal of cancer research. 2020;10:1045–67. - PMC - PubMed
    1. Montor WR, Salas A, Melo FHM. Receptor tyrosine kinases and downstream pathways as druggable targets for cancer treatment: the current arsenal of inhibitors. Mol Cancer. 2018;17:55. 10.1186/s12943-018-0792-2 - DOI - PMC - PubMed
    1. Chumsri S, Sperinde J, Liu H, Gligorov J, Spano JP, Antoine M, et al. High p95HER2/HER2 ratio associated with poor outcome in trastuzumab‐treated HER2‐positive metastatic breast cancer NCCTG N0337 and NCCTG 98–32‐52 (alliance). Clin Cancer Res. 2018;24:3053–8. 10.1158/1078-0432.CCR-17-1864 - DOI - PMC - PubMed
    1. Saez R, Molina MA, Ramsey EE, Rojo F, Keenan EJ, Albanell J, et al. p95HER‐2 predicts worse outcome in patients with HER‐2‐positive breast cancer. Clin Cancer Res. 2006;12:424–31. - PubMed

Publication types

MeSH terms