. 2023 Feb 22:17:1069198.
doi: 10.3389/fnins.2023.1069198. eCollection 2023.

A neural circuit for gastric motility disorders driven by gastric dilation in mice

Affiliations

A neural circuit for gastric motility disorders driven by gastric dilation in mice

Xi-Yang Wang et al. Front Neurosci. .

Abstract

Introduction: Symptoms of gastric motility disorders are common clinical manifestations of functional gastrointestinal disorders (FGIDs), and are triggered and exacerbated by stress, but the neural pathways underpinning them remain unclear.

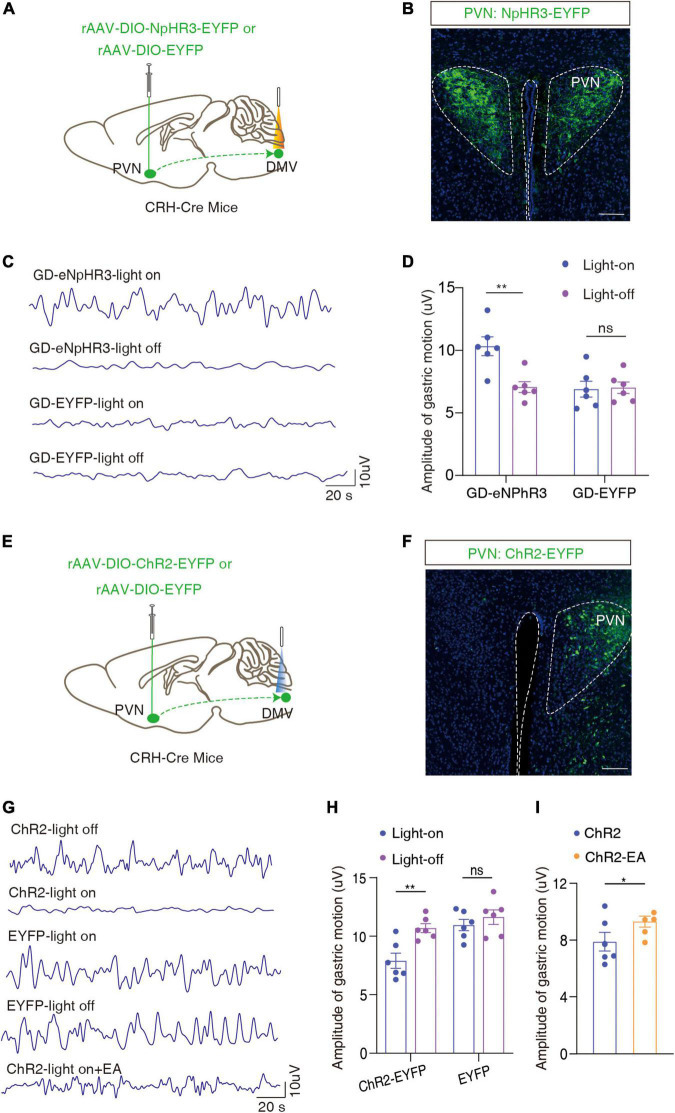
Methods: We set-up a mouse model by gastric dilation (GD) in which the gastric dynamics were assessed by installing strain gauges on the surface of the stomach. The neural pathway associated with gastric motility disorders was investigated by behavioral tests, electrophysiology, neural circuit tracing, and optogenetics and chemogenetics involving projections of the corticotropin-releasing hormone (CRH) from the paraventricular nucleus of the hypothalamus (PVN) to acetylcholine (ChAT) neurons in the dorsal motor nucleus of the vagus (DMV).

Results: We found that GD induced gastric motility disorders were accompanied by activation of PVN CRH neurons, which could be alleviated by strategies that inhibits the activity of PVN CRH neurons. In addition, we identified a neural pathway in which PVN CRH neurons project into DMV ChAT neurons, modulated activity of the PVN CRH →DMV ChAT pathway to alleviate gastric motility disorders induced by GD.

Discussion: These findings indicate that the PVN CRH →DMV ChAT pathway may mediate at least some aspects of GD related gastric motility, and provide new insights into the mechanisms by which somatic stimulation modulates the physiological functions of internal organs and systems.

Keywords: corticotropin-releasing hormone; dorsal motor nucleus of the vagus; gastric motility disorders; neural circuit; paraventricular nucleus of the hypothalamus.


Conflict of interest statement

The authors declare that the research was conducted in the absence of any commercial or financial relationships that could be construed as a potential conflict of interest.

Figures

FIGURE 1
FIGURE 1
Functional connectivity between hypothalamus and brainstem was increased in subjects with water-loaded-GD state following EA. (A) Representative images of brain regions (brainstem) with changes in hypothalamic functional connectivity before and after EA. (B) The specific values of changes in hypothalamic-brainstem functional connectivity before and after EA. (C) EA-induced hypothalamic-brainstem (r = 0.583, P = 0.004) was positively correlated with changes in EGG amplitude, EGG, electrogastrogram.
FIGURE 2
FIGURE 2
GD increases PVNCRH neuronal activity in mice. (A) Schematic of the fiber photometry setup. Ca2+ transients were recorded from GCaMP6s-expressing PVNCRH neurons in mice. (B) Typical images showing the injection site within the PVN by rAAV-CRH–GCaMP6s, scale bar 100 μm. (C,D) The mean (left) and the heatmaps (right) show that Ca2+ signals rapidly increased in gastric dilation (GD) state compared with normal state in mice. The colored bar on the right indicates ΔF/F (%). Each line in the heat map represents one experiment with one mouse. (E,F) The mean (left) and heat map (right) show that the Ca2+ signal decreases rapidly in GD mice upon acupuncture stimulation. EA is the abbreviation for acupuncture stimulation. (G) Representative images of C-fos and corticotropin-releasing hormone (CRH) expression in the PVN of various groups of mice. GD: gastric dilation group; EA: electroacupuncture group, scale bar 50 μm. (H) The C-fos and CRH co-labeling rate statistics for each group, n = 6 mice per group, one-way ANOVA, Control vs. GD (t = 6.581, P < 0.0001); EA vs. GD (t = 2.524, P = 0.0226). (I,J) Sample traces (I) and data (J) of firing rates recorded from PVNCRH neurons of mice treated in control group, GD group and EA group. n = 10 cells from six mice per group, two-way ANOVA, Control vs. GD [F(1,18) = 13.50, P = 0.0017]; EA vs. GD [F(1, 18) = 4.703, P = 0.0438]. *P < 0.05, **P < 0.01, ****P < 0.0001.
FIGURE 3
FIGURE 3
Chemogenetic inhibition of PVNCRH neuronal activity alleviates GD-induced gastric motility disorders. (A) Schematic of chemogenetic experiments in CRH-Cre mice. (B) Typical images showing the injection site within the PVN by inhibition chemogenetic virus. Scale bars, 100 μm. (C) Membrane potential change induced by CNO, n = 5 cells from five mice for each group, two-way ANOVA, F(1, 8) = 48.89, P = 0.0001. Action potentials induced by CNO in neurons with red fluorescence in the PVN region were recorded on brain slices containing hm4Di-mCherry and those containing mCherry, respectively. (D) Representative graphs of gastric motility in various groups of mice. (E) Effects of chemogenetic inhibition of PVNCRH neurons on gastric motility in GD mice, n = 6 mice in each group, one-way ANOVA, t = 4.064, P = 0.0181. (F) Schematic of chemogenetic experiments in CRH-Cre mice. (G) Typical images showing the injection site within the PVN by activated chemogenetic virus. Scale bars, 100 μm. (H) Membrane potential change induced by CNO, n = 5 cells from five mice per group, two-way ANOVA, F(1, 8) = 45.52, P = 0.0001. (I) Representative graphs of gastric motility in various groups of mice. (J) Effect of chemogenetic activation of PVNCRH neurons on gastric motility in normal mice. n = 6 mice in each group, one-way ANOVA, t = 3.901, P = 0.023. *P < 0.05, ***P ≤ 0.0001.
FIGURE 4
FIGURE 4
Dissection of the PVNCRH to DMVChAT pathway. (A) Schematic of PVN injection of rAAV-DIO-ChR2-EYFP in CRH-Cre mice. (B) Representative image of EYFP labeling neurons by PVN infusion of rAAV-DIO-ChR2-EYFP. Scale bar, 100 μm. (C) Images representative of ChR2-EYFP+ fibers in DMV of CRH-Cre mice with PVN injection of rAAV-DIO-ChR2-EYFP (left) and ChR2-EYFP+ fibers co-localized with acetylcholine neuronal markers (ChAT) immunofluorescence within the DMV (right). Scale bars, 50 μm (left) or 50 μm (right-top) or 20 μm (right-bottom). (D) Schematic of DMV injection of scAAV2/R-hSyn-EGFP in C56BL/6 mice. (E) Representative image of scAAV2/R-hSyn-EGFP+ neurons and fibers, which co-localized with acetylcholine neuronal markers (ChAT) immunofluorescence in DMV. Scale bars, 100 μm (top) or 50 μm (bottom). (F) Representative image of EGFP+ neurons in PVN, which co-localized with CRH immunofluorescence. Scale bars, 100 μm (top) or 20 μm (bottom). (G) Schematic of PVN injection of rAAV-DIO-ChR2-EYFP and the recording configuration in acute slices. (H) Representative image injection site and viral expression within the PVN of CRH-Cre mice with PVN infusion of rAAV-DIO-ChR2-EYFP. Scale bar, 100 μm. (I) Sample traces of action potentials evoked by blue light (473 nm, 5–8 mV, pulse width 10 Mm, stimulation frequencies 5 Hz, 10 Hz, 20 Hz) recorded from PVN EYFP+ neurons in acute brain slices. (J) Schematic of PVN injection of rAAV-DIO-ChR2-EYFP in CRH-Cre mice and the recording configuration in acute slices. (K) Representative traces of light-evoked currents (473 nm, 20 ms, blue bar) before and after PTX (10 μM) treatment recorded from the DMV neurons. (L) Summarized data of light-evoked currents (473 nm, 20 ms) before and after PTX (10 μM) treatment recorded from the DMV neurons, n = 6 cells from six mice per group, paired t-test, t = 9.997, P = 0.0002. ***P < 0.001.
FIGURE 5
FIGURE 5
Optogenetic modulation of the PVNCRH → DMVChAT pathway alleviates GD-mediated gastric motility disorders. (A) Schematic of optogenetic experiments in CRH-Cre mice. (B) Representative image of EYFP+ neurons by PVN infusion of rAAV-DIO-NpHR3-EYFP or rAAV-DIO-EYFP. Scale bar, 100 μm. (C) Representative graphs of gastric motility in various groups of mice. (D) Effects of optogenetic inhibition of PVNCRH neurons on gastric motility in GD mice, n = 6 mice in each group, two-way ANOVA, F1,10 = 13.33, P = 0.0045. (E) Schematic of optogenetic experiments in CRH-Cre mice. (F) Representative image of EYFP+ neurons by PVN infusion of rAAV-DIO-ChR2-EYFP or rAAV-DIO-EYFP. Scale bar, 100 μm. (G) Representative graphs of gastric motility in various groups of mice. (H) Effects of optogenetic activation of PVNCRH neurons on gastric motility in normal mice, n = 6 mice in each group, two-way ANOVA, F(1,10) = 20.51, P = 0.0011. (I) Effect of EA intervention on gastric motility based on optogenetic activation of PVNCRH neurons in normal mice. n = 6 mice in each group, paired t-text, t = 2.683, P = 0.0437. *P < 0.05, **P < 0.01.

Similar articles

Cited by

References

    1. Benarroch E. E. (2005). Paraventricular nucleus, stress response, and cardiovascular disease. Clin. Auton. Res. 15 254–263. 10.1007/s10286-005-0290-7 - DOI - PubMed
    1. Bonaz B., Bazin T., Pellissier S. (2018). The vagus nerve at the interface of the microbiota-gut-brain axis. Front. Neurosci. 12:49. 10.3389/fnins.2018.00049 - DOI - PMC - PubMed
    1. Browning K. N., Babic T., Toti L., Holmes G. M., Coleman F. H., Travagli R. A. (2014). Plasticity in the brainstem vagal circuits controlling gastric motor function triggered by corticotropin releasing factor. J. Physiol. 592 4591–4605. 10.1113/jphysiol.2014.278192 - DOI - PMC - PubMed
    1. Browning K. N., Travagli R. A. (2010). Plasticity of vagal brainstem circuits in the control of gastric function. Neurogastroenterol. Motil. 22 1154–1163. 10.1111/j.1365-2982.2010.01592.x - DOI - PMC - PubMed
    1. Browning K. N., Travagli R. A. (2014). Central nervous system control of gastrointestinal motility and secretion and modulation of gastrointestinal functions. Compr. Physiol. 4 1339–1368. 10.1002/cphy.c130055 - DOI - PMC - PubMed

Grants and funding

This work was supported by the National Natural Science Foundation of China (grant nos. 81973936 and 81904095) and Anhui Province Scientific Research Planning Project (grant no. 2022AH050438).

LinkOut - more resources