. 2023 Mar 3;24(5):4944.
doi: 10.3390/ijms24054944.

Human Neuromuscular Junction on a Chip: Impact of Amniotic Fluid Stem Cell Extracellular Vesicles on Muscle Atrophy and NMJ Integrity

Affiliations

Human Neuromuscular Junction on a Chip: Impact of Amniotic Fluid Stem Cell Extracellular Vesicles on Muscle Atrophy and NMJ Integrity

Martina Gatti et al. Int J Mol Sci. .

Abstract

Neuromuscular junctions (NMJs) are specialized synapses, crucial for the communication between spinal motor neurons (MNs) and skeletal muscle. NMJs become vulnerable in degenerative diseases, such as muscle atrophy, where the crosstalk between the different cell populations fails, and the regenerative ability of the entire tissue is hampered. How skeletal muscle sends retrograde signals to MNs through NMJs represents an intriguing field of research, and the role of oxidative stress and its sources remain poorly understood. Recent works demonstrate the myofiber regeneration potential of stem cells, including amniotic fluid stem cells (AFSC), and secreted extracellular vesicles (EVs) as cell-free therapy. To study NMJ perturbations during muscle atrophy, we generated an MN/myotube co-culture system through XonaTM microfluidic devices, and muscle atrophy was induced in vitro by Dexamethasone (Dexa). After atrophy induction, we treated muscle and MN compartments with AFSC-derived EVs (AFSC-EVs) to investigate their regenerative and anti-oxidative potential in counteracting NMJ alterations. We found that the presence of EVs reduced morphological and functional in vitro defects induced by Dexa. Interestingly, oxidative stress, occurring in atrophic myotubes and thus involving neurites as well, was prevented by EV treatment. Here, we provided and validated a fluidically isolated system represented by microfluidic devices for studying human MN and myotube interactions in healthy and Dexa-induced atrophic conditions-allowing the isolation of subcellular compartments for region-specific analyses-and demonstrated the efficacy of AFSC-EVs in counteracting NMJ perturbations.

Keywords: amniotic fluid stem cells; extracellular vesicles; muscle atrophy; neuromuscular junction; oxidative stress.


Conflict of interest statement

The authors declare no conflict of interest.

Figures

Figure 1
Figure 1
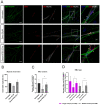
Effect of human AFSC-EV supplementation on in vitro model of hMAB-myotube atrophy. (A) Representative images of hMAB-derived myotubes, treated or not with Dexamethasone and AFSC-EVs, stained with myosin heavy chain (MyHC) (red) and DAPI (blue) for nuclei. Scale bars: 50 µm. Graphs relative to analysis of fusion index%, nuclei per myotube, and myotube thickness. Graph data are the mean ± SD (3 biological replicates, 4 fields each replicate). °,* p value < 0.05, ** p value < 0.01, *** p value < 0.001. (B) Graph showing ROS content in myotubes, pre-treated or not with AFSC-EVs for 24 h, measured from 20 to 30 min after Dexamethasone exposure using DCFH-DA probe. Data shown are the mean ± SD (n = 5). Untreated vs. Dexa 20 µM: *** p value < 0.001, Untreated vs. Dexa+AFSC-EVs: ** p value < 0.01 Dexa 20 µM vs. Dexa+AFSC-EVs: °° p value < 0.01. (C) Gene expression comparisons among differentiated hMABs (Untreated), Dexa 20 µM, and Dexa+AFSC-EVs. Data shown are the mean ± SD (n = 3). °,* p value < 0.05, **,°° p value < 0.01, ***,°°° p value < 0.001, ****,°°°° p value < 0.0001.
Figure 2
Figure 2
Schematic overview of microfluidic device structure and treatment. Created with BioRender.com (Accessed on 23 February 2023).
Figure 3
Figure 3
Neurite and hMAB-derived myotube density inside the muscle compartment of microfluidic devices. (A) Representative tile scan confocal overviews and quantification graphs of hMAB-derived myotubes (MyHC) into the muscle compartment after Dexa and AFSC-EV treatments. Scale bars: 400 µm. Graph data are the mean ± SD (n = 3). °,* p value < 0.05, °° p value < 0.01 (B) Representative tile scan confocal overviews and quantification graphs of MN-neurite density (NEFH/SYPH) into the myotube compartment after Dexa and AFSC-EV treatments. Masks of tile scan show intersection lines (red) at every 50 µm starting from the microgroove exit. Arrows: neurite growth direction from the exit of microgrooves. Scale bars: 400 µm. Graph represents quantification of pixel intersection for each intersection line. Graph data are the mean ± SD (n = 3). Untreated vs. Dexa 20 µM: *** p value < 0.001, Dexa 20 µM vs. Dexa+AFSC-EVs: °°° p value < 0.001.
Figure 4
Figure 4
NMJ morphology alteration in vitro model of muscle atrophy and AFSC-EVs therapeutic potential. (A) Representative confocal images of NMJs with Dexa and AFSC-EV treatments. NMJs (arrow) are identified as co-localizations between pre-synaptic markers NEFH/SYPH and AChR marker αBtx on MyHC-positive myotubes. Insets: magnification of NMJs. Scale bars: 25 µm. (B) Percentage of innervated myotubes. Graph data are the mean ± SD (n = 3). (C) Number of αBtx and SYPH/NEFH co-localization per myotube. Graph data are the mean ± SD (n = 3). °° p value < 0.01, *** p value < 0.001. (D) Quantification of NMJ morphology: single and multiple contact points. Graph data are the mean ± SD (n = 3). °,* p value < 0.05, ** p value < 0.01, °°° p value < 0.001.
Figure 5
Figure 5
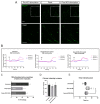
NMJ functionality after Dexamethasone and human AFSC-EV exposure. (A) Representative images of MAB-myotubes before, during, and after MN-KCl stimulation labeled with Fluo-4. Scale bars: 200 µm. (B) Representative Ca2+ influx curves into MAB-myotubes after MN-KCl stimulation (arrow). (C) Percentage of active MAB-myotubes after MN-stimulation. Graph data are the mean ± SD (biological replicates = 3, analyzed myotubes: Untreated = 19, Dexa 20 µM = 14, Dexa+AFSC-EVs = 20). * p value < 0.05 (untreated vs. Dexa 20 µM). (D) Ca2+ influx intensity after Dexamethasone and AFSC-EV treatment. Graph data are the mean ± SD (biological replicates = 3, analyzed myotubes: Untreated = 19, Dexa 20 µM = 14, Dexa+AFSC-EVs = 20). (E) Graph comparing peak onset times with or without Dexamethasone and AFSC-EV treatment. Graph data are the mean ± SD (biological replicates = 3, analyzed myotubes: Untreated = 19, Dexa 20 µM = 14, Dexa+AFSC-EVs = 20). ° p value < 0.05 (Dexa 20 µM vs. Dexa+AFSC-EVs), *** p value < 0.001 (untreated vs. Dexa 20 µM).
Figure 6
Figure 6
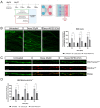
Effect of human AFSC-EVs exposure on MN-intracellular ROS and mitochondrial superoxide content in an in vitro co-culture system of muscle atrophy. (A) Schematic overview of time-treatment for ROS and mitochondrial O2•− analyses. Created with BioRender.com. (B) Representative confocal images of MN-neurites stained with DCFH-DA fluorescent probe (green) into MAB-myotube compartment after 24 min of Dexamethasone exposure in the presence or absence of AFSC-EVs. Scale bar: 50 µm. Graph shows ROS neurite content after 20, 24, and 28 min of Dexamethasone exposure in the presence or absence of AFSC-EVs. Graph data are the mean ± SD (n = 3). ° p value < 0.05, **,°° p value < 0.01, ***,°°° p value < 0.001, **** p value < 0.0001. (C) Representative confocal images of MN-neurites stained with MitoTrackerTM (green) and MitoSoxTM (red) after 24 min of Dexamethasone exposure in the presence or absence of AFSC-EVs. Image lengths: 100 µm. Scale bar: 15 µm. (D) Fluorescence intensity of MitoSoxTM/MitoTrackerTM recorded after 20, 24, and 28 min of Dexamethasone treatment in the presence or absence of AFSC-EVs. Graph data are the mean ± SD (n = 3). °° p value < 0.01, ***,°°° p value < 0.001.

Similar articles

Cited by

References

    1. Bonaldo P., Sandri M. Cellular and molecular mechanisms of muscle atrophy. Dis. Model. Mech. 2013;6:25–39. doi: 10.1242/dmm.010389. - DOI - PMC - PubMed
    1. Jang Y.C., van Remmen H. Age-associated alterations of the neuromuscular junction. Exp. Gerontol. 2011;46:193–198. doi: 10.1016/j.exger.2010.08.029. - DOI - PMC - PubMed
    1. Wiedmer P., Jung T., Castro J.P., Pomatto L.C., Sun P.Y., Davies K.J., Grune T. Sarcopenia—Molecular mechanisms and open questions. Ageing Res. Rev. 2020;65:101200. doi: 10.1016/j.arr.2020.101200. - DOI - PubMed
    1. Gonzalez-Freire M., de Cabo R., Studenski S.A., Ferrucci L. The neuromuscular junction: Aging at the crossroad between nerves and muscle. Front. Aging Neurosci. 2014;6:208. doi: 10.3389/fnagi.2014.00208. - DOI - PMC - PubMed
    1. Yedigaryan L., Sampaolesi M. Therapeutic Implications of miRNAs for Muscle-Wasting Conditions. Cells. 2021;10:3035. doi: 10.3390/cells10113035. - DOI - PMC - PubMed

Grants and funding

This work was supported by funds from the Department of Excellence 2018–2022 (Department of Biomedical, Metabolic and Neural Sciences). The study was also supported by funds for mobility activities for young researchers (University of Modena and Reggio Emilia).

LinkOut - more resources