. 2023 Mar 1;24(5):4786.
doi: 10.3390/ijms24054786.

Acral Melanoma Is Infiltrated with cDC1s and Functional Exhausted CD8 T Cells Similar to the Cutaneous Melanoma of Sun-Exposed Skin

Affiliations

Acral Melanoma Is Infiltrated with cDC1s and Functional Exhausted CD8 T Cells Similar to the Cutaneous Melanoma of Sun-Exposed Skin

Saraí G De Leon-Rodríguez et al. Int J Mol Sci. .

Abstract

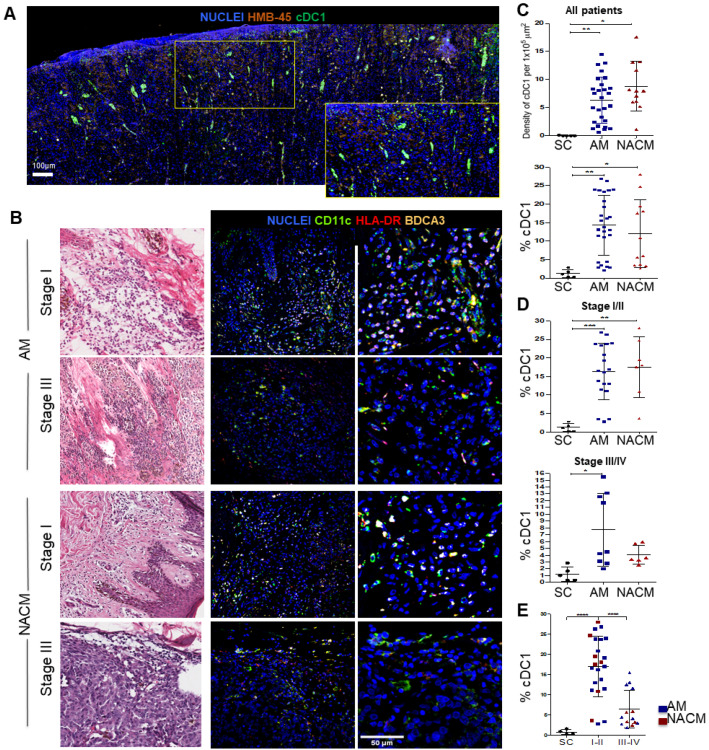
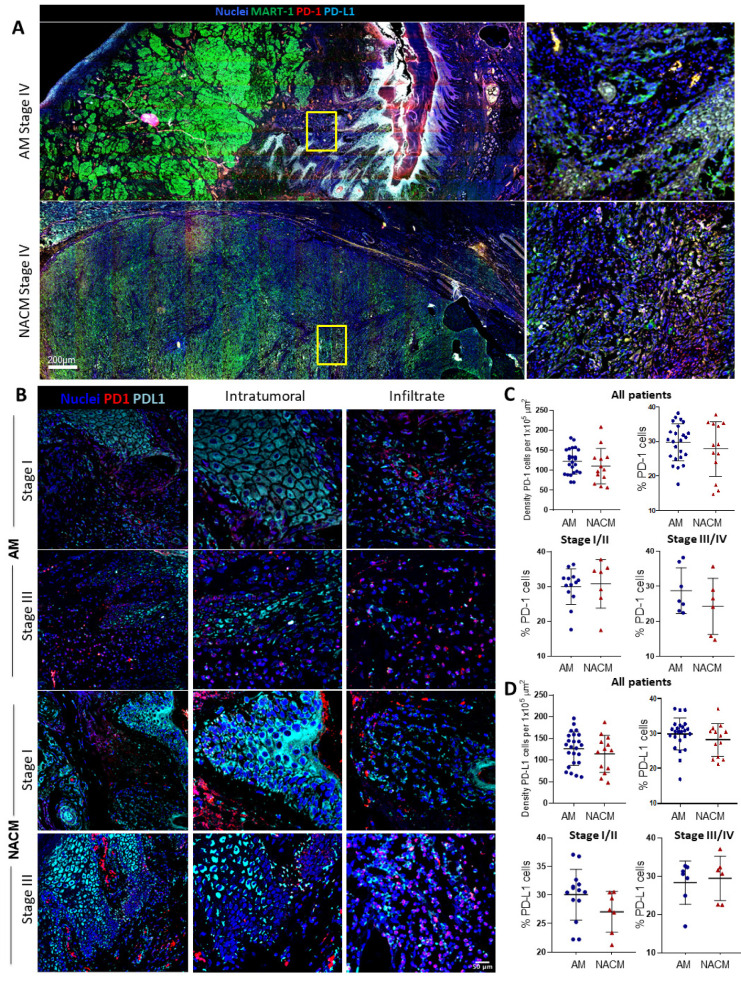
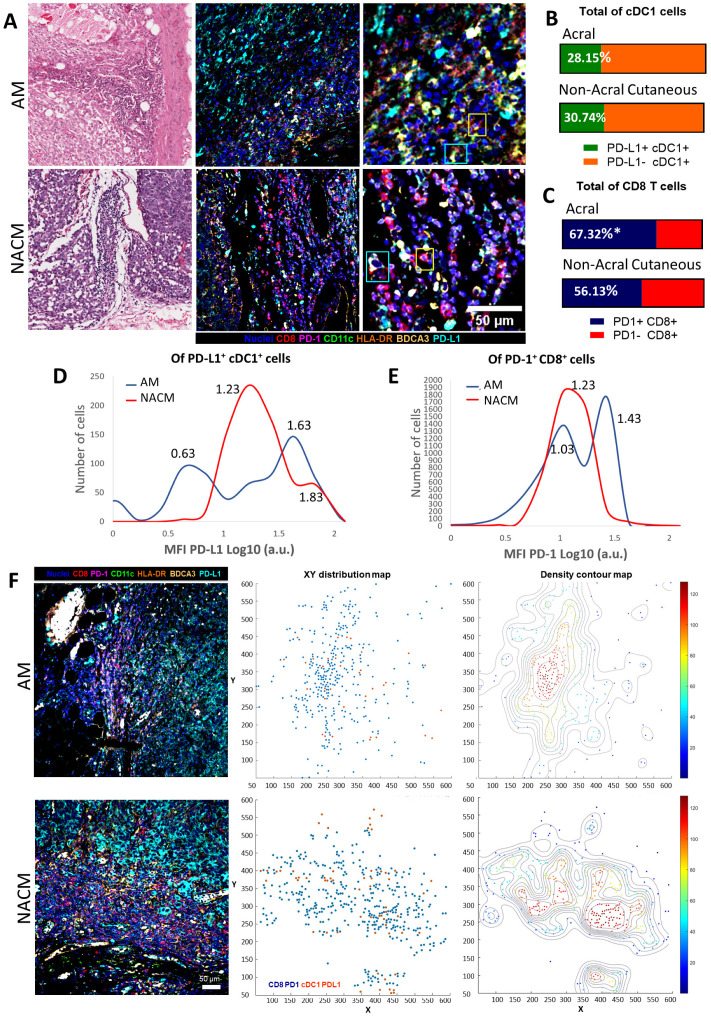
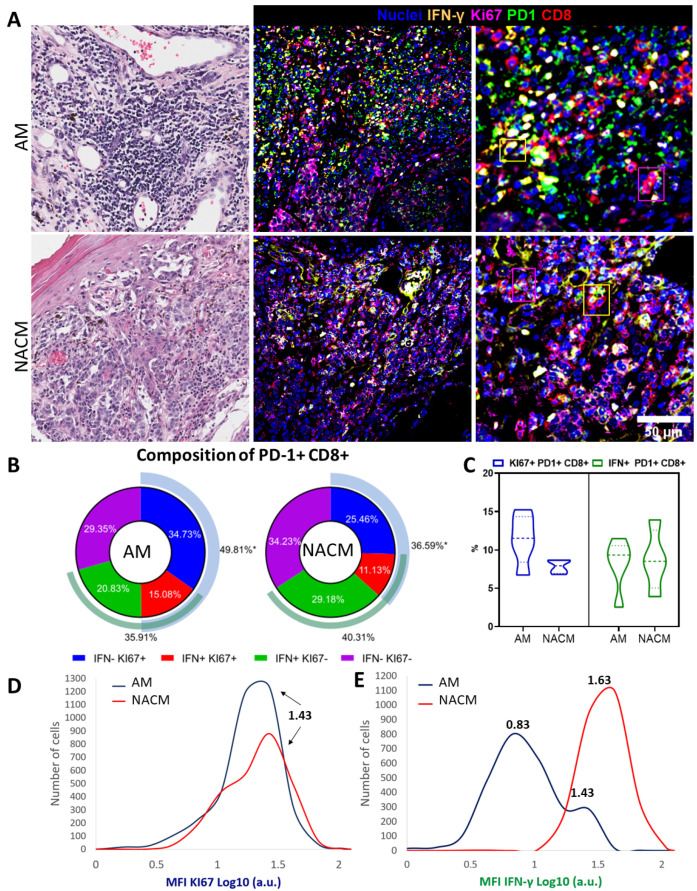
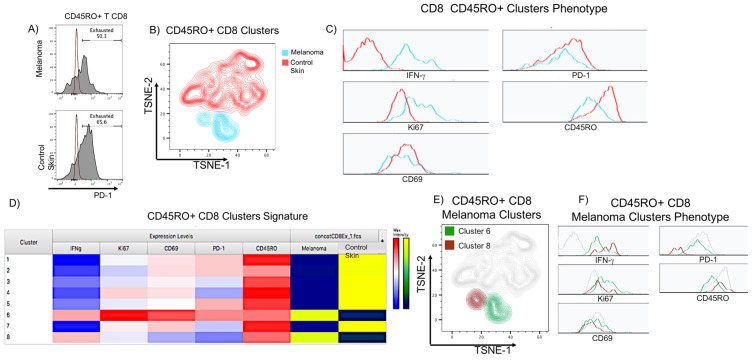
Acral melanoma (AM) is the most common melanoma in non-Caucasian populations, yet it remains largely understudied. As AM lacks the UV-radiation mutational signatures that characterize other cutaneous melanomas, it is considered devoid of immunogenicity and is rarely included in clinical trials assessing novel immunotherapeutic regimes aiming to recover the antitumor function of immune cells. We studied a Mexican cohort of melanoma patients from the Mexican Institute of Social Security (IMSS) (n = 38) and found an overrepresentation of AM (73.9%). We developed a multiparametric immunofluorescence technique coupled with a machine learning image analysis to evaluate the presence of conventional type 1 dendritic cells (cDC1) and CD8 T cells in the stroma of melanoma, two of the most relevant immune cell types for antitumor responses. We observed that both cell types infiltrate AM at similar and even higher levels than other cutaneous melanomas. Both melanoma types harbored programmed cell death protein 1 (PD-1+) CD8 T cells and PD-1 ligand (PD-L1+) cDC1s. Despite this, CD8 T cells appeared to preserve their effector function and expanding capacity as they expressed interferon-γ (IFN-γ) and KI-67. The density of cDC1s and CD8 T cells significantly decreased in advanced stage III and IV melanomas, supporting these cells' capacity to control tumor progression. These data also argue that AM could respond to anti-PD-1-PD-L1 immunotherapy.

Keywords: CD8; PD-1; PD-L1; acral; cDC1s; exhaustion; melanoma.


Conflict of interest statement

The authors declare no conflict of interest.

Figures

Figure 1
Figure 1
Characteristics of the original IMSS study cohort. (A) Schematic representation of the workflow of the melanoma samples. Tissue resection specimens and clinical information were obtained at diagnosis from The Mexican Institute of Social Security (IMSS). The study impartially covered archival samples derived from patients admitted during the years 2017–2018. Classification of the type of melanoma was based on the anatomical origin of the primary lesion. Skin lesions from nail beds, palms, and soles were classified as acral melanomas (AM), while lesions originating from other skin locations were non-acral cutaneous melanomas (NACM). (B,C) Pie charts showing the proportion of patients with AM and NACM (n = 38) found in the original IMSS cohort (B), and (C) the proportion of each melanoma classified according to the staging system. (D) Representative images of hematoxylin and eosin (H&E) staining of AM (top) and NACM (bottom) showing the whole resection slide (left panel), and three digital zooms (hollow squares) of areas that are highly infiltrated (right panels).
Figure 2
Figure 2
Assessment of the melanoma infiltrating conventional type 1 dendritic cells (cDC1). (A) Whole slide scanning of a representative advanced stage III acral melanoma (AM) showing the global distribution of CD11c+ HLA-DR+ BDCA3+ cDC1s (green) near the HMB-45+ tumor cells (orange). Digital zoom is also presented for a better appreciation (yellow panel). (B) Representative hematoxylin & eosin (left column) and immunofluorescence (IF) (middle and right columns) images of stage I and III AM and non-acral cutaneous melanoma (NACM). The right column represents a digital zoom of a highly infiltrated area. IF images were stained with CD11c (green), HLA-DR (red), BDCA3 (yellow) and Nuclei (Blue). (C,D) Plots with the following comparisons between AM and NACM, (C) the absolute numbers of cDC1s per 1 × 105 μm2 (top) and percentages of cDC1s (bottom); (D) early stages I and II (top) and advanced stages III and IV (bottom). (E) Plot comparing the percentage of cDC1s between early and advanced stages. Percentages of cDC1s were estimated among all nucleated cells in the highly infiltrated areas selected. Supplementary Figure S1 shows the autofluorescence control for this experiment. For this analysis, we used 38 samples from the IMSS cohort plus five advanced NACM samples from other hospitals: AM (blue, n = 30) and NACM (red, n = 13). Healthy skin control (SC) samples were obtained from surgical resections unrelated to cancer (black; n = 8). Statistical analysis: One Way ANOVA’s test with Tukey’s post hoc test for multiple comparisons. * p < 0.05, ** p < 0.01, *** p < 0.001, and **** p < 0.0001.
Figure 3
Figure 3
Assessment of the melanoma infiltrating CD8 T cells. (A) Whole slide scanning of a representative advanced stage III acral melanoma (AM) showing the global distribution of CD8 T cells (red) near the MART1+ tumor cells (green). Digital zoom is also presented for a better appreciation (yellow panel). (B) Representative hematoxylin & eosin (left column) and immunofluorescence (IF) (middle and right columns) images of stage I and III AM and non-acral cutaneous melanoma (NACM). The third column represents a digital zoom of a highly infiltrated area. Samples were stained for CD8 (red) and nuclei (blue). (C,D) Plots with the following comparisons between AM and NACM, (C) the absolute numbers of CD8 T cells per 1 × 105 μm2 (top) and percentages (bottom); (D) early stages I and II (top) and advanced stages III and IV (bottom). (E) Plot comparing the percentage of CD8 T cells between early and advanced stages. The percentage of CD8 T cells was estimated among all nucleated cells in the highly infiltrated areas selected. Supplementary Figure S2 shows the autofluorescence control for this experiment. For this analysis, we used 38 samples from the original IMSS cohort plus five advanced stage NACM samples obtained from other hospitals: AM (blue, n = 30) and NACM (red, n = 13). Healthy skin control (SC) samples were obtained from surgical resections unrelated to cancer (black; n = 8). Statistical analysis: One-Way ANOVA’s test with Tukey’s post hoc test for multiple comparisons. * p < 0.05, ** p < 0.01 *** p < 0.001, and **** p < 0.0001.
Figure 4
Figure 4
The PD-1/PD-L1 axis is active in acral melanoma samples. (A) Whole slide scanning of a representative immunofluorescence (IF) image of advanced stage IV AM (top) and NACM (bottom) showing the global distribution of PD-1 (red) and PD-L1 (cyan). IF images also show tumor cells marked with MART-1 (green) and nuclei (blue) and digital zooms (right panel, yellow squares). (B) Representative IF images of Stage I and III AM and NACM. Staining: PD-1 (red), PD-L1 (cyan) and nuclei (blue). Digital zooms show an intratumoral area (middle) and a highly infiltrated area (right). (C,D) Plots with the following comparisons between AM and NACM, (C) the absolute numbers of PD-1+ cells per 1 × 105 µm2 (left) and percentages (right) in all patients, percentages of PD-1+ cells in early stages I and II (bottom left) and advanced stages III and IV (bottom right). (D) The absolute numbers of PD-L1+ cells per 1 × 105 µm2 (left) and percentages (right) in all patients, percentages of PD-L1+ cells in early stages I and II (bottom left), and advanced stages III and IV (bottom right). Percentages of PD-1+ and PD-L1+ cells were estimated among all nucleated cells present in the highly infiltrated areas selected. Supplementary Figure S3 shows the autofluorescence control for this experiment. For this analysis, we used 38 samples from the original IMSS cohort plus five additional advanced NACM samples derived from other hospitals: AM (blue, n = 30) and NACM (red, n = 13). Statistical analysis: Unpaired Student’s t-test.
Figure 5
Figure 5
Acral melanoma is infiltrated by PD-1+ CD8 T cells and PD-L1+ cDC1s. (A) Representative hematoxylin & eosin (left) and multiparametric immunofluorescence (mIF) images (middle and right (zoomed of a highly infiltrated area)) of advanced acral melanoma (AM) and advanced non-acral cutaneous melanoma (NACM). IF staining: CD8 (red), CD11c (green), HLA-DR (orange), BDCA3 (yellow), PD-L1 (cyan), PD-1 (magenta) and nuclei (blue) (middle panels). Yellow and cyan squares point out to PD-1+ CD8 T cells and PD-L1+ cDC1 cells, respectively. The proportion of PD-L1+ and PD-L1- cDC1s (B), and of PD-1+ and PD-1- CD8 T cells (C) in AM and NACM. (D,E) Histograms showing the mean fluorescence intensity (MFI) of PD-L1 expression on cDC1s (D) and of PD-1 on CD8 T cells (E) in AM (blue histogram) and NACM (red), arbitrary fluorescence units Log10 scale. (F) Analysis of the spatial relationship between PD-1+ CD8 T cells and PD-L1+ cDC1s. (F) Representative IF images (left) were used to construct XY-Cartesian coordinate (middle) and density contour (right) maps for AM and NACM to unveil regions in the stroma of melanoma in which both types of cells were in proximity. In (AE) comparisons between AM and NACM were made using five samples of advanced stage III and IV for each type of melanoma. We show in Supplementary Figure S5 a representative staining of every channel to provide a better visualization of each mark individually. In addition, we show in Supplementary Figure S6 the acquired images of the bleached tissue to illustrate that the first round of fluorescence staining was excluded from the analysis of the second round of staining. In (F) one advanced stage IV sample was used for each type of melanoma. In the XY distribution map PD-1+ CD8 T cells are shown in blue and PD-L1+ cDC1 cells in red; in the density contour plot, red dots point to areas in which both types of cells are in close interaction. Statistical analysis: Student’s t-test, * p < 0.05.
Figure 6
Figure 6
Melanoma infiltrating PD-1+ CD8 T cells express functional markers. (A) Representative hematoxylin & eosin (left) and immunofluorescence (IF) images (middle and right (zoomed of a highly infiltrated area) of advanced acral melanoma (AM) and advanced non-acral cutaneous melanoma (NACM). IF staining: CD8 (red), PD-1 (green), IFN-γ (yellow), KI-67 (magenta) and nuclei (blue). Yellow and magenta squares point out to IFN-γ+ PD-1+ CD8+ T cell and KI-67+ PD-1+ CD8+ T cell, respectively. (B) Pie charts showing the proportion of PD-1+ CD8+ T cells expressing IFN-γ and/or KI-67. External elements represent the total IFN-γ fraction (green), and total KI-67 fraction (blue). (C) Violin plots showing comparisons of the percentages of KI-67+ PD-1+ CD8 T cells (blue) and of IFN-γ+ PD-1+ CD8 T cells (green) in AM and NACM. (D,E) Normalized mean fluorescence intensity (MFI) of KI-67 (D) and IFN-γ (E) expression in KI-67+ PD-1+ CD8 T cells or IFN-γ+ PD-1+ CD8 T cells, respectively. Arbitrary fluorescence units Log10 Scale. We show in Supplementary Figure S7 a representative staining of every channel to better visualize each mark individually. In addition, we show in Supplementary Figure S8 the acquired images of the bleached tissue to illustrate that the first round of fluorescence staining was excluded from the analysis of the second round of staining. Statistical analysis: Student’s t-test, * p < 0.05.
Figure 7
Figure 7
Flow cytometry analysis validates the presence of functional PD-1+ CD8 T cells in the stroma of acral melanoma. Stromal cells were obtained from one acral melanoma (AM) and one healthy skin control (SC) derived from a surgical resection unrelated to cancer. Memory CD45RO+ CD8 T cells were clustered together for further analysis. (A) Histogram of PD-1 expression on CD45RO+ CD8 T cells (gray histograms), the autofluorescence control is shown in maroon histograms. (B) CD45RO+ CD8 T cells non-supervised t-distributed stochastic neighborhood embedding (t-SNE) clustering. Clusters derived from the melanoma and skin control samples are shown in blue and red, respectively. The expression of IFN-γ, KI-67, CD45RO, CD69, and PD-1 was used for clustering. (C) Histograms of the normalized expression of the parameters used for the clustering in (B), melanoma (blue) and skin control (red) clusters. (D) Heatmap of the normalized expression of the parameters used in (B). (E) Topological identity of melanoma CD8 T cell clusters obtained in (D). Cluster 6 (green), Cluster 8 (brown). (F) Histograms of the normalized expression of the parameters used for the clustering in (B), cluster 6 (green) cluster 8 (brown).

Similar articles

Cited by

References

    1. Carr S., Smith C., Wernberg J. Epidemiology and Risk Factors of Melanoma. Surg. Clin. North Am. 2020;100:1–12. doi: 10.1016/j.suc.2019.09.005. - DOI - PubMed
    1. Lino-Silva L.S., Domínguez-Rodríguez J.A., Aguilar-Romero J.M., Martínez-Said H., Salcedo-Hernández R.A., García-Pérez L., Herrera-Gómez Á., Cuellar-Hubbe M. Melanoma in Mexico: Clinicopathologic Features in a Population with Predominance of Acral Lentiginous Subtype. Ann. Surg. Oncol. 2016;23:4189–4194. doi: 10.1245/s10434-016-5394-x. - DOI - PubMed
    1. Hernández J.F.G. Melanoma cutáneo (MC): Diagnóstico y tratamiento actuales. Gac. Med. Mex. 2014;150:175–182. - PubMed
    1. Barnes P.W., Robson T.M., Neale P.J., Williamson C.E., Zepp R.G., Madronich S., Wilson S.R., Andrady A.L., Heikkilä A.M., Bernhard G.H., et al. Environmental Effects of Stratospheric Ozone Depletion, UV Radiation, and Interactions with Climate Change: UNEP Environmental Effects Assessment Panel, Update 2021. Photochem. Photobiol. Sci. 2022;21:275–301. doi: 10.1007/s43630-022-00176-5. - DOI - PMC - PubMed
    1. Hodi F.S., Wolchok J.D., Schadendorf D., Larkin J., Long G.V., Qian X., Saci A., Young T.C., Srinivasan S., Chang H., et al. TMB and Inflammatory Gene Expression Associated with Clinical Outcomes Following Immunotherapy in Advanced Melanoma. Cancer Immunol. Res. 2021;9:1202–1213. doi: 10.1158/2326-6066.CIR-20-0983. - DOI - PMC - PubMed