. 2023 May 1;324(5):L677-L693.
doi: 10.1152/ajplung.00258.2022. Epub 2023 Mar 7.

Atrophy signaling pathways in respiratory and limb muscles of guinea pigs exposed to chronic cigarette smoke: role of soluble guanylate cyclase stimulation

Affiliations

Atrophy signaling pathways in respiratory and limb muscles of guinea pigs exposed to chronic cigarette smoke: role of soluble guanylate cyclase stimulation

Víctor Ivo Peinado et al. Am J Physiol Lung Cell Mol Physiol. .

Abstract

Skeletal muscle dysfunction in chronic obstructive pulmonary disease (COPD) is characterized by a significant reduction in muscle strength and endurance. Preclinical studies show that stimulation of the soluble guanylate cyclase (sGC)-cGMP pathway attenuates muscle mass loss and prevents cigarette smoke-induced oxidative stress, indicating that pharmacological activation of the guanylyl cyclase pathway in COPD may provide a beneficial therapeutic strategy that reaches beyond the lung. In this study, conducted in an animal model of COPD, we first set out to assess the effect of cigarette smoke (CS) on biomarkers of muscle fatigue, such as protein degradation and its transcriptional regulation, in two types of muscles with different energy demands, i.e., the diaphragm and the gastrocnemius muscle of the limbs. Second, we evaluated the administration of an sGC stimulator on these markers to study the potential efficacy of such treatment in the recovery of skeletal muscle function. Exposure to CS led to weight loss, which was associated in the gastrocnemius with increased levels of proteolytic markers of muscle atrophy (MURF-1, Atrogin-1, proteasome C8 subunit 20 s, and total protein ubiquitination), whereas the size of fast-twitch muscle fibers decreased significantly. Long-term treatment with the sGC stimulator BAY 41-2272 resulted in a significant reduction in gastrocnemius levels of the aforementioned proteolytic markers, concomitant with a weight recovery and increased cGMP levels. Remarkably, levels of some of the analyzed biomarkers differed between respiratory and limb muscles. In conclusion, targeting sGC might exert beneficial effects on muscle alterations in patients with COPD.

Keywords: COPD; cGMP; muscle atrophy; pharmacology.


Conflict of interest statement

No conflicts of interest, financial or otherwise, are declared by the authors.

Figures

None
Graphical abstract
Figure 1.
Figure 1.
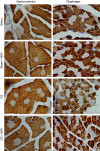
Representative immunostaining of MyHC-II in diaphragm and limb muscle tissue sections from one animal from each of the different experimental groups. Fast-twitch fibers are identified in brown (positive labeling), whereas slow-twitch fibers are shown in white (negative labeling). CS, cigarette smoke.
Figure 2.
Figure 2.
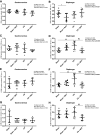
Mean values and standard deviation of MURF-1 protein content in the gastrocnemius (A), MURF-1 protein content in the diaphragm (B), atrogin-1 protein content in the gastrocnemius (C), and atrogin-1 protein content in the diaphragm (D) measured as optical density (OD) using arbitrary units (a.u.) in the muscles of the different guinea pig study groups. Potential differences between two groups were analyzed using contrast of marginal linear predictions. Statistical significance: #P ≤ 0.05, ###P ≤ 0.001 between the CS group and the sham control group; ¶P ≤ 0.05, ¶¶P ≤ 0.01 between the CS + BAY group and the CS group. The effect of CS and treatment and interaction effects are also indicated as actual P values for each variable. Bay, Bay 41–2272; CS, cigarette smoke.
Figure 3.
Figure 3.
Mean values and standard deviation of the 20 s proteasome subunit C8 protein content in the gastrocnemius (A), 20 s proteasome subunit C8 protein content in the diaphragm (B), total ubiquitinated protein content in the gastrocnemius (C), and total ubiquitinated protein content in the diaphragm (D) measured as optical density (OD) using arbitrary units (a.u.) in the muscles of the different guinea pig study groups. Potential differences between two groups were analyzed using contrast of marginal linear predictions. Statistical significance: ##P ≤ 0.01, ###P ≤ 0.001 between the CS group and the sham control group; ¶¶P ≤ 0.01, ¶¶¶P ≤ 0.001 between the CS + BAY group and the CS group; †P ≤ 0.05 between the sham + BAY group and the sham control group. The effect of CS and treatment and interaction effects are also indicated as actual P values for each variable. Bay, Bay 41–2272; CS, cigarette smoke.
Figure 4.
Figure 4.
Mean values and standard deviation of the BAX protein content in the gastrocnemius (A), BAX protein content in the diaphragm (B), BCL-2 protein content in the gastrocnemius (C), and BCL-2 protein content in the diaphragm (D) measured as optical density (OD) using arbitrary units (a.u.) in the muscles of the different guinea pig study groups. Potential differences between two groups were analyzed using contrast of marginal linear predictions. Statistical significance: #P ≤ 0.05 between the CS group and the sham control group; †P ≤ 0.05 between the sham + BAY group and the sham control group. The effect of CS and treatment and interaction effects are also indicated as actual P values for each variable. Bay, Bay 41–2272; CS, cigarette smoke.
Figure 5.
Figure 5.
Mean values and standard deviation of the caspase-3 protein content in the gastrocnemius (A) and caspase-3 protein content in the diaphragm (B) measured as optical density (OD) using arbitrary units (a.u.) and percentage of TUNEL-positive nuclei in the gastrocnemius (C), and percentage of TUNEL-positive nuclei in the diaphragm (D) in the muscles of the different guinea pig study groups. Potential differences between two groups were analyzed using contrast of marginal linear predictions. Statistical significance: #P ≤ 0.05, ###P ≤ 0.001 between the CS group and the sham control group. The effect of CS and treatment and interaction effects are also indicated as actual P values for each variable. CS, cigarette smoke.
Figure 6.
Figure 6.
Mean values and standard deviation of the p62 protein content in the gastrocnemius (A), p62 protein content in the diaphragm (B), LC3B protein content in the gastrocnemius (C) and LC3B protein content in the diaphragm (D) and isoforms of LC3B-I and II in the gastrocnemius (E and G) and diaphragm (F and H) measured as optical density (OD) using arbitrary units (a.u.) in the muscles of the different guinea pig study groups. Potential differences between two groups were analyzed using contrast of marginal linear predictions. Statistical significance: ##P ≤ 0.01 between the CS group and the sham control group; ¶¶P ≤ 0.01, ¶¶¶P ≤ 0.001 between the CS + BAY group and the CS group; †P ≤ 0.05 between the sham + BAY group and the sham control group. The effect of CS and treatment and interaction effects are also indicated as actual P values for each variable. Bay, Bay 41–2272; CS, cigarette smoke.
Figure 7.
Figure 7.
Mean values and standard deviation of the NF-κB p50 protein content in the gastrocnemius (A), NF-κB p50 protein content in the diaphragm (B), phosphorylated NF-κB p50 protein content in the gastrocnemius (C), and phosphorylated NF-κB p50 protein content in the diaphragm (D) measured as optical density (OD) using arbitrary units (a.u.) in the muscles of the different guinea pig study groups. Potential differences between two groups were analyzed using contrast of marginal linear predictions. Statistical significance: #P ≤ 0.05, ##P ≤ 0.01 between the CS group and the sham control group; ¶P ≤ 0.05, ¶¶P ≤ 0.01 between the CS + BAY group and the CS group; †P ≤ 0.05 between the sham + BAY group and the sham control group. The effect of CS and treatment and interaction effects are also indicated as actual P values for each variable. Bay, Bay 41–2272; CS, cigarette smoke.
Figure 8.
Figure 8.
Mean values and standard deviation of the NF-κB p65 protein content in the gastrocnemius (A), NF-κB p65 protein content in the diaphragm (B), phosphorylated NF-κB p65 protein content in the gastrocnemius (C) and phosphorylated NF-κB p65 protein content in the diaphragm (D) measured as optical density (OD) using arbitrary units (a.u.) in the muscles of the different guinea pig study groups. The effect of CS and treatment and interaction effects are also indicated as actual P values for each variable. Potential differences between two groups were analyzed using contrast of marginal linear predictions. No differences were found between groups.
Figure 9.
Figure 9.
Mean values and standard deviation of the p38 MAPK protein content in the gastrocnemius (A), p38 MAPK protein content in the diaphragm (B), phosphorylated p38 MAPK protein content in the gastrocnemius (C) and phosphorylated p38 MAPK protein content in the diaphragm (D) measured as optical density (OD) using arbitrary units (a.u.) in the muscles of the different guinea pig study groups. Potential differences between two groups were analyzed using contrast of marginal linear predictions. Statistical significance: ##P ≤ 0.01 between the CS group and the sham control group; ¶¶P ≤ 0.01 between the CS + BAY group and the CS group. The effect of CS and treatment and interaction effects are also indicated as actual P values for each variable. Bay, Bay 41–2272; CS, cigarette smoke.
Figure 10.
Figure 10.
Mean values and standard deviation of the FOXO3 protein content in the gastrocnemius (A), FOXO3 protein content in the diaphragm (B), phosphorylated FoxO3 protein content in the gastrocnemius (C), and phosphorylated FOXO3 protein content in the diaphragm (D) measured as optical density (OD) using arbitrary units (a.u.) in the muscles of the different guinea pig study groups. Potential differences between two groups were analyzed using contrast of marginal linear predictions. Statistical significance: #P ≤ 0.05, ##P ≤ 0.01 between the CS group and the sham control group; ¶P ≤ 0.05, ¶¶¶P ≤ 0.001 between the CS + BAY group and the CS group; †P ≤ 0.05, †††P ≤ 0.001 between the sham + BAY group and the sham control group. The effect of CS and treatment and interaction effects are also indicated as actual P values for each variable. Bay, Bay 41–2272; CS, cigarette smoke.

Similar articles

Cited by

References

    1. Jaitovich A, Barreiro E. Skeletal muscle dysfunction in chronic obstructive pulmonary disease. What we know and can do for our patients. Am J Respir Crit Care Med 198: 175–186, 2018. [Erratum in Am J Respir Crit Care Med 198: 824–825, 2018]. doi:10.1164/RCCM.201710-2140CI. - DOI - PMC - PubMed
    1. Casaburi R, Gosselink R, Decramer M, Dekhuijzen RPN, Fournier M, Lewis MI, Maltais F, Oelberg DA, Reid MB, Roca J, Schols AMWJ, Sieck GC, Systrom DM, Wagner PD, Williams TJ, Wouters E. Skeletal muscle dysfunction in chronic obstructive pulmonary disease-A statement of the American Thoracic Society and European Respiratory Society. Am J Respir Crit Care Med 159: S1–S40, 1999. doi:10.1164/ajrccm.159.supplement_1.99titlepage. - DOI - PubMed
    1. Barreiro E, del Puerto-Nevado L, Puig-Vilanova E, Pérez-Rial S, Sánchez F, Martínez-Galán L, Rivera S, Gea J, González-Mangado N, Peces-Barba G. Cigarette smoke-induced oxidative stress in skeletal muscles of mice. Respir Physiol Neurobiol 182: 9–17, 2012. doi:10.1016/J.RESP.2012.02.001. - DOI - PubMed
    1. Barreiro E, Peinado VI, Galdiz JB, Ferrer E, Marin-Corral J, Sánchez F, Gea J, Barberà JA; ENIGMA in COPD Project. Cigarette smoke-induced oxidative stress: a role in chronic obstructive pulmonary disease skeletal muscle dysfunction. Am J Respir Crit Care Med 182: 477–488, 2010. doi:10.1164/RCCM.200908-1220OC. - DOI - PubMed
    1. Warner TD, Mitchell JA, Sheng H, Murad F. Effects of cyclic GMP on smooth muscle relaxation. Adv Pharmacol 26: 171–194, 1994. doi:10.1016/S1054-3589(08)60054-X. - DOI - PubMed

Publication types