. 2023 Feb;30(1):92-106.
doi: 10.21315/mjms2023.30.1.8. Epub 2023 Feb 28.

Characterisation of Primary Human Hippocampal Astrocyte Cell Culture Following Exposure to Hypoxia

Affiliations

Characterisation of Primary Human Hippocampal Astrocyte Cell Culture Following Exposure to Hypoxia

Nurul Atikah Nor Nazli et al. Malays J Med Sci. 2023 Feb.

Abstract

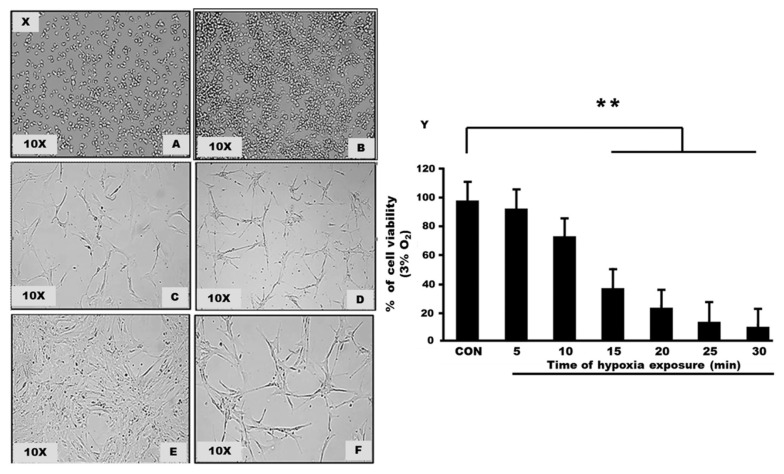
Background: The present study aimed to understand the characterisation of human hippocampal astrocyte following hypoxia exposure. Based on the preliminary screening, 15 min was chosen as the time point and the cells were exposed to different oxygen percentages.

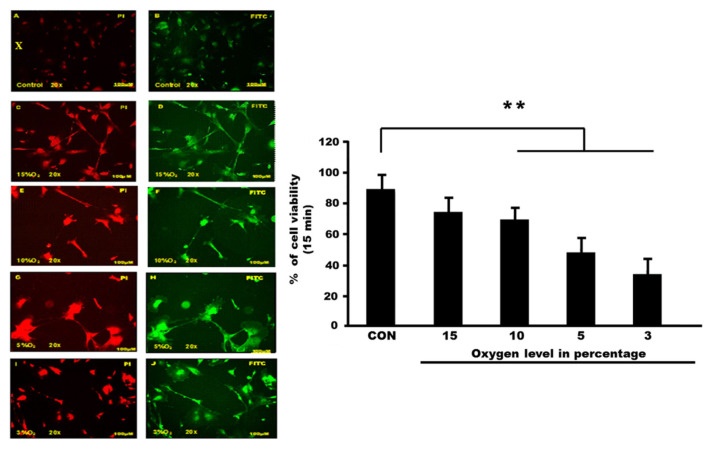
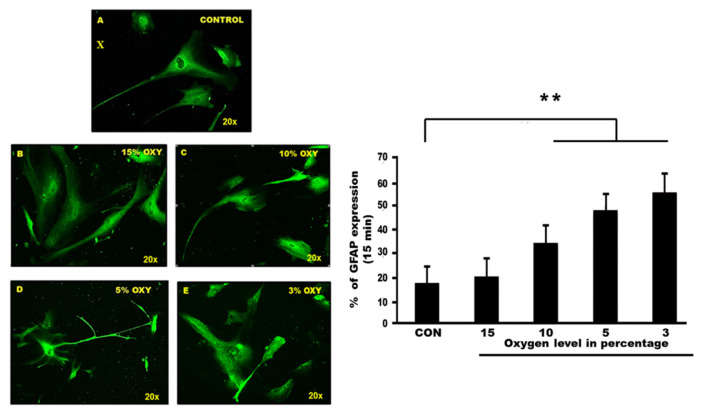
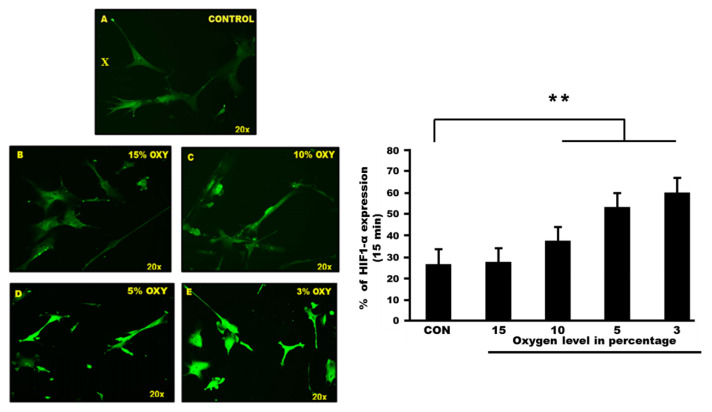
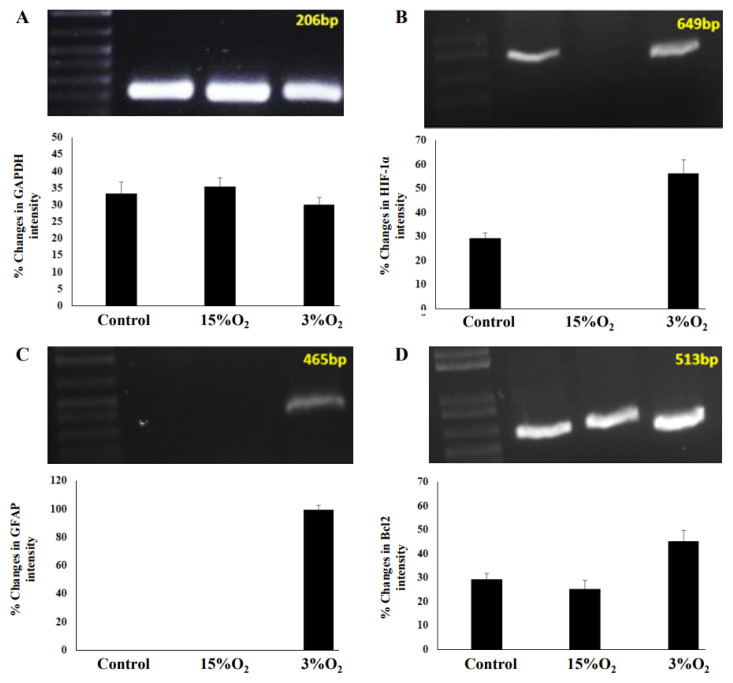
Methods: The Trypan blue viability assay used to examine cell death. Immunofluorescence assay, glial fibrillary acidic protein (GFAP) was used to portray the morphology of astrocytes. The hypoxia-inducible factor 1 (HIF-1) staining was performed to confirm hypoxia induced cell death and there was a dramatic expression of HIF-1α displayed in exposed astrocyte cells compared to the control. In molecular level, genes were chosen, such as glyceraldehyde 3-phosphate dehydrogenase (GAPDH), GFAP, HIF-1α and B-cell lymphoma 2 (Bcl-2) and ran the reverse transcription-polymerase chain reaction (RT-PCR).

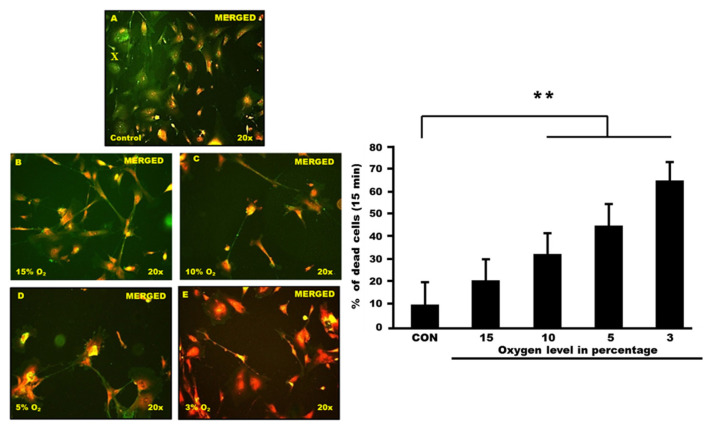
Results: Microscope revealed a filamentous and clear nucleus appearance in a control whereas the rupture nuclei with no rigid structure of the cell were found in the 3% oxygen. The control and hypoxia cells were also stained with the annexin V-fluorescein isothiocyanate (annexin V-FITC). Fluorescence microscope reveals astrocyte cells after hypoxia showed higher expression of nuclei but not in control. Merging PI and FITC showed the differences of nuclei expression between the control and hypoxia. In the molecular analysis, there were significant changes of GFAP, HIF-1α and Bcl-2 in hypoxia exposed cells when compared to the control group.

Conclusion: Cells that were exposed to hypoxia (3% oxygen for 15 min) clearly showed damage. General view of human hippocampal astrocyte genomic response to hypoxia was obtained.

Keywords: B-cell lymphoma 2; HIF-1α; annexin V-fluorescein isothiocyanate staining; cell viability; glial fibrillary acidic protein marker; glyceraldehyde 3-phosphate dehydrogenase; human hippocampal astrocytes; hypoxia; morphological changes; oxygen percentage.


Conflict of interest statement

Conflict of Interest None.

Figures

Figure 1
Figure 1
(X): Culturing human hippocampal astrocyte cells line in astrocyte media containing essential supplements for cells to growth (Light Microscope Zeiss, 10×). (A) Day 1: Initiated culture from 1 mL of vial containing > 5 × 10⁵ cells/mL. (B) Day 3: Cells start to accumulate and clump together. (C and D) After several days, processes of cells start to form and continue to develop more branches (E) Configuration of star-like cells start to appear after 10–14 days. Cells accumulate and reach more than 90% confidence. (F) After subculture and reach 70%–90% confluent, the cells were ready for experiment; passage 2 and passage 3 cells were used in this research. (Y): The cell viability of astrocyte cells following exposure to hypoxia (3% Oxygen). Graphs show the mean of cell viability for each group including the unexposed cell (0 min); control group. There are significant changes between control and hypoxia exposed groups (P-value < 0.001)
Figure 2
Figure 2
(X): PI and FITC staining of human hippocampal astrocyte cells (Filter wavelength used; WU = 330 nm–385 nm/WB = 460 nm–490 nm). Under fluorescence scanning, PI displayed a red image while in FITC the cells were displayed in green. (A) and (B) control group, (C) and (D) astrocytes were exposed to 15% of oxygen, (E) and (F) cells exposed to 10% of oxygen, (G) and (H) cells exposed to 5% oxygen and (I) and (J) astrocytes cells exposed to 3% oxygen. (Y): The cell viability of astrocyte cells following exposure to different percentages of oxygen level at a constant time point. Astrocyte cells were exposed at different oxygen percentages; 15% oxygen, 10% oxygen, 5% oxygen and 3% oxygen in 15 min. Graphs show the mean of cell viability for each group including the unexposed cell (control group). There are significant changes between control and exposed groups (P < 0.005)
Figure 3
Figure 3
(X): Merged between PI and FITC clearly showed the differences of nuclei expression between the control and hypoxia exposed group. The expression intensity was observed from (A) control, (B) astrocytes were exposed to 15% of oxygen, (C) cells exposed to 10% of oxygen, (D) cells exposed to 5% oxygen and (E) astrocytes cells exposed to 3% oxygen. All images were counted randomly by 3 blinded investigators (Cronbach’s alpha: 0.965). (Filter wavelength used; WU = 330 nm–385 nm/WB = 460 nm–490 nm). (Y): The cell death (FITC) of astrocyte cells following exposure to different percentages of oxygen level at constant time point. Astrocyte cells were exposed at different oxygen percentages; 15% oxygen, 10% oxygen, 5% oxygen and 3% oxygen in 15 min. Graphs show the mean of cell death for each group including the unexposed cell (control group). There were significant changes between control and exposed groups (P < 0.001)
Figure 4
Figure 4
(X): Staining human hippocampal astrocyte cell line using the GFAP (primary antibody) and anti-goat (secondary antibody). Fluorescence scanning microscope revealed a filamentous and clear nuclear appearance in a (A) control group. Different intensity can be found in (B) cells exposed to 15% oxygen, (C) cells exposed to 10% oxygen and (D) cells exposed to 5% oxygen. The rupture nuclei along with no rigid structure of the cell were displayed in (E) hypoxia group, the 3% oxygen exposure. (Y): The percentage of astrocyte cells in different oxygen concentrations correspond to GFAP. There were five groups of astrocyte cells exposed at different oxygen percentages; 15% oxygen, 10% oxygen, 5% oxygen and 3% oxygen in 15 min. Graphs show the mean of cell nuclei with positive GFAP for each group. One way Anova showed significant changes between control and exposed groups (P < 0.001)
Figure 5
Figure 5
(X): HIF staining human hippocampal astrocyte cell line. The green image stained cell showed the reactive astrocyte. (A) Control group showed poor intensity of HIF staining. Different intensity of HIF can be found in (B) cells exposed to 15% oxygen, (C) cells exposed to 10% oxygen. The intensity of the expression was higher in (D) cells exposed to 5% oxygen and (E) cells exposed to 3% oxygen. (Y): The percentage of astrocyte cells in different oxygen concentration and its HIF-1α expression. Five groups of astrocyte cells exposed at different oxygen percentages; 15% oxygen, 10% oxygen, 5% oxygen and 3% oxygen for 15 min showed different expressions of HIF-1α. Statistical analysis using one way Anova showed significant changes between control and exposed groups, P < 0.001 with Cronbach’s alpha: 0.950
Figure 6
Figure 6
Molecular analysis involving GAPDH, GFAP, HIF-1α and Bcl-2 in control and hypoxia group. Different expressions and different percentages changes in intensity were displayed in (A) GAPDH, (B) GFAP, (C) HIF-1α and (D) Bc1-2

Similar articles

References

    1. Ando S, Hatamoto Y, Sudo M, Kiyonaga A, Tanaka H, Higaki Y. The effects of exercise under hypoxia on cognitive function. PLoS ONE. 2013;8(5):e63630. doi: 10.1371/journal.pone.0063630. - DOI - PMC - PubMed
    1. Mateika JH, El-Chami M, Shaheen D, Ivers B. Intermittent hypoxia: a low-risk research tool with therapeutic value in humans. J Appl Physiol. 2015;118(5):520–532. doi: 10.1152/japplphysiol.00564.2014. - DOI - PubMed
    1. McInerney P, Adams P, Hadi MZ. Error rate comparison during polymerase chain reaction by DNA polymerase. Mol Biol Int. 2014;2014:287430. doi: 10.1155/2014/287430. - DOI - PMC - PubMed
    1. Barhwal K, Hota SK, Jain V, Prasad D, Singh SB, Ilavazhagan G. Acetyl-l-carnitine (ALCAR) prevents hypobaric hypoxia-induced spatial memory impairment through extracellular related kinase-mediated nuclear factor erythroid 2-related factor 2 phosphorylation. Neuroscience. 2009;161(2):501–514. doi: 10.1016/j.neuroscience.2009.02.086. - DOI - PubMed
    1. Hota KB, Hota SK, Chaurasia OP, Singh SB. Acetyl-L-carnitine-mediated neuroprotection during hypoxia is attributed to ERK1/2-Nrf2-regulated mitochondrial biosynthesis. Hippocampus. 2012;22(4):723–736. doi: 10.1002/hipo.20934. - DOI - PubMed

LinkOut - more resources