

This is a preprint.
It has not yet been peer reviewed by a journal.
The National Library of Medicine is
running a pilot
to include preprints that result from research funded by NIH in PMC and PubMed.
[Preprint]. 2023 Feb 22:2023.02.21.529152.
doi: 10.1101/2023.02.21.529152.
Phased nanopore assembly with Shasta and modular graph phasing with GFAse
Affiliations
- PMID: 36865218
- PMCID: PMC9980101
- DOI: 10.1101/2023.02.21.529152
Item in Clipboard
Phased nanopore assembly with Shasta and modular graph phasing with GFAse
bioRxiv.
.
Update in
-
Phased nanopore assembly with Shasta and modular graph phasing with GFAse.Genome Res. 2024 Apr 25;34(3):454-468. doi: 10.1101/gr.278268.123. Genome Res. 2024. PMID: 38627094 Free PMC article.
Abstract
As a step towards simplifying and reducing the cost of haplotype resolved de novo assembly, we describe new methods for accurately phasing nanopore data with the Shasta genome assembler and a modular tool for extending phasing to the chromosome scale called GFAse. We test using new variants of Oxford Nanopore Technologies' (ONT) PromethION sequencing, including those using proximity ligation and show that newer, higher accuracy ONT reads substantially improve assembly quality.
Figures
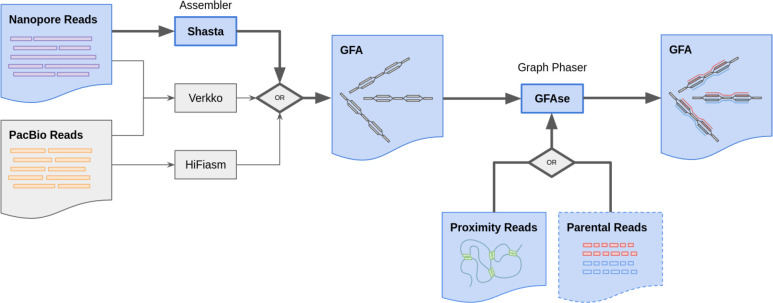
Summary of de novo phasing pipeline using Shasta and GFAse. Shasta performs de novo assembly and phases to the extent that is supported by informative variants in the nanopore reads. GFAse then takes a partially phased assembly GFA and extends phasing using orthogonal phasing information. GFAse can perform phasing based on any alignable data type (HiC, Pore-C, etc.). For Shasta graphs, GFAse can also use parental sequencing. The pathways with bolded arrows and blue fill are the methods that are previously undescribed.
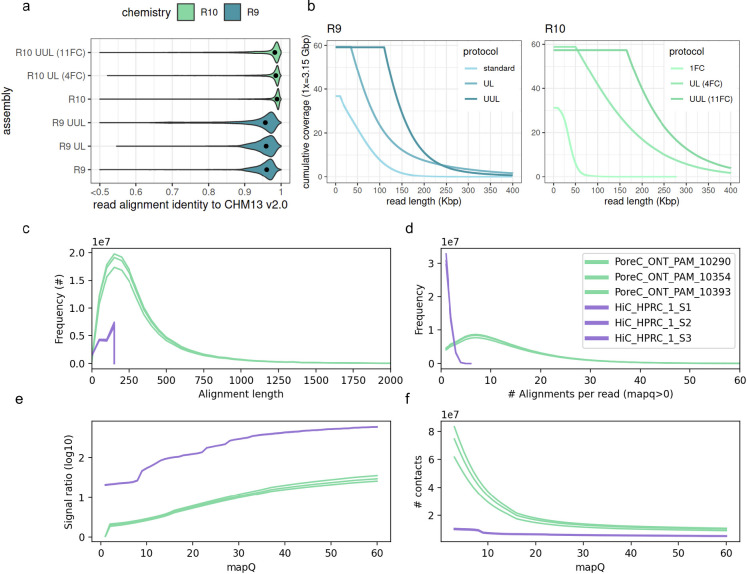
a-b) Identity and length metrics for nanopore read sets used in the HG002 evaluation. c-f) Pore-C and Hi-C metrics for contacts and signal ratio, measured on a per-library basis. “Alignment length” and “alignments per read” are proxies for subread statistics. Only mappings which are usable for phasing are shown, i.e with mapping quality (mapQ) >0 in a diploid reference. Signal ratio is computed using a high quality trio-phased assembly to indicate the number of consistent and inconsistent contacts (see methods).
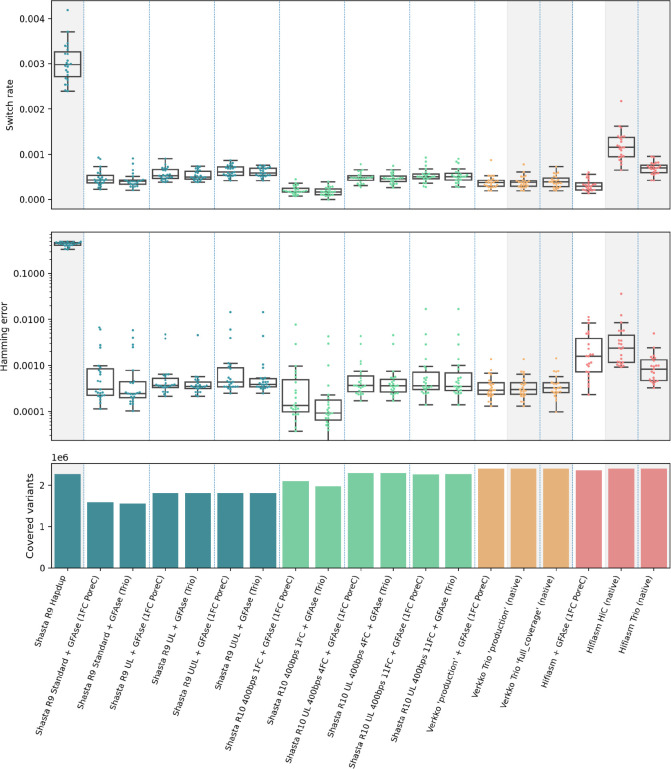
Phasing metrics for HG002 assemblies, as evaluated using the GIAB v4.2.1 benchmark VCF, phased with StrandSeq using WhatsHap (see methods). All shasta assemblies are unpolished. Assemblies not phased with GFAse are shaded gray. Each dot represents a chromosome error rate, generated by WhatsHap compare. Native Hifiasm HiC uses 30x coverage. Each pair of HiC is ~17x. PoreC flowcells have ~30x yield.
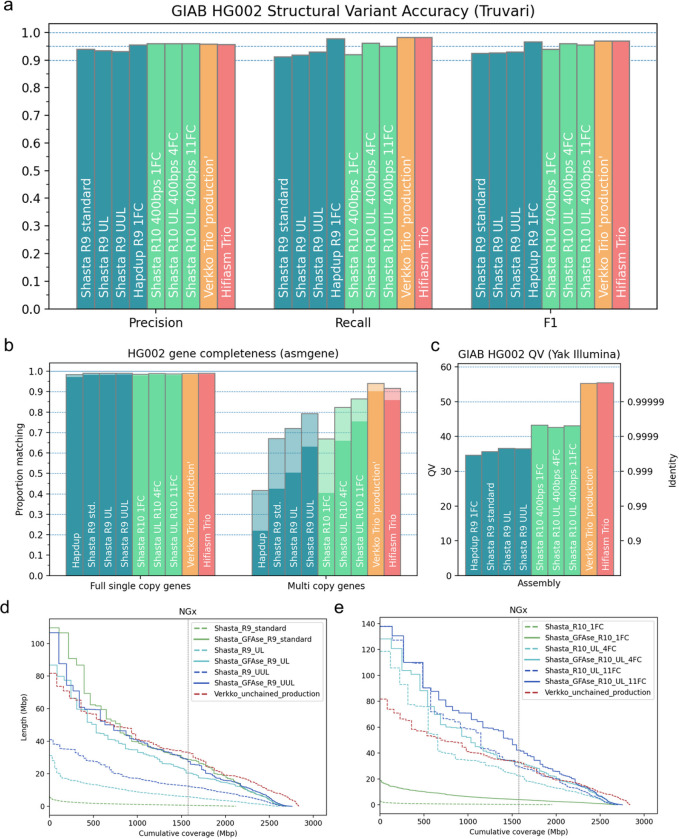
Structural variant, base level, and gene level accuracy metrics for HG002 assemblies. a) Base accuracy evaluated using yak with Illumina NovaSeq. b) Gene completeness measured by asmgene using human transcript sequences. “Full single copy” genes only indicate unfragmented, non-duplicated genes, matching transcripts by 99% or greater coverage and stratified by >97% (translucent) or >99% identity (opaque). Multicopy genes are similarly stratified. c) SVs evaluated using the GIAB Tier1 benchmark VCF with Truvari. d-e) NGx Plots for Shasta haplotypes, before and after unzipping bubble chains with GFAse. For comparison, the phased portion of the un-chained Verkko ‘production’ assembly is shown. The vertical line indicates the NG50 for each assembly.
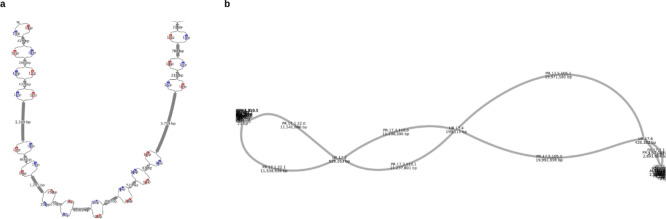
The two types of Shasta output graphs, visualized as a 2D layout in Bandage at two different scales. a) A subregion of the “Assembly-Detailed.gfa”, showing a near-variant scale nodes in a bubble chain and their phasing indicated by colors produced by Shasta. b) A subregion of the “Assembly-Phased.gfa” showing a phased portion of chr11 from HG002 which terminates at two tangles, presumably caused by telomeric and centromeric sequences.
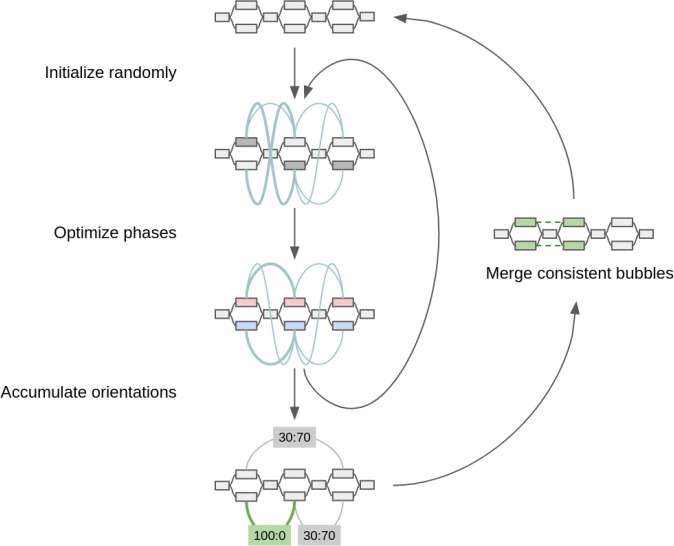
Diagram of sampling method for optimizing proximity linkages in an assembly graph. Edge weights in the contact graph are represented by teal curves. For each inner iteration, a greedily converged phase state is used to update a distribution of orientations among bubbles. Bubbles with the strongest signal at the end of sampling are merged for successive iterations. By the end of each round r of merging, the largest possible bubble set is 2^r in size.
Similar articles
-
Phased nanopore assembly with Shasta and modular graph phasing with GFAse.Genome Res. 2024 Apr 25;34(3):454-468. doi: 10.1101/gr.278268.123. Genome Res. 2024. PMID: 38627094 Free PMC article.
-
Chromosome-scale assembly comparison of the Korean Reference Genome KOREF from PromethION and PacBio with Hi-C mapping information.Gigascience. 2019 Dec 1;8(12):giz125. doi: 10.1093/gigascience/giz125. Gigascience. 2019. PMID: 31794015 Free PMC article.
-
Benchmarking Long-Read Assemblers for Genomic Analyses of Bacterial Pathogens Using Oxford Nanopore Sequencing.Int J Mol Sci. 2020 Dec 1;21(23):9161. doi: 10.3390/ijms21239161. Int J Mol Sci. 2020. PMID: 33271875 Free PMC article.
-
Haplotyping-Assisted Diploid Assembly and Variant Detection with Linked Reads.Methods Mol Biol. 2023;2590:161-182. doi: 10.1007/978-1-0716-2819-5_11. Methods Mol Biol. 2023. PMID: 36335499 Review.
-
Oxford Nanopore MinION Sequencing and Genome Assembly.Genomics Proteomics Bioinformatics. 2016 Oct;14(5):265-279. doi: 10.1016/j.gpb.2016.05.004. Epub 2016 Sep 17. Genomics Proteomics Bioinformatics. 2016. PMID: 27646134 Free PMC article. Review.
References
-
- Marchini J. & Howie B. Genotype imputation for genome-wide association studies. Nat. Rev. Genet. 11, 499–511 (2010). - PubMed
Publication types
Grants and funding
LinkOut - more resources
Full Text Sources
Research Materials