. 2023 Jun;103(6):1077-1092.
doi: 10.1016/j.kint.2023.02.018. Epub 2023 Feb 28.

Single nuclei transcriptomics delineates complex immune and kidney cell interactions contributing to kidney allograft fibrosis

Affiliations

Single nuclei transcriptomics delineates complex immune and kidney cell interactions contributing to kidney allograft fibrosis

Jennifer M McDaniels et al. Kidney Int. 2023 Jun.

Abstract

Chronic allograft dysfunction (CAD), characterized histologically by interstitial fibrosis and tubular atrophy, is the major cause of kidney allograft loss. Here, using single nuclei RNA sequencing and transcriptome analysis, we identified the origin, functional heterogeneity, and regulation of fibrosis-forming cells in kidney allografts with CAD. A robust technique was used to isolate individual nuclei from kidney allograft biopsies and successfully profiled 23,980 nuclei from five kidney transplant recipients with CAD and 17,913 nuclei from three patients with normal allograft function. Our analysis revealed two distinct states of fibrosis in CAD; low and high extracellular matrix (ECM) with distinct kidney cell subclusters, immune cell types, and transcriptional profiles. Imaging mass cytometry analysis confirmed increased ECM deposition at the protein level. Proximal tubular cells transitioned to an injured mixed tubular (MT1) phenotype comprised of activated fibroblasts and myofibroblast markers, generated provisional ECM which recruited inflammatory cells, and served as the main driver of fibrosis. MT1 cells in the high ECM state achieved replicative repair evidenced by dedifferentiation and nephrogenic transcriptional signatures. MT1 in the low ECM state showed decreased apoptosis, decreased cycling tubular cells, and severe metabolic dysfunction, limiting the potential for repair. Activated B, T and plasma cells were increased in the high ECM state, while macrophage subtypes were increased in the low ECM state. Intercellular communication between kidney parenchymal cells and donor-derived macrophages, detected several years post-transplantation, played a key role in injury propagation. Thus, our study identified novel molecular targets for interventions aimed to ameliorate or prevent allograft fibrogenesis in kidney transplant recipients.

Keywords: chronic kidney injury; fibrosis development; kidney transplantation; snRNA-seq.


Figures

Fig. 1.
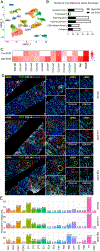
Fig. 1.. Single nuclei RNA-seq analysis in normal/nonspecific and fibrotic human kidney grafts.
(A) UMAP visualization of 41,893 nuclei from (3 normal and 5 fibrotic grafts) integrated into a single dataset. CDI1, collecting duct intercalated 1; CDI2, collecting duct intercalated 2; CDP1, collecting duct principal 1; CDP2, collecting duct principal 2; DT1, distal tubular 1; DT2, distal tubular 2; DT3, distal tubular 3; EC1, endothelial 1; EC2, endothelial 2; EC3, endothelial 3; FB1, fibroblast 1; FB2; fibroblast 2; IMM, immune; MT1, mixed tubular 1; MT2, mixed tubular 2; POD, podocyte; PT, proximal tubular cells; and UNKN1, unknown 1. (B) Number of matrisome genes expressed by each classification. Black, low ECM; White, high ECM. (C) Heatmap of the expression of 14 selected matrisome genes from fibrotic kidney grafts with low and high ECM expression. Gene expression is represented across all cell clusters. Bolded, critical fibrogenic genes; FC, log2 fold change. (D) Imaging mass cytometry (IMC) staining confirmed ECM deposition levels and localization in matched kidney biopsies. The image shows expression of αSMA (alpha smooth muscle actin cells, AQP1 (proximal tubulars), CD31 (endothelial cells), COL1A1 (collagen 1), eCAD (tubulars), and VIM (fibroblasts). Red boxes denoted by a 1 or 2 is enlarged to the right of the image to show spatial resolution of the glomerulus. The last panels (far right) are enlarged to detail αSMA, VIM, or COL1A1 expression. (E) Proportion of single cells in each cluster per classification. Cell clusters are colored by population.
Fig. 2.
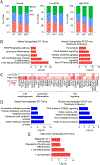
Fig. 2.. Cell cycle and gene expression analysis of the mixed tubular 1 cell cluster.
(A) Proportion of epithelial tubular cells at different cell cycle stages using average transcriptional expression data. Orange, G1 phase; green, S phase; and blue, G2M phase. MT1, mixed tubular 1; MT2, mixed tubular 2; and PT, proximal tubular cells. (B) Gene enrichment analysis showing the top upregulated GO terms and pathways shared in fibrotic grafts. (C) Heatmap of upregulated gene expression using selected genes panel B. Expression is represented as log2 FC values. (D) Gene ontology pathway analysis showing the top downregulated GO terms and pathways shared in fibrotic grafts. (E) Gene ontology pathway analysis showing the top upregulated pathways unique to high ECM.
Fig. 3.
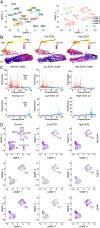
Fig. 3.. Pseudotime and trajectory analysis of gene expression displaying dynamic changes in proximal tubular cells and mixed tubular cell clusters.
(A) UMAP of combined classes with 18 cell clusters (right) giving rise to a total of five unsupervised partitions (right). CDI1, collecting duct intercalated 1; CDI2, collecting duct intercalated 2; CDP1, collecting duct principal 1; CDP2, collecting duct principal 2; DT1, distal tubular 1; DT2, distal tubular 2; DT3, distal tubular 3; EC1, endothelial 1; EC2, endothelial 2; EC3, endothelial 3; FB1, fibroblast 1; FB2; fibroblast 2; IMM, immune; MT1, mixed tubular 1; MT2, mixed tubular 2; POD, podocyte; PT, proximal tubular cells; and UNKN1, unknown 1. (B) The single-cell trajectory reconstructed by Monocle 2 displaying normal (left), low ECM (middle), and high ECM (right). Each point represents a cell state at a specific time. Cells start at the root, marked by encircled one, and progress to one of three alternative reprogramming outcomes, denoted by PT, MT, FB1, and FB2. Cells must pass through the intermediate cluster MT1. Trajectory curve is highlighted by a solid black line. (C) Expression dynamics of CUBN (top) and C7 (bottom) along pseudotime that supports functional transition from PT to MT1 to FB1 and FB2 cell clusters. Cells are colored by their cluster. Orange, PT; green, MT1; blue, FB1; and purple, FB2. Solid blue line denotes average expression along pseudotime. (D) UMAP of epithelial cells with quantification of HAVCR1, CASP3, and MKI67 expression across each classification.
Fig. 4.
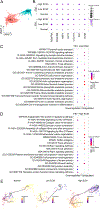
Fig. 4.. Gene expression and trajectory analysis of fibroblast clusters.
(A) UMAP of FB1 and FB2. (B) Dot plot of DEGs to distinguish clusters. FB1 GO enrichment analysis for (C) low and (D) high ECM. Comparison of the GO terms by p-value and gene ratio (defines the number of DEGs in associated with the GO term). Analysis was performed with ggplot2 in R. (E) Individual trajectories along pseudotime for normal (left), low ECM (middle), and high ECM (right). Solid black line depicts the expression curves for each branch over pseudotime. Encircled one, origin of trajectory.
Fig. 5.
Fig. 5.. Immune cells in the human kidney grafts.
(A) UMAP visualization of the immune cell cluster, highlighted in green. (B) Compiled immune cell subclustering of over 2,000 cells integrated into a single dataset and by each classification. B, B cells; CD8 T, CD8+ T cells, cDC, conventional dendritic cells; Mast, mast cells; MΦ1, macrophage subcluster 1; MΦ2, macrophage subcluster 2; MΦ3, macrophage subcluster 3; NK, natural killer T cells; pDC; plasmacytoid dendritic cells; Plasma, plasma cells; T, T cells; and Tregs, regulatory T cells. (C) Proportion of single immune cells. Cell clusters are represented with the same colors as in A. (D) Imaging mass cytometry (IMC) staining confirmed immune cell presence and localization in matched kidney biopsies. The image shows expression of AQP1 (proximal tubules), CD31 (endothelial cells), CD4+ (T cells), CD8+ (T cells), CD20 (B cells), and CD68 (macrophages). Red boxes denoted by a 1 or 2 is enlarged to the right of the image to show spatial resolution of the glomerulus. The last panels (far right) are enlarged to detail kidney architecture (AQP1, CD31, eCAD), CD4, CD8, CD29, CD68 expression. (E) UMAPs of XY chromosome linked gene expression analysis of immune cells in sex-matched and -mismatched kidney transplants. Red, KDM5D expression (Y chromosome linked gene); and green, XIST expression (X chromosome linked gene). F, female; and M, male.
Fig. 6.
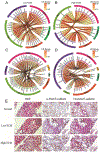
Fig. 6.. Cell-cell interactions and stained tissue spatial validation.
(A-B) Cell-cell interactions and stained tissue spatial validation. (A-B) Ligand receptor (LR) interactions between tissue macrophages (MΦ1–3) and fibroblasts (FB1–2) subclusters. (C-D) LR interactions between tissue macrophages (MΦ1–3) and tubular epithelial cells (PT, MT1, and MT2). Arrows point towards receptors; left panels: Low ECM and right panels: high ECM. (E) Representative images of H&E staining and immunohistochemistry staining of normal (KUT060), low ECM (KUT040), and high ECM (KUT076). Histopathological abnormalities in low and high ECM states are shown. Scale bars, 200μm.
Fig. 7.
Fig. 7.. Molecular and cellular landscape of human kidney graft fibrogenesis.
Proximal tubular (PT) epithelial cells are the first responders to kidney insults, such as ischemia reperfusion injury (early stressors) or sustained subclinical injury (late stressors). Healthy PT cells may resolve the injury and stabilize graft function (normal allografts), while injured PT cells (MT1) generate a provisional ECM that attracts inflammatory cells, facilitating their infiltration and propagating injury (fibrotic allografts). Fibrotic signaling is enhanced by secretion of growth factors (PDGF, VEGF) and upregulation of signaling pathways (NOTCH, Wnt). The processes are heterogeneous and lead to different molecular states—low ECM and high ECM. Low ECM is characterized by a decreased of cycling cells, severe PT metabolic dysfunction, and decreased apoptosis. High ECM activates maladaptive replicative repair and enters a perpetual state of tissue regeneration, scarring, and ECM accumulation. These two conditions are characterized by different proportions of immune cells. Low ECM is marked by increased dendritic (cDCs, pDCs), mast, and macrophages (MΦ1, MΦ2) cells whereas high ECM is marked by increased B, T (CD8+ T cells, NKs, and Tregs), and plasma cells. Resident macrophages and kidney cells interactions demonstrate the critical role of these cells and their cross talk in the propagation of injury. Low and high ECM are distinguishable by the secretion of different cytokines and ECM-related factors. In response to injury, MT1 cells transition into transcriptionally active fibroblasts enriched in myofibroblast markers. MT1 in high ECM was characterized by dedifferentiation and nephrogenic signatures, supporting a high degree of replicative repair, that was not observed in low ECM. Although both conditions progress to fibrosis, the severity of metabolic dysfunction of PT cells in low ECM limits repair, whereas the degree of immune cell activation in high ECM promotes a positive feedback loop inducing maladaptive repair. Interventions aimed at graft fibrogenesis likely require a more targeted approach based on the unique molecular pathways characterizing each condition.

Similar articles

Cited by

References

    1. Srivastava A, Palsson R, Kaze AD, et al. The Prognostic Value of Histopathologic Lesions in Native Kidney Biopsy Specimens: Results from the Boston Kidney Biopsy Cohort Study. J Am Soc Nephrol. 2018;29(8):2213–2224. doi:10.1681/ASN.2017121260 - DOI - PMC - PubMed
    1. Nankivell BJ, Borrows RJ, Fung CLS, et al. The natural history of chronic allograft nephropathy. N Engl J Med. 2003;349(24):2326–2333. doi:10.1056/NEJMoa020009 - DOI - PubMed
    1. Najafian B, Kasiske BL. Chronic allograft nephropathy. Curr Opin Nephrol Hypertens. 2008;17(2):149–155. doi:10.1097/MNH.0b013e3282f4e514 - DOI - PubMed
    1. El-Zoghby ZM, Stegall MD, Lager DJ, et al. Identifying specific causes of kidney allograft loss. Am J Transplant. 2009;9(3):527–535. doi:10.1111/j.1600-6143.2008.02519.x - DOI - PubMed
    1. Nicholson ML, McCulloch TA, Harper SJ, et al. Early measurement of interstitial fibrosis predicts long-term renal function and graft survival in renal transplantation. Br J Surg. 1996;83(8):1082–1085. doi:10.1002/bjs.1800830813 - DOI - PubMed

Publication types